 Open Access Article
Creative Commons Attribution 3.0 Unported Licence
Synthesis of copolyesters with bio-based lauric diacid: structure and physico-mechanical studies
Meiling Chena,
Nesren A. H. Saadaab,
Fei Liu *b,
Haining Na
 *b and
Jin Zhub
aCollege of Food and Pharmacy, Zhejiang Ocean University, Zhoushan, Zhejiang 316000, P. R. China
bKey Laboratory of Bio-based Polymeric Materials of Zhejiang Province, Ningbo Institute of Materials Technology and Engineering, Chinese Academy of Sciences, Ningbo, Zhejiang 315201, P. R. China. E-mail: nahaining@nimte.ac.cn; liufei@nimte.ac.cn; Fax: +86-574-86685120; Tel: +86-574-86685120
First published on 8th December 2017
Abstract
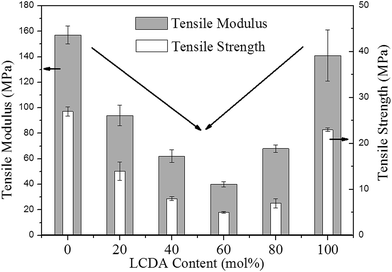
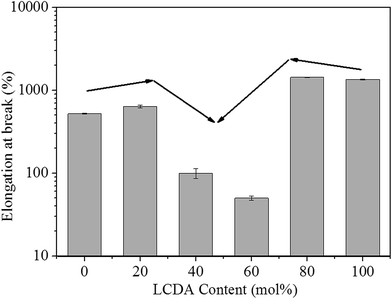
Lauric diacid (LCDA), also known as 1,12-dodecanedioic acid, is used to develop a series of copolyesters along with 1,4-cyclohexanedicarboxylic acid (CHDA) and 1,4-butanediol (BDO). The resulting poly(butylene lauric dicarboxylate-co-butylene 1,4-cyclohexanedicarboxylate) (PBLC) is proved to be a random copolyester with three triad sequences. When the LCDA content increases from 20 to 60 mol%, Tm of the copolyester decreases from 133 to 57 °C. At the same time, the tensile modulus and strength decrease from 94 and 14 MPa to 40 and 5 MPa, respectively. Moreover, the elongation at break also drops from 640 to only 50%. However, further increasing the LCDA content to 80 mol%, the copolyester becomes amorphous with no Tm, and its tensile modulus, strength, and the elongation at break all improve significantly to 68 and 7 MPa, and over 1400%, respectively. More importantly, for the homo-polymer poly(butylene lauric dicarboxylate) (PBL), it has a relatively high Tm of 73 °C compared to that of polycaprolactone (PCL), but lower tensile modulus and strength, and significantly higher ductility, compared to those of PCL, linear low density polyethylene, and polybutylene succinate.
1 Introduction
Polyesters with linear aliphatic chains have attracted more and more attention from people over the last decades, because they can meet the growing demand in the development of biodegradable and renewable alternatives to non-biodegradable and fossil-based polyesters such as poly(ethylene terephthalate) (PET), and poly(butylene terephthalate) (PBT). Among them, poly(lactic acid) (PLA),1 poly(butylene succinate) (PBS),2 and poly(hydroxyalkanoates) (PHAs)3 have been studied extensively. They have been successfully commercialized and used in many fields such as food packaging, medical devices, 3D printing, and agriculture. These polyesters with linear aliphatic chains typically have ten carbons or less in the backbone, and therefore have low melting points but good biodegradability.2 On the other hand, other types of polyester with linear aliphatic chains usually have 12 carbons or more. They have structures and properties similar to those of polyethylene because of the low density of the ester functional group.4 For example, they have higher melting temperatures and hydrophobicities, and better crystallization abilities, which results in decreased biodegradabilities.4,5Likewise, monomers used for the synthesis of long-chain aliphatic polyesters are mostly derived from renewable resources such as fatty acids, via biotransformation or chemical synthetic routes.4 Monomers with carbon numbers up to 194 have been developed.6 And polyesters with up to 44 –CH2– units between two ester groups have been reported.7 These results are proof of concept that long-chain linear aliphatic monomers and their correspondent polyester products can be designed and synthesized, so that the gap between semi-crystalline polyolefins and traditional polyesters can be bridged.8–14
Of particular interest, long-chain dicarboxylic acids with 12 to 20 carbons have been produced in large scale and are commercially available.4 Polyesters and polyamides have been synthesized from these monomers.4 Interestingly, the long-chain dicarboxylic acids with 14 to 20 carbons are building blocks of naturally occurring polyesters such as suberin in cork.15 However, the one with 12 carbons, namely lauric diacid (LCDA), also known as 1,12-dodecanedioic acid, does not exist in nature. It is therefore a brand new compound created by human beings. Both chemical16–18 and biological19,20 methods have been developed for the preparation of LCDA. The chemical synthetic route usually consists of multi-step reactions in order to get cyclic ketones, which subsequently are converted to LCDA via oxidation.16–18 On the other hand, the biological way involves fermentation process using wild type or engineered yeast strains, such as Candida sorbophila.19 Fatty acid or alkane can be used as substrates for this process.19,20 Nowadays, LCDA has become one of the most widely used monomers for the synthesis of long-chain aliphatic polyesters21–27 and polyamides.28,29 It is worth noting that the commercially available LCDA is mainly produced via biotransformation from alkane (i.e. dodecane) by companies such as Cognis in US, and Cathay Industrial Biothech in China.4
Polyesters synthesized from LCDA and different diols with an even number of methylene units have melting temperatures ranging from 67 to 90 °C.30–33 Among them, polyester derived from LCDA and 1,4-butanediol (BDO), namely poly(butylene lauric dicarboxylate) (PBL), has melting point of 74 °C,24 which is higher than that of poly(butylene adipate) (PBA) (58 °C) and poly(caprolactone) (PCL) (60 °C),4 but lower than that of PBS (113 °C).2 Moreover, Celli et al. found that PBL has high thermal stability and good crystallization ability, similar to that of polyethylene,26 but with fairly good biodegradability.24 Modification on PBL has been performed via introduction of aromatic24 as well as aliphatic ring structure.34 It was found that incorporation of 70 mol% aromatic ring dramatically hinders the biodegradability of the copolyester,24 while the same amount of aliphatic ring greatly increases the degradation rate of the copolyester.34 Since the later one, namely poly(butylene lauric dicarboxylate-co-butylene 1,4-cyclohexanedicarboxylate) (PBLC), retains similar biodegradation ability compared to PBL, but has better and tunable properties in a relatively wide range, it is of great importance to reveal the structure–property relationship in this copolyester with different compositions. Therefore, in the current work, we will focus on the sequence distribution and mechanical properties of PBLC, which have not been investigated before. Comparison between PBLC copolyesters and other polyesters with shorter chain as well as polyethylene will be made, in order to provide valuable information to find potential application for the copolyesters.
2 Experimental section
2.1 Materials
LCDA, BDO, and titanium(IV) butoxide were all purchased from Aladdin Reagent Co., Ltd (Shanghai, China). trans-1,4-Cyclohexanedicarboxylic acid (trans-CHDA) (99%) was purchased from Nanjing Chemlin Chemical Industry Co., Ltd. Chloroform was obtained from Sinopharm Chemical Reagent Co., Ltd (Shanghai, China). All the chemicals were used as received without further treatment.2.2 Synthesis of PBLC copolyesters
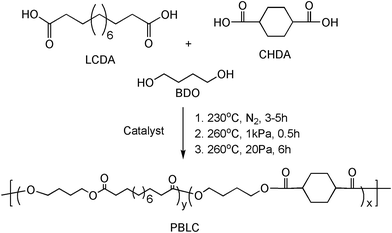
PBLC copolyesters were prepared via a two-stage melt polycondensation process involving esterification reaction at 230 °C under N2, followed by transesterification reaction at 260 °C under vacuum (Scheme 1). A typical process for the synthesis of PBLC (with 20 mol% of PBL) is described as following. trans-CHDA (13.76 g, 0.08 mol, 4 eq.), LCDA (4.60 g, 0.02 mol, 1 eq.), and BDO (14.40 g, 0.16 mol, 8 eq.) were charged to a 250 mL round bottom flask equipped with an overhead mechanical stirrer and distillation device. Ti cat. (1.84 mg, 0.1 wt% of the amount of total diacid) was added to the mixture. The flask was then sealed and applied vacuum (∼10 Pa), followed by purging with dry N2. This cycle was repeated for three times to remove air and moisture. Subsequently, the flask was heated to 230 °C under N2 for 3–5 h to finish the esterification reaction. The system was then evacuated to about 1 kPa and simultaneously increased the reaction temperature to 260 °C, and kept for about half hour to start the second stage, namely the transesterification reaction. It was then placed under vacuum below 20 Pa for about 6 h to remove the extra amount of BDO in order to get high molecular weight products.Four PBLC copolyesters were synthesized and denoted as PBLC-x, where x stands for the molar ratio of PBL, which is in the range of 20 to 80 mol%. For example, PBLC-20 means that the polymer contains 20 mol% of PBL. Besides, PBL homopolymer was also synthesized for comparison. All resulted polymers were used without further treatment.
2.3 Characterization
![[thin space (1/6-em)]](https://www.rsc.org/images/entities/char_2009.gif) 000 g mol−1). The concentration of copolyesters was about 6.7 mg mL−1.
000 g mol−1). The concentration of copolyesters was about 6.7 mg mL−1.where χc is the degree of crystallinity, f is the weight fraction, ΔHm is the experimental melting heat of fusion, and ΔHθm is the heat of fusion of 100% crystalline (170 J g−1 for PBL and 141 J g−1 for trans-PBC calculated according to the group contribution theory).35
3 Results and discussions
3.1 Molecular characterization
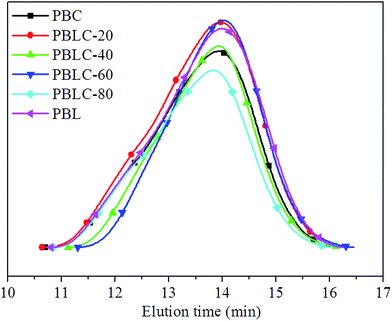
PBL, PBC, and four PBLC copolyesters with different compositions were successfully obtained. The number average molecular weight (Mn) and molecular weight distribution (ÐM) were determined by GPC analysis. Fig. 1 shows the GPC curves of PBL, PBC, and PBLC copolyesters. Only a single peak was observed centered at elution time of about 14 min, indicating that there is no oligomer in the product. All samples have high Mn around 30![[thin space (1/6-em)]](https://www.rsc.org/images/entities/char_2009.gif) 000 g mol−1 and ÐM ranging from 1.9 to 2.5.
000 g mol−1 and ÐM ranging from 1.9 to 2.5.
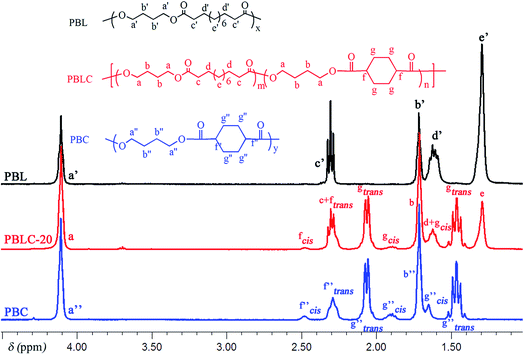
The molecular structure was analyzed and confirmed by 1H NMR spectra. As shown in Fig. 2, all peaks with different chemical shifts are carefully attributed to correspondent protons in PBL, PBC, and a typical copolyester PBLC-20.34,36 The compositions of the PBLC copolyesters were determined according to the integration (Ie, Ig-trans, and If-cis) of three peaks located at δ = 1.294 ppm (e), 1.466 ppm (g-trans), and 2.478 ppm (f-cis) (eqn (1)). The molar ratio of trans-CHDA isomer in the final products was calculated according to eqn (2), due to the fact that the protons g and f have different chemical shifts for different CHDA isomers. The correspondent results are listed in Table 1. All samples have PBL molar percentage close to their feed ones. Moreover, the trans-CHDA amount of all samples are controlled at around 90 mol%, indicating small amount of isomerization.
 | (1) |
 | (2) |
| Sample | 1H NMR | GPC | 13C NMR | ||||
|---|---|---|---|---|---|---|---|
| PBL (mol%) | trans-CHDA (mol%) | Mn (g mol−1) | ÐM | LBL | LBC | R | |
| PBC | 0 | 88 | 33![[thin space (1/6-em)]](https://www.rsc.org/images/entities/char_2009.gif) 000 000 |
2.5 | — | — | — |
| PBLC-20 | 20 | 92 | 34![[thin space (1/6-em)]](https://www.rsc.org/images/entities/char_2009.gif) 300 300 |
2.2 | — | — | — |
| PBLC-40 | 38 | 91 | 25![[thin space (1/6-em)]](https://www.rsc.org/images/entities/char_2009.gif) 500 500 |
1.9 | 1.67 | 2.24 | 1.04 |
| PBLC-60 | 55 | 89 | 30![[thin space (1/6-em)]](https://www.rsc.org/images/entities/char_2009.gif) 000 000 |
2.0 | 2.66 | 1.51 | 1.04 |
| PBLC-80 | 74 | 89 | 29![[thin space (1/6-em)]](https://www.rsc.org/images/entities/char_2009.gif) 000 000 |
2.4 | — | — | — |
| PBL | 100 | — | 27![[thin space (1/6-em)]](https://www.rsc.org/images/entities/char_2009.gif) 400 400 |
2.4 | — | — | — |
Although the compositions of PBLC copolyesters can be determined easily from 1H NMR, the sequence distribution, number-average length of units, and randomness of the copolyesters were unable to obtain according to the 1H NMR analysis. Previous studies on a copolyester containing 2,5-furandicarboxylic acid have suggested that the protons of –OCH2– unit in different triads have different chemical shifts resulting from the conjugation effect because of aromatic furan ring.37 When the aliphatic CHDA is used instead, there is no conjugation effect. Thus the protons of –OCH2– unit in different sequences have the same chemical shift around 4.10 ppm as show in Fig. 2. Similar observation has been reported in the literature before for PBLC as well as poly(butylene adipate-co-butylene 1,4-cyclohexanedicarboxylate) (PBAC).34,36 However, in the case of PBAC, it was possible to determine the sequence distribution, number-average length of units, as well as randomness from 13C NMR analysis in a sample with 50 mol% of PBC.36 Therefore, we performed detailed analysis on the 13C NMR of PBLC copolyesters in order to find out the sequence distribution of these copolyesters, which has failed to be revealed in a previous study.34
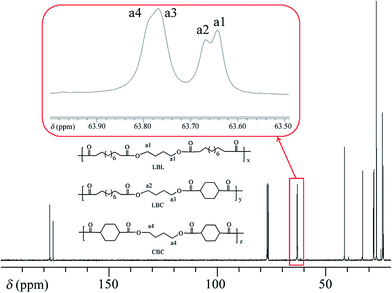
We performed 13C NMR for the four PBLC copolyesters and found that for both PBLC-40 and PBLC-60, there are distinguishable peaks for the chemical shifts in the range of 63.50–63.90 ppm, which could be assigned to different triads sequences in PBLC copolyesters (Fig. 3). The signal in this range is due to the carbons in the butylene unit connected to the ester bond.38 From Fig. 3, it can be seen clearly that the three different triads sequences present in the PBLC copolyesters (LBL, LBC, and CBC, see Fig. 3) would result in four different peaks, namely a1, a2, a3, and a4. Their chemical shifts are located at 63.642, 63.669, 63.765, and 63.790 ppm, respectively. The assignment of the peaks to different carbons was based on the fact that the ester bond connected to the aliphatic ring structure has stronger inductive effect than the one connecting to the long aliphatic chain. Therefore, carbon a4 has the highest chemical shift at 63.790 ppm, while carbon a1 has the lowest one at 63.642 ppm.36,38 By performing a peak fitting on the original curve, four independent peaks can be resolved as displayed in Fig. 4. As a result, the number-average length of BL and BC units (LBL and LBC), and randomness (R) can be calculated from the integration of the four resolved peaks according to eqn (3)–(5), where Ia1, Ia2, Ia3, and Ia4 are integration of the four resolved peaks as showed in Fig. 4. The calculated results are summarized in Table 1.
 | (3) |
 | (4) |
 | (5) |
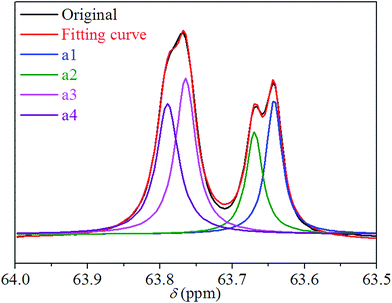 | ||
| Fig. 4 Peak fitting for chemical shifts of carbons of a1, a2, a3, and a4 in different triads present in PBLC-40. | ||
Both PBLC-40 and PBLC-60 have randomness of 1.04, which is very close to 1, indicating that both of them are random copolyesters. However, since they have different compositions, their unit length are different. PBLC-40 has shorter BL unit length but longer BC unit length than those of PBLC-60. This result is reasonable since PBLC-40 has less amount of BL unit and more amount of BC unit in its molecular chain, compared with that of PBLC-60. For the rest two PBLC copolyesters, namely PBLC-20 and PBLC-80, we were unable to find four distinguishable peaks in the same region. Probably because the signal from the dominate component makes that of the minority one become negligible. Therefore, no further information can be found on the sequence distribution for these two samples. Nevertheless, the results from PBLC-40 and PBLC-60 copolyesters can be used to conclude that PBLC samples are random copolyesters.34
3.2 Thermal properties and crystal structure
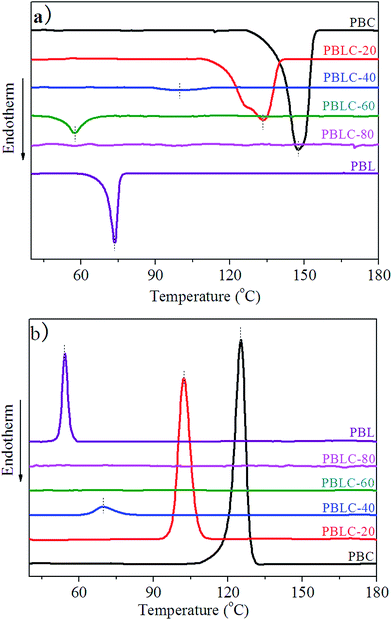
The thermal properties including melting temperature (Tm), crystallization temperature (Tc), and thermal stability of PBL, PBC, and PBLC copolyesters were investigated by using DSC and TGA analysis.Fig. 5 shows the DSC curves of these samples in the second heating, and cooling scans. Table 2 collects the relevant thermal data. In the first place, from Fig. 5 we can see that both PBL and PBC homo-polymers are able to crystallize, and show strong and sharp peaks in the second heating and cooling scans. PBL has Tm of 73 °C, Tc of 54 °C, melting enthalpy (ΔHm) of 7 J g−1 and degree of crystallinity (χc) of 4.0%. All these values are lower than those of PBC. Especially, the low χc of PBL indicates that it has weaker crystallization ability compared to that of PBC. Comparing with other linear aliphatic polyesters derived from BDO and dicarboxylic acids with different carbon numbers, PBL has higher Tm than those with shorter chain length in the dicarboxylic acids, except for succinic acid (PBS, Tm 113 °C) and ethanedioic acid (PBE, Tm 105 °C), and lower Tm than those with longer chain length in the dicarboxylic acids.4 In the second place, for the rest four PBLC copolyesters, both Tm and Tc decrease steadily with the increasing of BL content. In addition, both ΔHm and χc decrease to fairly small value, indicating poor crystallization ability. As we can see from Fig. 5 that melting peaks become broad and weak. When BL content is 80 mol%, namely PBLC-80, the copolyester shows neither melting nor crystallization peak in the DSC curves. Therefore, from the DSC analysis, PBLC-80 is an amorphous copolyester. For PBLC-60 on the other hand, it shows a very small peak in the second heating scan but no peak in the cooling scan, indicating fairly poor crystallization ability, compared with other copolyesters and the homo-polymers.
| Sample | Tm (°C) | ΔHm (J g−1) | Tc (°C) | χc (%) | T5% (N2) (°C) | Td,max (N2) (°C) |
|---|---|---|---|---|---|---|
| a Melting temperature Tm, melting enthalpy ΔHm and degree of crystallinity χc are determined from second heating scan of DSC curves and the crystallization temperature Tc is determined from the cooling scans of DSC curves, the temperature at 5% weight loss T5% is determined by TGA in N2 atmosphere. | ||||||
| PBC | 147 | 24 | 125 | 19.3 | 382 | 409 |
| PBLC-20 | 133 | 17 | 103 | 12.2 | 371 | 408 |
| PBLC-40 | 98 | 1 | 70 | 0.7 | 373 | 412 |
| PBLC-60 | 57 | 2.5 | — | 1.6 | 378 | 412 |
| PBLC-80 | — | — | — | — | 380 | 415 |
| PBL | 73 | 7 | 54 | 4.0 | 375 | 417 |
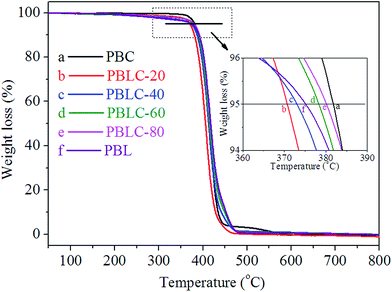
Fig. 6 shows the TGA curves of PBL and PBLC copolyesters, the related data are collected in Table 2. PBL has slightly lower T5% but higher Td,max than those of PBC. Moreover, for the four PBLC copolyesters, both T5% and Td,max increase gradually with the increasing of BL content, indicating increased thermal stability. Nonetheless, all samples have high thermal resistance with T5% and Td,max over 370 and 405 °C, respectively. As a result, these materials can be processed safely without thermal degradation at temperatures 30–50 °C higher than their corresponding Tm.
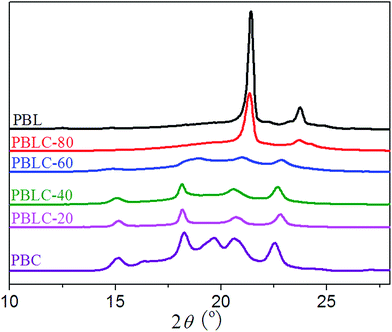
The crystalline structure of PBL, PBC, and PBLC copolyesters was studied by using X-ray diffraction (XRD). The XRD patterns displayed in Fig. 7 clearly indicate that PBL and PBC homo-polymers have totally different crystalline structure. The crystal lattice of PBC is of triclinic type,36 with diffraction peaks at 2θ = 15.16, 16.34, 18.24, 19.64, 20.59, and 22.53°. On the other hand, PBL is of the orthorhombic type similar to that of polyethylene,4,26 with diffraction peaks at 2θ = 21.39, and 23.72°. For the other four PBLC copolyesters, their crystalline structure can be divided into two groups. For PBLC-20, 40, and 60, they are the triclinic type similar to that of PBC. For PBLC-80, it is the orthorhombic type similar to that of PBL.39
For the first group, with increasing amount of BL unit, the intensity of the diffraction peaks becomes weak, and the peak at 2θ = 19.64° disappears. This observation is similar to what has been reported in a PBAC copolymer series.36 Therefore, this result suggests that the crystalline phase in this group of PBLC copolyesters is the PBC crystalline phase.39 Incorporation of BL unit hinders the crystallization of BC unit, and only small amount of BC unit is able to organize into crystalline phase. This explains the fact that this group of PBLC copolyesters have very low heat of fusion and degree of crystallinity, as showed in Table 2. Moreover, the BL unit is in the amorphous region.
Based on these results, it is reasonable to imply that the decreasing of Tm from 133 to 57 °C for the first group of PBLC copolyesters is due to the depression effect of the non-crystalline BL unit on the BC unit. This depression effect can be quantitatively described by the Flory equation.40 The Flory equation deals with the relationship between the Tm of the PBLC copolyester (Tm,PBLC) and the equilibrium Tm of the PBC homo-polymer  , as showed in eqn (6):
 | (6) |
![[thin space (1/6-em)]](https://www.rsc.org/images/entities/char_2009.gif) p and 1/Tm,PBLC, for the first group of PBLC copolyesters, as showed in Fig. 8. The correlation coefficient (R2) for the linear fitting is 0.999. Therefore, it can be concluded that when the BL content is lower than 60 mol%, the random PBLC copolyesters have decreased Tm due to the depression effect of the non-crystalline BL unit on the crystallizable trans-BC unit.
p and 1/Tm,PBLC, for the first group of PBLC copolyesters, as showed in Fig. 8. The correlation coefficient (R2) for the linear fitting is 0.999. Therefore, it can be concluded that when the BL content is lower than 60 mol%, the random PBLC copolyesters have decreased Tm due to the depression effect of the non-crystalline BL unit on the crystallizable trans-BC unit.
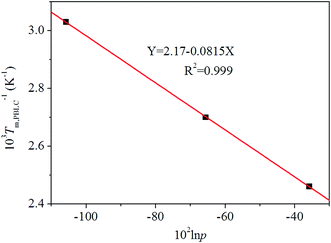 | ||
| Fig. 8 Plot of Flory equation (black squares) and linear fitting (red line) for the first group of PBLC copolyesters. | ||
3.3 Mechanical properties
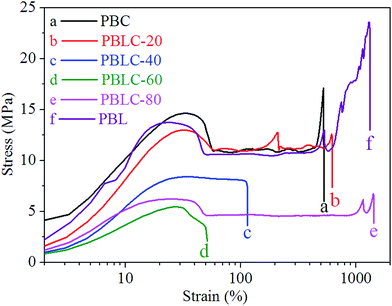
The mechanical properties of PBL and PBLC copolyesters were characterized by tensile testing. The representative tensile strain–stress curves are showed in Fig. 9, and the mechanical properties data are listed in Table 3. In the first place, for the two homo-polymers, PBL has very similar tensile modulus, but higher tensile strength and elongation at break compared to those of PBC.41 However, replacing BDO with 1,5-pentanediol, the resulted polyester PPeDo has tensile modulus of 344 MPa, which is significantly higher than that of PBL.42 Moreover, compared with some other polymers such as linear low density polyethylene (LLDPE), PBS, and PCL, PBL also has smaller modulus but higher elongation at break,42,43 probably because PBL has relatively low degree of crystallinity than those of the above mentioned polymers.42 In the second place, as showed in Fig. 10 and 11, when 20 mol% of a second unit is introduced to the homo-polymer, both PBLC-20 and PBLC-80 have largely decreased tensile modulus and strength, but slightly increased elongation at break, compared with those of PBC and PBL, respectively. This phenomenon is due to the fact that the introduction of the second units (i.e. BL or BC) breaks the crystalline of the homo-polymer. If we consider the two homo-polymers as rigid and tough materials, these two copolyesters can be considered as soft but tough materials. However, further increasing the amount of the second unit to 40 mol%, both PBLC-40 and PBLC-60 have further decreased tensile modulus and strength, and significantly decreased elongation at break. Moreover, both copolyesters break before they yield, therefore, no yield strength or strain can be observed. As a result, these two copolyesters are soft and brittle. In another word, increasing the amount of one unit from 0 to 50 mol%, namely decreasing the content of the other one from 100 to 50 mol%, the PBLC copolyester experiences a ductile-to-brittle transition. This transition is very different from other copolyesters series, in which the elongation at break of the copolyester with composition near 50/50 is usually the highest.43,44 A possible explanation to this phenomenon is due to the low Mn and possible high entanglement molecular weight for PBLC-40 and PBLC-60, in which the molecular chain can not form effective entanglements that are necessary for good ductility.45| Sample | E (Mpa) | σt (Mpa) | εb (%) | σy (Mpa) | εy (%) |
|---|---|---|---|---|---|
| a Tensile modulus E, tensile strength σt, elongation at break εb, yield stress σy and yield strain εy are determined by tensile testing. | |||||
| PBC | 157 ± 7 | 17.0 ± 1.0 | 520 ± 7 | 14.0 ± 1.0 | 21.0 ± 1.0 |
| PBLC-20 | 94 ± 8 | 14.0 ± 2.0 | 640 ± 27 | 12.0 ± 1.0 | 26.0 ± 1.0 |
| PBLC-40 | 62 ± 5 | 8.0 ± 0.4 | 100 ± 14 | — | — |
| PBLC-60 | 40 ± 2 | 5.0 ± 0.2 | 50 ± 3 | — | — |
| PBLC-80 | 68 ± 3 | 7.0 ± 1.0 | 1431 ± 16 | 7.0 ± 0.5 | 29.0 ± 0.2 |
| PBL | 141 ± 20 | 23.0 ± 0.4 | 1354 ± 16 | 13.0 ± 0.3 | 28.0 ± 0.1 |
4 Conclusion
In conclusion, we have developed a series of copolyesters from a bio-based long chain dicarboxylic acid and an aliphatic ring structure. The copolyesters with different compositions have very different structure and properties compared with their parenting homo-polymers. It was found that the copolyester is a random copolymer with three triad sequences according to the 13C NMR analysis. The copolyester with increasing amount of BL unit to 60 mol% tends to have decreased Tm as well as Tc, compared with those of the PBC homo-polymer. This is because the BL unit would form defect in the PBC crystalline region as proved by applying the Flory equation. Moreover, these copolyesters have the same crystalline lattice type to PBC. However, further increasing the BL unit to 80 mol% in the copolyester, it becomes amorphous as showed in DSC scans, and its XRD pattern is similar to that of PBL. For the first time the mechanical properties of the copolyesters are revealed. It was found that when the composition is getting close to 50/50, the tensile modulus and strength decrease gradually, but surprisingly, the elongation at break also drops sharply, compared with the two homo-polymers. In addition, for the homo-polymer PBL, although the tensile modulus is relatively low, it has better ductility compared to polymers like LLDPE, PBS, and PCL.Conflicts of interest
There are no conflicts to declare.Acknowledgements
The authors are grateful for the financial support by the Zhejiang Provincial Natural Science Foundation (ZJNSF, LQ15C200010), National Natural Science Foundation of China (NSFC, 51503217), Zhejiang Province Public Welfare Project (2017C31081) and Open Project Program of MOE Key Laboratory of Macromolecular Synthesis and Functionalization, Zhejiang University(2016MSF001).References
- K. Madhavan Nampoothiri, N. R. Nair and R. P. John, Bioresour. Technol., 2010, 101, 8493–8501 CrossRef CAS PubMed.
- J. Xu and B. H. Guo, Biotechnol. J., 2010, 5, 1149–1163 CrossRef CAS PubMed.
- G.-Q. Chen, Chem. Soc. Rev., 2009, 38, 2434–2446 RSC.
- F. Stempfle, P. Ortmann and S. Mecking, Chem. Rev., 2016, 116, 4597–4641 CrossRef CAS PubMed.
- X. Y. Lee, M. U. Wahit and N. Adrus, J. Appl. Polym. Sci., 2016, 133, 1–9 Search PubMed.
- F. Ian, F. Jens and I. Hiriyakkanavar, J. Chem. Soc., Perkin Trans. 1, 1998, 1229–1235 Search PubMed.
- C. L. F. De Ten Hove, J. Penelle, D. A. Ivanov and A. M. Jonas, Nat. Mater., 2004, 3, 33–37 CrossRef PubMed.
- F. Stempfle, D. Quinzler, I. Heckler and S. Mecking, Macromolecules, 2011, 44, 4159–4166 CrossRef CAS.
- C. Vilela, A. J. D. Silvestre and M. A. R. Meier, Macromol. Chem. Phys., 2012, 213, 2220–2227 CrossRef CAS.
- S. Huf, S. Krügener, T. Hirth, S. Rupp and S. Zibek, Eur. J. Lipid Sci. Technol., 2011, 113, 548–561 CrossRef CAS.
- A. Pascual, H. Sardon, A. Veloso, F. Ruipérez and D. Mecerreyes, ACS Macro Lett., 2014, 3, 849–853 CrossRef CAS.
- M. P. F. Pepels, M. R. Hansen, H. Goossens and R. Duchateau, Macromolecules, 2013, 46, 7668–7677 CrossRef CAS.
- A. Díaz, R. Katsarava and J. Puiggalí, Int. J. Mol. Sci., 2014, 15, 7064–7123 CrossRef PubMed.
- Z. S. Petrović, J. Milić, Y. Xu and I. Cvetković, Macromolecules, 2010, 43, 4120–4125 CrossRef.
- P. E. Kolattukudy, Science, 1980, 208, 990–1000 CAS.
- K. Osowska-Pacewicka and H. Alper, J. Org. Chem., 1988, 53, 808–810 CrossRef CAS.
- C.-M. Che, W.-P. Yip and W.-Y. Yu, Chem.–Asian J., 2006, 1, 453–458 CrossRef CAS PubMed.
- P. P. Thottumkara and T. K. Vinod, Org. Lett., 2010, 12, 5640–5643 CrossRef CAS PubMed.
- H. Lee, Y. E. C. Sugiharto, S. Lee, G. Park, C. Han, H. Jang, W. Jeon, H. Park, J. Ahn, K. Kang and H. Lee, Appl. Microbiol. Biotechnol., 2017, 1–10 Search PubMed.
- W. Cao, H. Li, J. Luo, J. Yin and Y. Wan, J. Ind. Microbiol. Biotechnol., 2017, 44, 1191–1202 CrossRef CAS PubMed.
- X. Kong, H. Qi and J. M. Curtis, J. Appl. Polym. Sci., 2014, 131, 4–10 Search PubMed.
- D. G. Barrett, W. Luo and M. N. Yousaf, Polym. Chem., 2010, 1, 296 RSC.
- F. Migneco, Y. C. Huang, R. K. Birla and S. J. Hollister, Biomaterials, 2009, 30, 6479–6484 CrossRef CAS PubMed.
- C. Berti, A. Celli, P. Marchese, G. Barbiroli, F. Di Credico, V. Verney and S. Commereuc, Eur. Polym. J., 2008, 44, 3650–3661 CrossRef CAS.
- C. Berti, A. Celli, P. Marchese, E. Marianucci, G. Barbiroli and F. Di Credico, e-Polym., 2007, 7, 1–18 Search PubMed.
- A. Celli, G. Barbiroli, C. Berti, D. C. Francesco, C. Lorenzetti, P. Marchese and E. Marianucci, J. Polym. Sci. Part B Polym. Phys., 2007, 45, 1053–1067 CrossRef CAS.
- A. Takasu, A. Takemoto and T. Hirabayashi, Biomacromolecules, 2006, 7, 6–9 CrossRef CAS PubMed.
- H. W. Starkweather Jr, P. Avakian, K. H. Gardner, B. S. Hsiao, M. Y. Keating and H. Ng, J. Therm. Anal. Calorim., 2000, 59, 519–530 CrossRef.
- X. Cui and D. Yan, Eur. Polym. J., 2005, 41, 863–870 CrossRef CAS.
- E. M. Woo, J. W. Barlow and D. R. Paul, Polymer, 1985, 26, 763–773 CrossRef CAS.
- U. Witt, R.-J. Müller, J. Augusta, H. Widdecke and W.-D. Deckwer, Macromol. Chem. Phys., 1994, 195, 793–802 CrossRef CAS.
- A. Almontassir, S. Gestí, L. Franco and J. Puiggalí, Macromolecules, 2004, 37, 5300–5309 CrossRef CAS.
- G. Barbiroli, C. Lorenzetti, C. Berti, M. Fiorini and P. Manaresi, Eur. Polym. J., 2003, 39, 655–661 CrossRef CAS.
- C. Berti, A. Celli, P. Marchese, G. Barbiroli, F. Di Credico, V. Verney and S. Commereuc, Eur. Polym. J., 2009, 45, 2402–2412 CrossRef CAS.
- K. G. Joback and R. C. Reid, Chem. Eng. Commun., 1987, 57, 233–243 CrossRef CAS.
- F. Liu, J. Qiu, J. Wang, J. Zhang, H. Na and J. Zhu, RSC Adv., 2016, 6, 65889–65897 RSC.
- B. Wu, Y. Xu, Z. Bu, L. Wu, B.-G. Li and P. Dubois, Polymer, 2014, 55, 3648–3655 CrossRef CAS.
- T. Debuissy, E. Pollet and L. Avérous, J. Polym. Sci., Part A: Polym. Chem., 2017, 2738–2748 CrossRef CAS.
- C. Berti, A. Celli, P. Marchese, E. Marianucci, S. Sullalti and G. Barbiroli, Macromol. Chem. Phys., 2010, 211, 1559–1571 CrossRef CAS.
- M. Yokouchi, Y. Sakakibara, Y. Chatani, H. Tadokoro and T. Tanaka, Macromolecules, 1975, 9, 266–273 CrossRef.
- F. Liu, J. Zhang, J. Wang, X. Liu, R. Zhang, G. Hu, H. Na and J. Zhu, J. Mater. Chem. A, 2015, 3, 13637–13641 CAS.
- J. Lu, L. Wu and B. G. Li, ACS Sustainable Chem. Eng., 2017, 5, 6159–6166 CrossRef CAS.
- X. Dai and Z. Qiu, Polym. Degrad. Stab., 2016, 134, 305–310 CrossRef CAS.
- A. Celli, P. Marchese, S. Sullalti, J. Cai and R. A. Gross, Polymer, 2013, 54, 3774–3783 CrossRef CAS.
- G. Stoclet, G. Gobius du Sart, B. Yeniad, S. de Vos and J. M. Lefebvre, Polymer, 2015, 72, 165–176 CrossRef CAS.
| This journal is © The Royal Society of Chemistry 2017 |

