
 Open Access Article
 This Open Access Article is licensed under a
 Creative Commons Attribution 3.0 Unported Licence
Effect of MWCNT-modified graphite felts on hexavalent chromium removal in biocathode microbial fuel cells†
Xiayuan Wu ab,
Xiaomin Xionga,
Gianluca Brunettib,
Xiaoyu Yonga,
Jun Zhoua,
Lijuan Zhanga,
Ping Weia and
Honghua Jia*a
ab,
Xiaomin Xionga,
Gianluca Brunettib,
Xiaoyu Yonga,
Jun Zhoua,
Lijuan Zhanga,
Ping Weia and
Honghua Jia*a
aBioenergy Research Institute, College of Biotechnology and Pharmaceutical Engineering, Nanjing Tech University, No. 30 Puzhu Road(S), Nanjing 211816, Jiangsu, China. E-mail: hhjia@njtech.edu.cn; Fax: +86 25 58139929; Tel: +86 25 58139929
bFuture Industries Institute, School of Natural and Built Environments, University of South Australia, Adelaide, South Australia 5095, Australia
First published on 24th November 2017
Abstract
Multi-walled carbon nanotubes (MWCNTs) and oxidative acid pretreated MWCNTs (oxidized MWCNTs, O-MWCNTs) were used to modify graphite felts as biocathode electrodes in Cr(VI)-reducing microbial fuel cells (MFCs). The results showed that both MWCNT modifications improved the efficiency of the Cr(VI)-reducing biocathode. In particular, the O-MWCNT modification led to a better performance due to the induced oxygen-containing functional groups on the O-MWCNTs. The O-MWCNT-modified graphite felt significantly promoted the Cr(VI) removal and electricity generation of the MFC. The Cr(VI) removal rate increased to 2.00 ± 0.10 mg L−1 h−1, which was 2.05 times higher than that of the unmodified control. The improvement was ascribed to the strong affinity and capacity of the O-MWCNTs towards microorganisms and Cr(VI) ions. In addition, this study further confirmed that the ex situ biocathode acclimatization method could be an efficient way to screen potential biocathode materials for Cr(VI)-reducing MFCs.
1. Introduction
Hexavalent chromium (Cr(VI)) is a known priority toxic chemical and carcinogen, which has gained attention due to its serious threat to humans.1,2 Recently, microbial fuel cells (MFCs), a sustainable and effective technology for the reduction of oxidative heavy metals,3–5 have been proposed to provide promising results for Cr(VI) removal. The abiotic cathode MFCs for Cr(VI) removal obtained the maximum removal rate as high as 8.12 mg L−1 h−1, but this high removal in the abiotic cathode MFC strongly relies on a low pH.3,6–8 Therefore, the biocathode MFCs show a great potential in Cr(VI) bioremediation, which can use the catalysis of self-regenerating electrochemically active bacteria to provide a sustainable and economic operation under a neutral environment.9–11 However, the low efficiency of Cr(VI) removal and electricity generation in biocathode MFCs becomes the main bottleneck to limit their practical and large-scale applications.12–14 Since electrode material is a significant factor to affect the performance of biocathodes by acting as a bacterial carrier and electron exchange site,15,16 suitable biocathode materials are worth developing to improve the performance of Cr(VI)-reducing MFCs. So far, most of biocathode electrodes applied in Cr(VI)-reducing MFCs were conventional carbon-based materials, such as graphite plates, graphite granules, graphite felts and graphite fibers.1,10,12,17 Recently, the nanostructured materials modification on conventional carbon-based materials has been demonstrated its high efficiency to improve the MFC performance.18–20 However, little effort has been spent on seeking for surface modifiers for carbon-based materials to enhance the biocathode performance in Cr(VI)-reducing MFCs.11,15Our previous work found that the NaX zeolite-modified graphite felt improved the biocathode performance in Cr(VI)-reducing MFCs due to the affinity of the NaX zeolite towards microorganisms and Cr(VI) ions; however, the high resistance of NaX zeolite would affect the conductivity of the modified electrode.15 Multi-walled carbon nanotubes (MWCNTs), another kind of popular nanostructured material, possess unique physical and chemical properties (e.g. high porosity, high electrical conductivity, high surface area, good electrochemical stability and biocompatibility), which have been applied as the surface modifier for carbon-based materials to improve the electricity generation of MFCs.21–24 Considering the MWCNTs have a strong adsorption capacity for heavy metals like NaX zeolite,25,26 the MWCNTs-modified electrode also might be a promising biocathode material for Cr(VI)-reducing MFCs. To the best of our knowledge, the MWCNTs-modified electrode has not been applied as biocathode material in Cr(VI)-reducing MFCs.
For preventing the self-aggregation of MWCNTs, an oxidative acid pretreatment is often used for improving the dispersion of MWCNTs and nanotube purification.27 As a result of oxidizing acid attack, oxygen-containing groups can be attached to the ends and surfaces of MWCNTs to improve the dispersion of MWCNTs in the aqueous solution.28–30 Furthermore, the oxidized MWCNTs-modified electrode, compared to the original MWCNTs-modified one, caused a higher efficiency of power generation and wastewater treatment in MFCs.31
The aim of this study was to investigate the effect of two kinds of MWCNTs (original and oxidized MWCNTs)-modified graphite felts as biocathode electrodes in Cr(VI)-reducing MFCs. An ex situ acclimatization method was used to obtain the Cr(VI)-reducing biocathode:32 namely, the Cr(VI)-reducing biocathode was acclimatized in the anode chamber first to enrich the electrochemically active biofilm, and then directly transferred to the cathode chamber for Cr(VI) removal. The performance of different electrodes was studied during both ex situ acclimatization and Cr(VI) removal periods in terms of the efficiency of electricity generation and Cr(VI) removal. The effect of the MWCNTs-modified electrodes on Cr(VI) removal was deeply elucidated by conducting the extensive analyses of electrode characteristics, surface morphology, and biocatalytic activity of the bio-electrodes.
2. Materials and methods
2.1. Electrode preparation
The bare electrode was a piece of graphite felt (5.0 × 5.0 × 0.5 cm; Hunan Jiuhua Carbon Hi-Tech Co., Ltd., China), which was soaked in 33% nitric acid overnight to remove impurities and then dried at 100 °C. This bare graphite felt was dubbed the “control electrode”.To prepare the original MWCNTs-modified electrode, the original MWCNTs (outer diameter 20–40 nm, bundle length > 5 μm, purity > 95%, Shenzhen Nanotech Port Co., Ltd) were mixed with the sodium dodecyl benzene sulfonate (SDBS) and deionized water. The final mass fraction of MWCNTs and SDBS was achieved to 0.18% and 1%, respectively. This mixture was dispersed by sonication and agitation for 1 h. Afterwards, a bare graphite felt was placed into the MWCNTs/SDBS mixture for 20 min to facilitate physical adsorption and then dried in a vacuum at 100 °C for 24 h. This step was repeated thrice to maximize the adsorption of MWCNTs on the graphite felt. Subsequently, the MWCNTs-modified graphite felt was washed thrice with deionized water to remove the unadsorbed MWCNTs and dried again. This modified electrode was labelled as the “MWCNTs electrode”.
The original MWCNTs were pretreated with the mixture of nitric acid and sulfuric acid (3![[thin space (1/6-em)]](https://www.rsc.org/images/entities/char_2009.gif) :1 v/v) as described by Qu et al.29 to obtain the oxidized MWCNTs (O-MWCNTs). Then, the modification of the O-MWCNTs on a bare graphite felt was conducted by following the same steps mentioned above. This modified electrode was labelled as the “O-MWCNTs electrode”. Besides, the final adsorption masses of the original and oxidized MWCNTs on the corresponding modified electrodes in this study were controlled to be similar (0.21–0.22 g) in order to compare the effect of these two modifiers.
:1 v/v) as described by Qu et al.29 to obtain the oxidized MWCNTs (O-MWCNTs). Then, the modification of the O-MWCNTs on a bare graphite felt was conducted by following the same steps mentioned above. This modified electrode was labelled as the “O-MWCNTs electrode”. Besides, the final adsorption masses of the original and oxidized MWCNTs on the corresponding modified electrodes in this study were controlled to be similar (0.21–0.22 g) in order to compare the effect of these two modifiers.
2.2. MFC construction and operation
The dual-chamber MFC used was the same as described in our previous study.15 Two cubic plexiglass chambers (net volume of 70 mL each) were separated by a proton exchange membrane (38.5 cm2; Nafion 117, Dopont Co., USA). A sheet of graphite felt (5.0 × 5.0 × 0.5 cm) was used as the anode electrode, and also as the cathode electrode unless specified. The anodic inoculation was from anaerobic digester sludge. During the Cr(VI) removal experiment, an acclimatized mature bioanode with stable potential was used in the MFC, and the bioanode acclimatization method was described in Section 2.3. The anode chamber was filled with glucose culture medium during both ex situ acclimatization and Cr(VI) removal experiments.15 The MFC was operated with an external resistance of 1000 Ω in a batch-fed mode at 25 ± 0.5 °C. All experimental reactors were performed in triplicate to ensure reproducibility.2.3. Ex situ biocathode acclimatization method
According to the ex situ biocathode acclimatization method described previously,15 the testing electrodes were acclimatized as anodes in MFCs. During the ex situ acclimatization period, the cathode chamber was filled with 40 mM ferricyanide and 50 mM phosphate buffer solution,15 while the other conditions were the same as those mentioned in Section 2.2. The anolyte and catholyte were refreshed every 4–5 days. When the MFCs achieved their steady-state for voltage generation, these bioanodes were anaerobically transferred to the cathode chambers to function as the biocathodes for Cr(VI) removal.2.4. Cr(VI) removal experiment
The medium (11.53 g L−1 Na2HPO4·12H2O, 2.772 g L−1 NaH2PO4·2H2O, 0.28 g L−1 NH4Cl, 0.78 g L−1 KCl, 0.2 g L−1 NaHCO3; pH 7.0) containing 20 mg L−1 Cr(VI) (prepared by dissolving K2Cr2O7 in deionized water) was added to the cathode chamber of MFCs for testing the biocathodes obtained by the ex situ acclimatization method. In order to study the Cr(VI) removal mechanisms, the MFCs with different biocathodes were operated 24 h under both open-circuit and closed-circuit conditions. Meanwhile, the three testing electrodes before and after acclimatization (without and with biomass) were also conducted a 24 h-Cr(VI) adsorption experiment in the same cathode medium.2.5. Analytical techniques and calculations
The voltage generated by the MFCs was automatically collected every 10 min by a data acquisition system (Keithley Instruments 2700, USA). The power density as a function of the current density was obtained from the polarization curve, which was conducted at the time point of the maximum voltage generation in the MFC; the current and power densities were calculated based on the total surface area of the bare electrode substrate; the current (I) was calculated using Ohm's law: U = IR, where U is the voltage and R is the external resistance; the power (P) was calculated according to P = IU, while the internal resistance of the MFC was calculated using the polarization slope method.15Cyclic voltammetry (CV) was performed using a potentiostat (CHI660D, Shanghai Chenhua Instruments Co., Ltd.) at a scan rate of 5 mV s−1 over a range between −600 mV and +600 mV in a three-electrode system (Ag/AgCl as the reference electrode, the anode as the working electrode and the cathode as the counter electrode). Electrochemical impedance spectroscopy (EIS) measurement was performed to determine the different internal resistances of the MFC, namely: ohmic resistance (Rs), charge-transfer resistance (Rct) and diffusion resistance (W). The EIS measurement was conducted in a three-electrode system (same as CV) at the potential amplitude of 10 mV with frequency range between 100 kHz and 5 mHz.
The morphology of the electrode surface was investigated by scanning electron microscopy with coupled energy dispersive spectroscopy (SEM-EDS, Hitachi S-4800, Japan). The bacteria attached to the electrode were stabilized based on previously described procedures.33 The Fourier transform infrared (FT-IR) spectra were obtained with a FT-IR spectrometer (NICOLET, NEXUS 670).15 The specific surface area (SSA) of the electrode was determined from a N2 adsorption–desorption experiment with an ASAP2020 surface area analyzer (Micromeritics, USA). Contact-angle measurement was performed on the electrode with a contact angle meter (SL200B, Shanghai Solon Information Technology Co., Ltd.). The surface resistance of the electrode was determined with a digital multimeter (UT61B, Shanghai Uni-Trend Co., Ltd.).15
At the end of ex situ acclimatization, the biomass on the anode electrode was removed into 5 mL of deionized water by ultrasonic treatment (100 W, 30 min), and the supernatant was separated from the solution by centrifugation at 2000 rpm for 2 min. Afterwards, 0.5 mL of the supernatant was mixed with 0.5 mL of NaOH solution (0.1 mol L−1). The mixture was boiled for 20 min until the solution was clear. Finally, the biomass protein was determined by modified Lowry method.34
A colorimetric 1,5-diphenylcarbazide method was used for Cr(VI) analysis, and total chromium was analyzed by reoxidizing any reduced form of chromium by potassium permanganate after acid digestion with concentrated HNO3 and H2SO4.35 Samples for Cr(VI) and total chromium analyses were filtered through 0.45 μm membrane syringe filters.
3. Results and discussion
3.1. Electrode characterization
The surface morphology of the three electrodes was analyzed by SEM before acclimatization. As shown in Fig. 1a–c, the control electrode showed a smooth and clean surface (Fig. 1a), while the other two modified electrodes exhibited rougher surfaces caused by some affixed substances, which have the typical appearance of carbon nanotubes.31 In particular, the tubular graphite fibers of the O-MWCNTs electrode (Fig. 1c) were completely enwrapped by a layer of the evenly distributed attachments, whereas the MWCNTs electrode (Fig. 1b) displayed an irregular attachments distribution and even some chunks of agglomerate on the surface. This difference might be attributed to the oxidative acid pretreatment, which could be able to form large amount of oxygen-containing groups on the surface of MWCNTs29 and also create porous out layer with much abundant nanoscale defects.30 The MWCNTs with oxygen-containing groups and nanoscale defects achieved better dispersibility and stability29,30 in aqueous solution, which might result in a even distribution of O-MWCNTs on the graphite felt surface.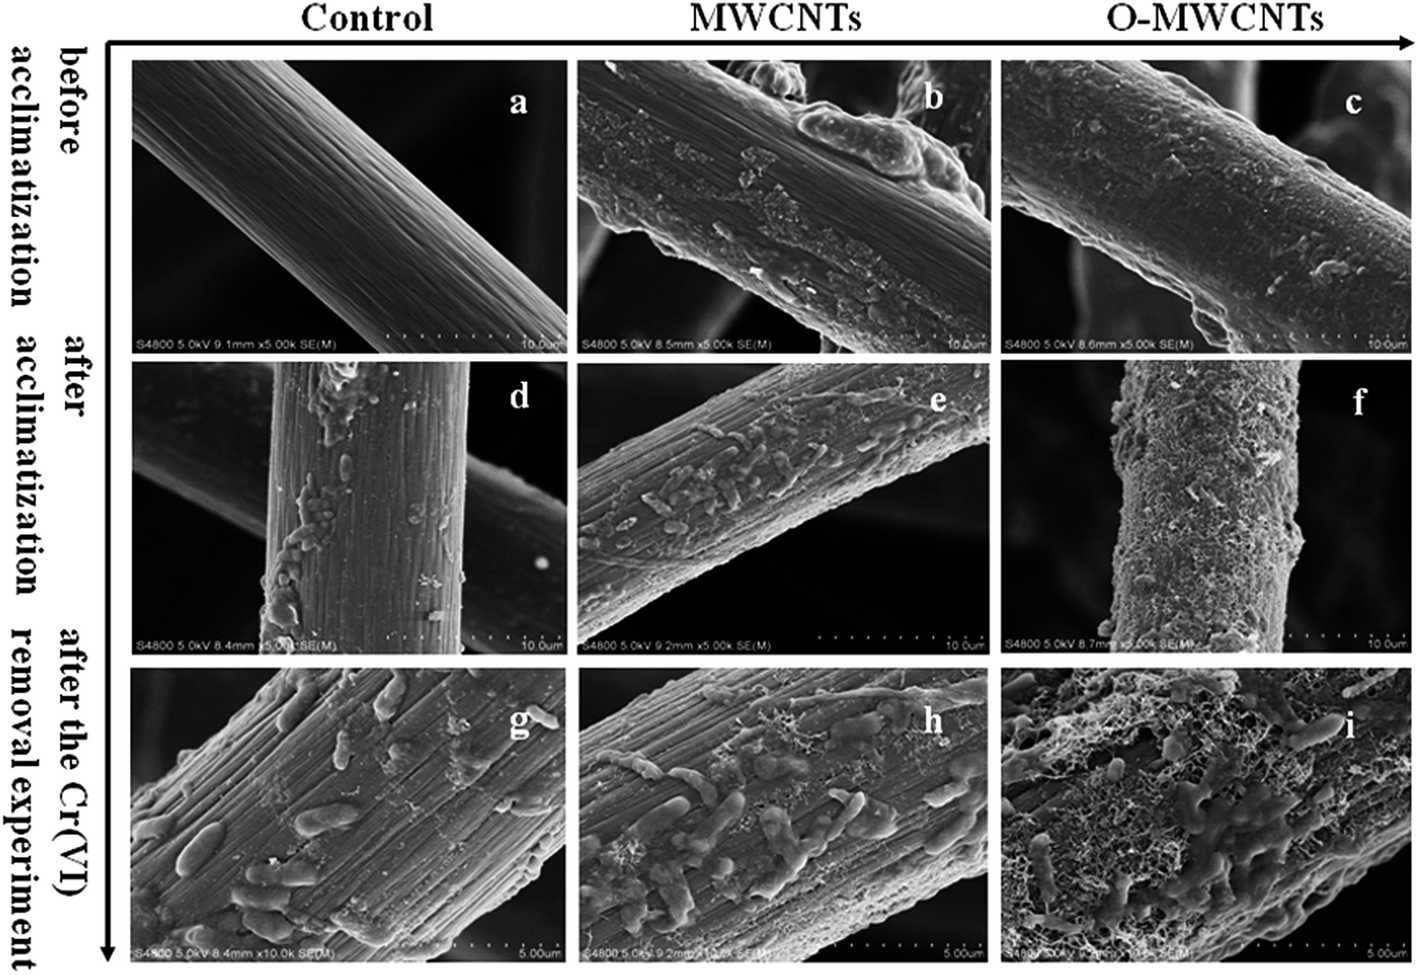 | ||
| Fig. 1 Scanning electron microscopy images of different electrodes (the control electrode, the MWCNTs electrode, and the O-MWCNTs electrode) before acclimatization (a–c), after acclimatization (d–f), and after the Cr(VI) removal experiment (g–i). | ||
FT-IR was further employed to investigate the functional groups induced by the oxidative acid pretreatment of MWCNTs. Fig. 2 shows the FT-IR spectra of MWCNTs and O-MWCNTs powders. The peak at about 3410 cm−1 corresponding to the stretching vibrations of –OH within –COOH increased considerably after acid treatment in O-MWCNTs, indicating the quantity of carboxyl groups on the O-MWCNTs surface increased remarkably. The peaks at about 1400 cm−1 and 1710 cm−1 corresponding to the stretching vibration of C![[double bond, length as m-dash]](https://www.rsc.org/images/entities/char_e001.gif) O from carboxyl groups also significantly increased, confirming that carboxyl containing functional groups were greatly generated on the O-MWCNTs. Besides, the broad peak at 1220–1080 cm−1 representing the stretching vibration of C–O from carboxyl groups increased as well.29,30 These intensified peaks and newly generated peaks indicated that the acid pretreatment offered more carboxyl containing functional groups on the O-MWCNTs surface, which could effectively improve the dispersibility of O-MWCNTs in aqueous systems. This was also verified in other studies.28–30,36
O from carboxyl groups also significantly increased, confirming that carboxyl containing functional groups were greatly generated on the O-MWCNTs. Besides, the broad peak at 1220–1080 cm−1 representing the stretching vibration of C–O from carboxyl groups increased as well.29,30 These intensified peaks and newly generated peaks indicated that the acid pretreatment offered more carboxyl containing functional groups on the O-MWCNTs surface, which could effectively improve the dispersibility of O-MWCNTs in aqueous systems. This was also verified in other studies.28–30,36
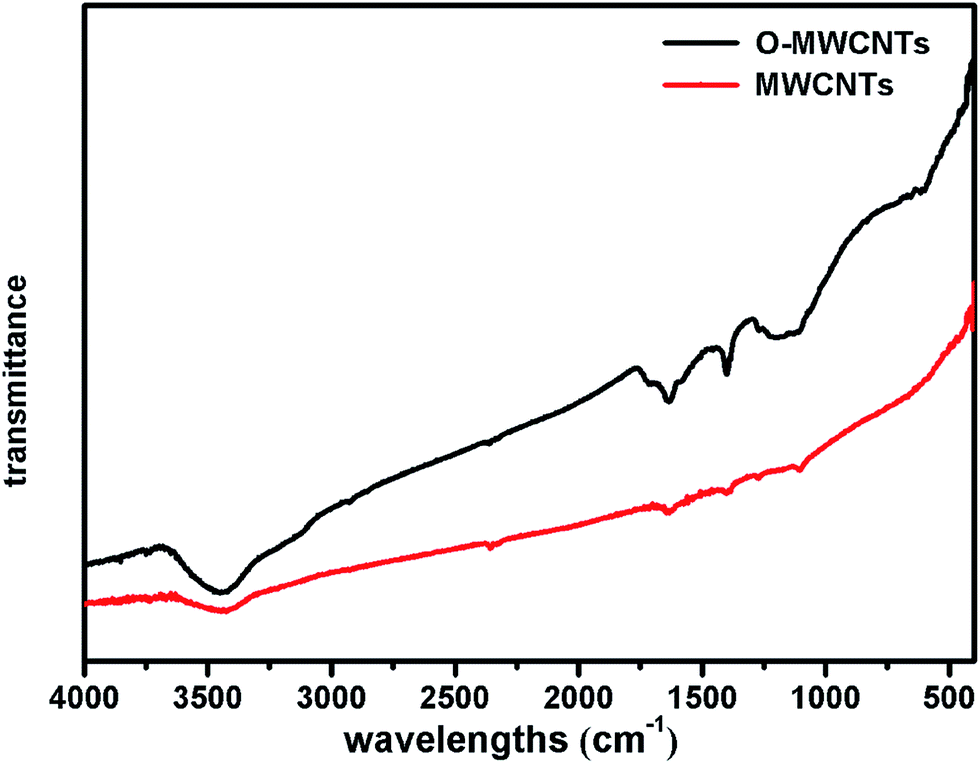 | ||
| Fig. 2 Fourier transform infrared spectra of the MWCNTs and O-MWCNTs. | ||
The surface characteristic analyses of the three electrodes were conducted in terms of SSA, contact angle, and surface resistance (Table 1). The MWCNTs modifications improved the SSA of the graphite felt dramatically, as the SSA values of the MWCNTs (29.84 ± 0.56 m2 g−1) and O-MWCNTs (66.98 ± 0.43 m2 g−1) electrode were almost 4 and 9 times higher than that of the control electrode, respectively. Large surface area can facilitate an extensive biofilm formation throughout the material and efficient transport of nutrients and wastes at the same time.37 In addition, the MWCNTs modifications enhanced the wettability of the graphite felt noticeably, as the MWCNTs and O-MWCNTs electrode both became a superhydrophilic material (contact angle: 0°) from the original hydrophobic graphite felt (contact angle: 115.81 ± 1.26°). High hydrophilicity of materials can accelerate the bacterial adhesion and electrochemical reactions.38 Furthermore, the MWCNTs modifications decreased the surface resistance of the graphite felt, and the O-MWCNTs electrode possessed the lowest surface resistance among the three electrodes.
| Electrode | BET SSA (m2 g−1) | Contact angle (°) | Resistance (Ω) | Biomass protein (μg) |
|---|---|---|---|---|
| Control | 7.49 ± 0.13 | 115.81 ± 1.26 | 4.31 ± 0.37 | 7926.3 ± 126.4 |
| MWCNTs | 29.84 ± 0.56 | 0 | 3.89 ± 1.67 | 8633.4 ± 209.1 |
| O-MWCNTs | 66.98 ± 0.43 | 0 | 3.25 ± 1.31 | 9182.2 ± 178.3 |
3.2. Electrode performance during ex situ acclimatization
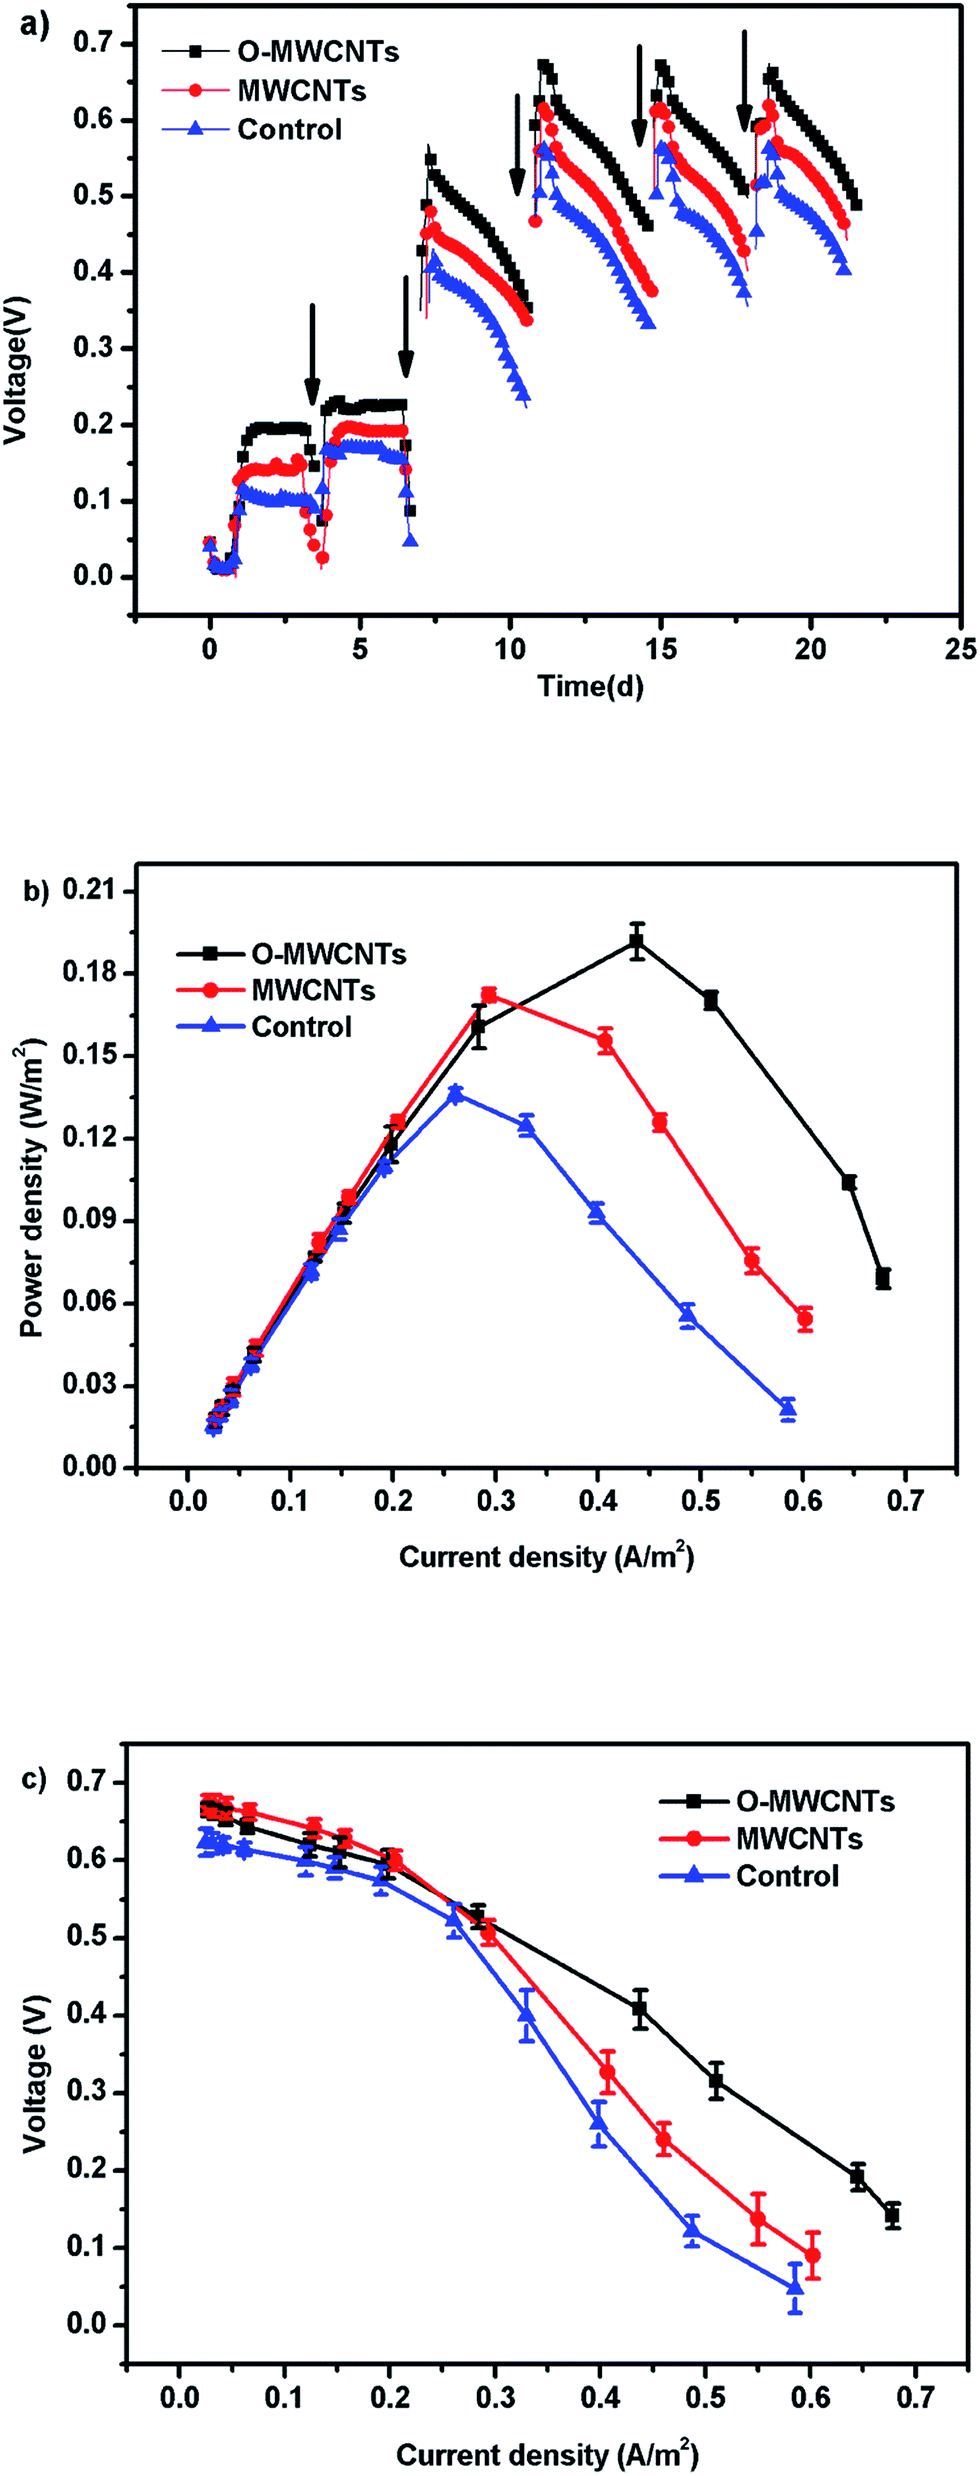 | ||
| Fig. 3 Voltage outputs ((a) each arrow represents the beginning of a batch cycle), power densities (b), and polarization curves (points from the fifth to ninth for internal resistance estimation) (c) of microbial fuel cells with different electrodes during ex situ acclimatization. | ||
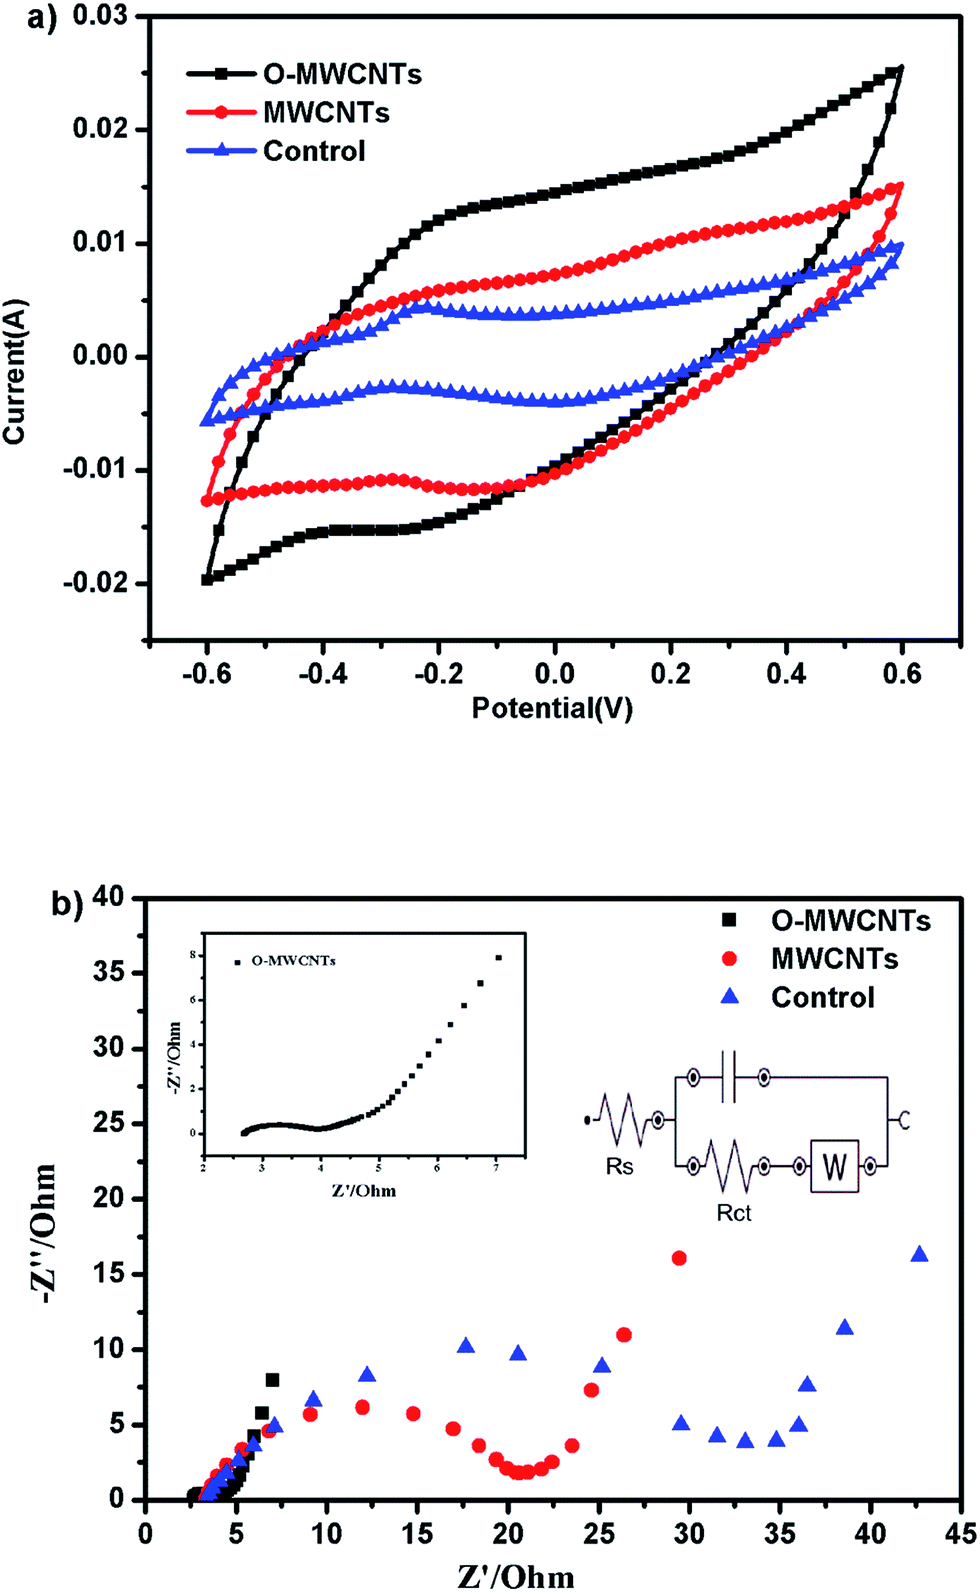 | ||
| Fig. 4 Cyclic voltammograms (a) and electrochemical impedance spectroscopy (b) of the three electrodes at the end of the ex situ acclimatization. | ||
EIS was also performed to investigate the microbial electrocatalytic activity and its interaction with electrodes (Fig. 4b). The impedance spectra is composed of semicircle at the high frequencies (show the charge transfer) and straight line at low frequencies (show Warburg diffusion limitations).40 Compared with the control and MWCNTs bioanode, the semicircle of the O-MWCNTs bioanode notably was the smallest. Since the diameter of the semicircle is normally fitted to the interfacial electron transfer resistance (Rct),41 the O-MWCNTs bioanode was estimated to receive the lowest Rct of 1.1 Ω, while the MWCNTs and control bioanode obtained the Rct of 16.7 Ω and 32.6 Ω, respectively. This suggested superior charge transfer between the O-MWCNTs electrode and the biofilm, which also indicated that the organic matters could easily reach the O-MWCNTs bioanode surface and then react with bacteria fast.42 The impedance decrease of the O-MWCNTs bioanode might be not only due to the improvement of the material characteristics (Table 1), but also due to the large amount of bacteria on the electrode, since the enrichment of electroactive bacteria on anode could reduce the anodic overpotential in MFCs.43,44
Therefore, SEM and biomass protein determination were conducted to confirm the quantity of bacteria on each electrode after the ex situ acclimatization. As seen from Fig. 1d–f, the biofilm on the O-MWCNTs electrode was continuous, even and thick, while the biofilm on the control electrode was sparse, uneven and thin. The total amounts of biomass protein on the three bio-electrodes are summarized in Table 1. The highest amount of biomass protein was obtained from the O-MWCNTs bio-electrode (9182.2 ± 178.3 μg), followed by the MWCNTs (8633.4 ± 209.1 μg) and control (7926.3 ± 126.4 μg) bio-electrode. This finding is consistent with the SEM result, which confirmed that the thick biofilm on the O-MWCNTs electrode enhanced the electrocatalytic activity and reduced the impedance. The largest amount of bacteria on the O-MWCNTs electrode might be attributed to the increased SSA and oxygen-containing functional groups, which facilitated the attachment of bacteria and the penetration of organic substrates to the biofilm on the electrode,30 and consequently improved the bond between the O-MWCNTs and the microbes via π–π interactions.41
3.3. Biocathode performance in Cr(VI)-reducing MFC
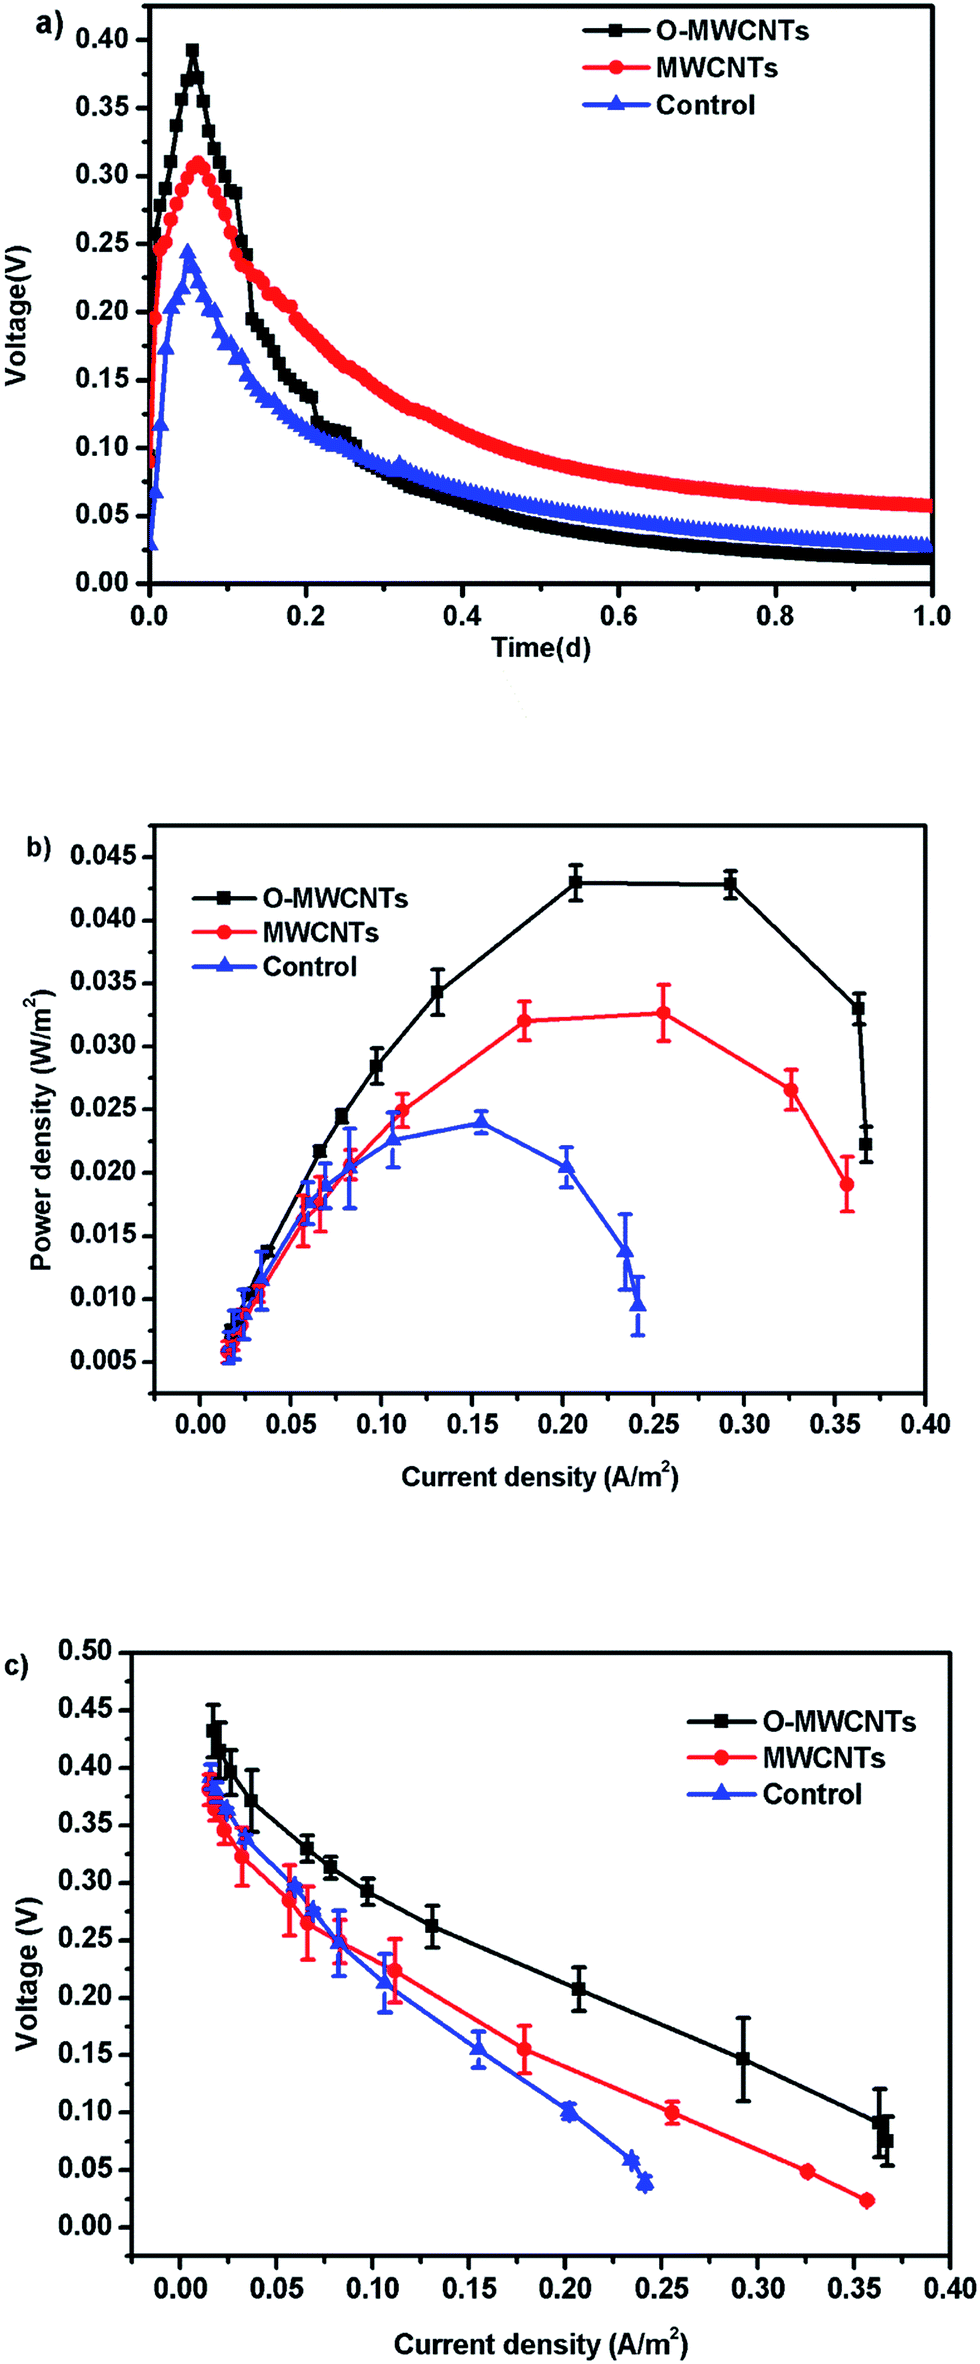 | ||
| Fig. 5 Voltage outputs (a), power densities (b), and polarization curves (points from the fourth to ninth for internal resistance estimation) (c) of Cr(VI)-reducing microbial fuel cells with different cathodes at the initial Cr(VI) concentration of 20 mg L−1 (pH = 7). | ||
Besides, all MFCs produced significant voltages only before 0.4 d (10 h) operation time, and then the voltages continuously decreased until the end of the experiment (Fig. 5a), which is the typical voltage generation pattern in Cr(VI)-reducing MFCs.1,15,17 The MFC with the O-MWCNTs biocathode still produced a background current even though the Cr(VI) was not detected in the liquid after 0.4 d (10 h) operation time (Fig. 6), which was probably due to the Cr(VI) physically adsorbed by the biocathode as the residual electron acceptor. In addition, the small amount of oxygen leaking in through the thief hole every sampling time also might act as another electron acceptor in the cathodes to produce a part of current, especially when Cr(VI) was depleted. The calculation for the electron balances at the end of 10 h operation time (Fig. S1†) proved the existence of other electron acceptors apart from the soluble Cr(VI) in the liquid, as the total coulombs transferred (Ct) were more than the coulombs required (Cr) for the reduction of soluble Cr(VI) in all MFCs.
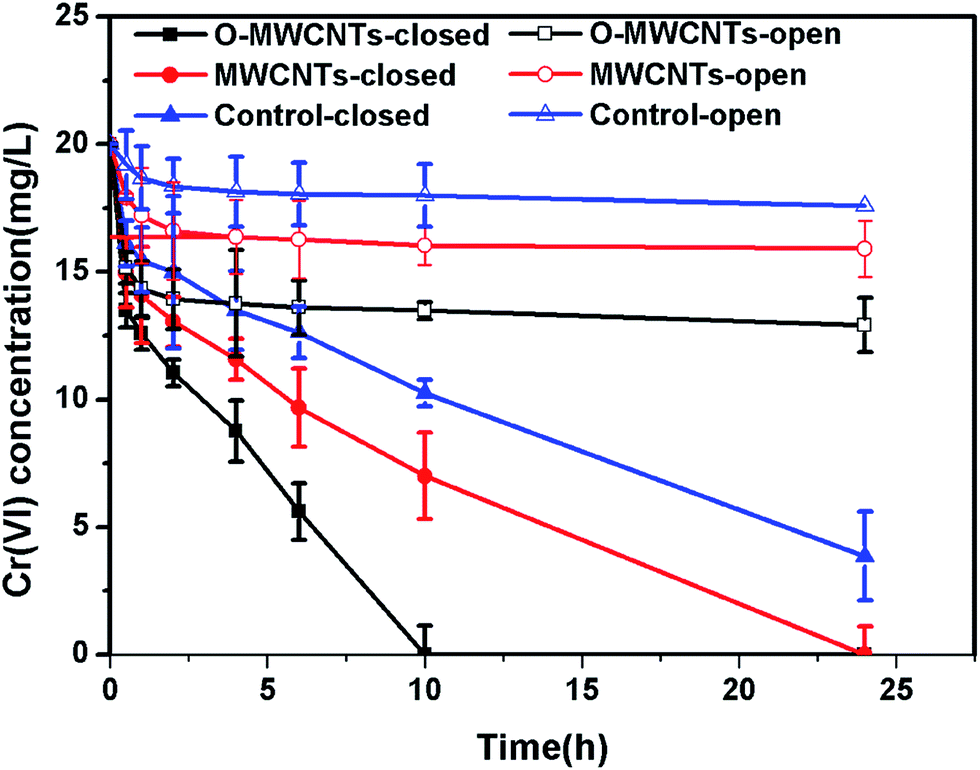 | ||
| Fig. 6 Time course of dissolved Cr(VI) concentration in microbial fuel cells with different cathodes under open and closed circuit conditions. | ||
When the circuit was connected, the Cr(VI) removal rates in all MFCs were much higher than those observed under open circuit condition, indicating that the bioelectrochemical process in the cathode chamber accelerated the removal of Cr(VI). In other words, the Cr(VI) removal in the MFC was mainly a bioelectrochemical reduction rather than a simple adsorption. The highest Cr(VI) removal rate of 2.00 ± 0.10 mg L−1 h−1 was obtained in the MFC with the O-MWCNTs biocathode (Cr(VI) was completely removed in 10 h), which was 1.54 and 2.05 times higher than those in the MFCs with the MWCNTs (1.30 ± 0.06 mg L−1 h−1) and control (0.97 ± 0.02 mg L−1 h−1) biocathode, respectively. Among the reported studies which used a dual-chamber MFC reactor and mixed culture biocathode (as listed in Table 2), the maximum Cr(VI) removal rate in this study is 1.41 times higher than that from a self-assembling graphene modified graphite felt,11 but lower than that from a HNO3–NaX modified graphite felt in our previous work.15 This might be due to the stronger Cr(VI) adsorption capacity of the HNO3–NaX zeolite on graphite felt.49
| Biocathode | Cathode material | The maximum Cr(VI) removal rate (mg L−1 h−1) | Reference |
|---|---|---|---|
| Mixed culture | Graphite plate | 0.50 | 1 |
| Mixed culture | Graphite granules | 0.82 | 48 |
| Mixed culture | Graphene/biofilm | 0.83 | 11 |
| Mixed culture | O-MWCNTs modified graphite felt | 2.00 | This study |
| Mixed culture | HNO3–NaX modified graphite felt | 10.39 | 14 |
This work further confirmed that the electricity generation performance of an electrode as anode during ex situ acclimatization period could be used to estimate the Cr(VI) removal performance of it as biocathode due to the similar dominant bacteria catalyzing these electrochemical reactions.32 Therefore, the ex situ biocathode acclimatization method could be an efficient way to screen potential biocathode materials for Cr(VI)-reducing MFCs only based on the level of electricity generation at the preliminary acclimatization stage.1,15,32
In summary, the improvement mechanisms of the O-MWCNTs electrode for Cr(VI) removal in the MFC include: (1) the O-MWCNTs and biomass on the electrode adsorbed a part of the Cr(VI) ions; (2) the easy accessibility of oxidized Cr(VI) ions onto the electrode decreased the mass transport resistance;50 (3) the large number of bacteria on the electrode accelerated the bioelectrochemical Cr(VI) reduction.
4. Conclusions
This study demonstrated that the MWCNTs-modified graphite felts as biocathode materials improved the Cr(VI) removal and electricity generation in MFCs. In particular, the O-MWCNTs (MWCNTs pretreated by the oxidative acid) further promoted the performance of the modified electrode due to the induced oxygen-containing functional groups. The highest Cr(VI) removal rate (2.00 ± 0.10 mg L−1 h−1) and power density (0.043 ± 0.001 W m−2) were obtained in the MFC with the O-MWCNTs-modified graphite felt, which were 2.05 and 1.75 times higher than those of the unmodified control, respectively. These improvements were ascribed to the strong affinity and capacity of the O-MWCNTs towards microorganisms and Cr(VI) ions. In addition, this work further confirmed that the ex situ biocathode acclimatization method could be an efficient way to screen potential biocathode materials for Cr(VI)-reducing MFCs.Conflicts of interest
The authors declare no conflicts of interest to this work.Acknowledgements
This work was financially supported by the National Basic Research Program of China (2013CB733500), the National Key Research and Development Program of China (2016YFE0112800), the National Key Technology Support Program of China (2014BAC33B00), the National Natural Science Foundation of China (21676142), and the Key Science and Technology Project of Jiangsu Province (BE2016389).References
- M. Tandukar, S. J. Huber, T. Onodera and S. G. Pavlostathis, Environ. Sci. Technol., 2009, 43, 8159–8165 CrossRef CAS PubMed.
- C. Barrera-Diaz, V. Lugo-Lugo, G. Roa-Morales, R. Natividad and S. A. Martinez-Delgadillo, J. Hazard. Mater., 2011, 185, 1362–1368 CrossRef CAS PubMed.
- O. Modin, X. Wang, X. Wu, S. Rauch and K. K. Fedje, J. Hazard. Mater., 2012, 235–236, 291–297 CrossRef CAS PubMed.
- H. C. Tao, Z. Y. Gao, H. Ding, N. Xu and W. M. Wu, Bioresour. Technol., 2012, 111, 92–97 CrossRef CAS PubMed.
- B. Zhang, C. Feng, J. Ni, J. Zhang and W. Huang, J. Power Sources, 2012, 204, 34–39 CrossRef CAS.
- Z. Li, X. Zhang and L. Lei, Process Biochem., 2008, 43, 1352–1358 CrossRef CAS.
- Y. Li, A. Lu, H. Ding, S. Jin, Y. Yan, C. Wang, C. Zen and X. Wang, Electrochem. Commun., 2009, 11, 1496–1499 CrossRef CAS.
- S. Gupta, A. Yadav and N. Verma, Chem. Eng. J., 2017, 307, 729–738 CrossRef CAS.
- J. Shen, L. Huang, P. Zhou, X. Quan and G. L. Puma, Bioelectrochemistry, 2016, 114, 1–7 CrossRef PubMed.
- L. Huang, X. Chai, S. Cheng and G. Chen, Chem. Eng. J., 2011, 166, 652–661 CrossRef CAS.
- T. S. Song, Y. Jin, J. Bao, D. Kang and J. Xie, J. Hazard Mater., 2016, 317, 73–80 CrossRef CAS PubMed.
- L. Huang, J. Chen, X. Quan and F. Yang, Bioprocess Biosyst. Eng., 2010, 8, 937–945 CrossRef PubMed.
- P. E. Molokwane, K. C. Meli and E. M. Nkhalambayausi-Chirwa, Water Res., 2008, 4538–4548 CrossRef CAS PubMed.
- L. Huang, X. Chai, G. Chen and B. E. Logan, Environ. Sci. Technol., 2011, 45, 5025–5031 CrossRef CAS PubMed.
- X. Wu, F. Tong, X. Yong, J. Zhou, L. Zhang, H. Jia and P. Wei, J. Hazard Mater., 2016, 308, 303–311 CrossRef CAS PubMed.
- L. Huang, J. M. Regan and X. Quan, Bioresour. Technol., 2011, 102, 316–323 CrossRef CAS PubMed.
- N. Xafenias, Y. Zhang and C. J. Banks, Environ. Sci. Technol., 2013, 47, 4512–4520 CrossRef CAS PubMed.
- W. Mirana, M. Nawaza, J. Janga and D. S. Lee, RSC Adv., 2016, 6, 91314–91319 RSC.
- C. Erbaya, X. Pub, W. Choib, M. J. Choia, Y. Ryuc, H. Houd, F. Line, P. d. Figueiredoefgh, C. Yubc and A. Hanai, J. Power Sources, 2015, 280, 347–354 CrossRef.
- N. Thepsuparungsikul, N. Phonthamachai and H. Y. Ng, Water Sci. Technol., 2012, 65, 1208–1214 CrossRef CAS PubMed.
- Y. Qiao, C. M. Li, S. J. Bao and Q. L. Bao, J. Power Sources, 2007, 170, 79–84 CrossRef CAS.
- H. Wei, X. S. Wu, L. Zou, G. Y. Wen, D. Y. Liu and Y. Qiao, J. Power Sources, 2016, 315, 192–198 CrossRef CAS.
- J. E. Mink, J. P. Rojas, B. E. Logan and M. M. Hussain, Nano Lett., 2012, 12, 791–795 CrossRef CAS PubMed.
- Y. J. Zou, C. L. Xiang, L. N. Yang, L. X. Sun, F. Xu and Z. Cao, Int. J. Hydrogen Energy, 2008, 33, 4856–4862 CrossRef CAS.
- M. R. Lasheen, I. Y. El-Sherif, D. Y. Sabry, S. T. El-Wakeel and M. F. El-Shahat, Desalin. Water Treat., 2015, 13, 3521–3530 CrossRef.
- T. Masciangioli and W. X. Zhang, Environ. Sci. Technol., 2003, 5, 102–108 CrossRef.
- J. Lee, D. R. Hwang, J. Hong, D. Jung and S. E. Shim, J. Dispersion Sci. Technol., 2010, 31, 1230–1235 CrossRef CAS.
- S. W. Kim, T. Kim, Y. S. Kim, H. S. Choi, H. J. Lim, S. J. Yang and C. R. Park, Carbon, 2012, 50, 23–33 Search PubMed.
- C. Qu, F. Cheng, H. Su and Y. Zhao, Russ. J. Phys. Chem. A, 2016, 90, 2230–2236 CrossRef CAS.
- N. Wang, S. Pandit, L. Ye, M. Edwards, V. R. S. S. Mokkapati, M. Murugesan, V. Kuzmenko, C. Zhao, F. Westerlund, I. Mijakovic and J. Liu, Carbon, 2017, 111, 402–410 CrossRef CAS.
- N. Thepsuparungsikul, T. C. Ng, O. Lefebvre and H. Y. Ng, Water Sci. Technol., 2014, 69, 1900–1910 CrossRef CAS PubMed.
- X. Wu, X. Zhu, T. Song, L. Zhang, H. Jia and P. Wei, Bioresour. Technol., 2015, 180, 185–191 CrossRef CAS PubMed.
- T. S. Song, W. M. Tan, X. Y. Wu and C. C. Zhou, J Chem Technol Biotechnol, 2012, 87, 1436–1440 CrossRef CAS.
- B. Frolund, T. Griebe and P. H. Nielsen, Appl. Microbiol. Biotechnol., 1995, 43, 755–761 CrossRef CAS PubMed.
- S. E. P. Administration, The Water and Wastewater Monitoring Methods, China Environmental Science Press, Beijing, 4th edn, 2002 Search PubMed.
- E. O. Fedorovskaya, L. G. Bulusheva, A. G. Kurenya, I. P. Asanov and A. V. Okotrub, Russ. J. Electrochem., 2016, 52, 441–448 CrossRef CAS.
- G. G. Kumar, V. G. Sarathi and K. S. Nahm, Biosens. Bioelectron., 2013, 43, 461–475 CrossRef CAS PubMed.
- Y. Arima and H. Iwata, Biomaterials, 2007, 20, 3074–3082 CrossRef PubMed.
- Y. Feng, Q. Yang, X. Wang and B. E. Logan, J. Power Sources, 2010, 195, 1841–1844 CrossRef CAS.
- A. P. Borole, D. Aaron, C. Y. Hamilton and C. Tsouris, Environ. Sci. Technol., 2010, 44, 2740–2745 CrossRef CAS PubMed.
- C. Erbay, G. Yang, P. de Figueiredo, R. Sadr, C. Yu and A. Han, J. Power Sources, 2015, 298, 177–183 CrossRef CAS.
- A. Mehdinia, E. Ziaei and A. Jabbari, Electrochim. Acta, 2014, 130, 512–518 CrossRef CAS.
- A. K. Manohar, O. Bretschger, K. H. Nealson and F. Mansfeld, Electrochim. Acta, 2008, 53, 3508–3513 CrossRef CAS.
- A. Dumitru, A. Morozan, M. Ghiurea, K. Scott and S. Vulpe, Phys. Status Solidi C, 2008, 6, 1484–1487 CrossRef.
- R. Hua, X. Wanga, S. Daia, D. Shaob, T. Hayatd and A. Alsaedie, Chem. Eng. J., 2015, 260, 469–477 CrossRef.
- S. Vellaichamy, Sep. Sci. Technol., 2016, 52, 644–656 CrossRef.
- E. M. Verdugo, Y. Xie, J. Baltrusaitis and D. M. Cwiertny, RSC Adv., 2016, 6, 99997–100007 RSC.
- T. Gao, J. Yu, Y. Zhou and X. Jiang, Water, Air, Soil Pollut., 2017, 228, 1–12 CrossRef.
- M. A. S. D. Barros, I. F. Araújo-Junior, C. R. G. Tavares and E. F. Sousa-Aguiar, Lat. Am. Appl. Res., 2003, 33, 339–344 CAS.
- B. E. Logan, B. Hamelers, R. Rozendal, U. Schröder, J. Keller, S. Freguia, P. Aelterman, W. Verstraete and K. Rabaey, Environ. Sci. Technol., 2006, 17, 5181–5192 CrossRef.
Footnote |
| † Electronic supplementary information (ESI) available. See DOI: 10.1039/c7ra11696a |
| This journal is © The Royal Society of Chemistry 2017 |