
 Open Access Article
 This Open Access Article is licensed under a
 Creative Commons Attribution 3.0 Unported Licence
Ultrasensitive room-temperature ethanol detection based on Au functionalized nanoporous SnO2/C60/SnO2 composites†
Shaofeng Shao *a,
Wei Wanga,
Yunyun Chena,
Yunfei Wanga and
Ralf Koehnb
*a,
Wei Wanga,
Yunyun Chena,
Yunfei Wanga and
Ralf Koehnb
aJiangsu Key Laboratory for Optoelectronic Detection of Atmosphere and Ocean, Nanjing University of Information Science &Technology, Nanjing, China. E-mail: ssfshao@nuist.edu.cn; Fax: +86-25-58731031; Tel: +86-25-58731031
bCenter for Free-Electron Laser Science, Building 99, Notkestrasse 85, Hamburg, Germany
First published on 23rd November 2017
Abstract
We have realized extremely sensitive, selective sub-ppm level ethanol gas detection through an Au functionalized nanoporous SnO2/C60/SnO2 sensing composite. This new type of hierarchically nanoporous SnO2 composite film supports both the Au@SnO2/C60 layer with closely packed open macropores (∼300 nm) and the bottom SnO2 layer with highly ordered nanopores (8–10 nm). The structure, crystallinity and composition of the hierarchical structured Au@SnO2/C60/SnO2 nanocomposite films are characterized by XRD, Raman, HRTEM, and SAED. The interaction between the Au/SnO2 and C60/SnO2 heterojunctions in light of transfer of charge carriers and modulation of potential barriers plays a crucial role in enhancing the detecting performance. The sensing properties of the Au@SnO2/C60/SnO2 nanocomposite sensor are investigated by exposing it to ethanol gas with a concentration range from 0.5 ppm to 50 ppm. Furthermore, the gas sensor exhibits ultrahigh sensitivity to ethanol gas with a response value of up to 16.8 at 0.5 ppm and a short recovery time of 9 seconds at room temperature.
1. Introduction
Ethanol as one of the most commonly and widely used chemical compounds, is applied in many fields such as the chemical industry, medicine, and the food industry. Furthermore, ethanol fuel is also a clean, efficient, and promising candidate for a renewable energy source that will overcome current challenges such as air pollution and the global energy crisis. In this growing ethanol fuel economy, safety challenges involving ethanol production, transportation, and storage require precise quantitative detection of ethanol vapour at sub-ppm level. Besides 1D nanomaterials,1 hollow spheres,2 and core–shell materials,3 ordered nanoporous SnO2 based sensors have undergone extensive development, because they usually offer acceptable sensing performance due to large active surface area and efficient gas diffusion induction. However, they suffered from an obvious drawback of high operating temperature, resulting in high power consumption and difficulty in integration.4 Therefore, the design and synthesis of effective materials and devices for high sensing performance at room temperature are of crucial important for practical applications.Recently, SnO2 decorated with nanoscale carbon materials such as carbon nanotube, graphene, and fullerene have attracted much attention for gas sensor.5–7 In particular, C60 appears to be attractive for its special electric property because it is chemically stable, metallic impurity free and relatively simple to implement and gives rise to reproducible electrical responses.8,9 Zito et al. synthesized the C–SnO2 nanocomposite forming p/n heterojunction to get enhanced sensing performance for ethanol gas. It was proposed that the formation of p/n junction was responsible for the improved sensing performance of SnO2 based sensing materials.10 Qu et al. reported porous C60/SnO2 composites exhibited high sensitivity to 5 ppm ethanol gas with operating temperature 100 °C.11 However, C60-based sensors with p/n heterojunction still had some disadvantages in modifying the diffusion and adsorption of gas molecules on the sensing materials surface, which led to the long response–recovery time. The response time to 5 ppm ethanol gas was as long as 100 second. For improving the response performance, Nguyet et al. fabricated n–p–n heterojunctions of C/SnO2 nanowires to obtain high enhancement in gas sensing performance.12 Therefore, the n/p/n heterojunction between SnO2 nanoparticles and C60 on the porous nanostructure would be able to enhance the ability of the gas molecules to diffuse and adsorb on the sensing materials, thus promoting the sensor performance.
On the other hand, several strategies demonstrated that the incorporation metal nanoparticles such as Au, Pt, Pd, and Ag to the metal oxides surface can effectively reduce the operating temperature and improve the lower limit detection, sensor response, sensitivity, and selectivity.13–16 Au nanoparticles have received the most attention from the scientific community, especially for sensor applications, because of their chemical inertness, high adsorption, and excellent catalytic activity,17–20 where the Au modified SnO2/C60/SnO2 nanocomposite film based gas sensor can be exploited to detect ethanol gas at room temperature.
In the present work, we synthesize nanoporous SnO2/C60/SnO2 sensing film decorated with Au applying the water vapour post-synthetic hydrothermal treatment, in order to form n/p/n heterojunction for improving sensing behaviour. This new type of hierarchically nanoporous SnO2 composite films supporting both the Au@SnO2/C60 layer with closely packed open macropores (∼300 nm) and the bottom SnO2 layer with highly ordered nanopores (8–10 nm). The generation of p/n heterojunctions between C60/SnO2 nanoparticles can inevitably develop the depletion regions of the junction, decreasing the conduction volume of SnO2 nanoparticles. Furthermore, the potential barrier (0.17 eV) between SnO2/C60/SnO2 heterojunction will be developed at both sides of n/p/n heterojunctions, being accompanied by the bending of the vacuum energy level and the energy band. Therefore, the SnO2/C60/SnO2 heterojunctions will provide additional modulation of resistance during the introduction and removal of ethanol gas by changing the n/p/n heterojunction barrier. The addition of Au catalyst will provide a great significant effect on the enhancement of sensing performance. By the spill over effect, the target gas molecules will be efficiently adsorbed on Au surface. They can be easily transported to the adjacent SnO2 surface.21 On the other hand, the Schottky barriers (0.55 eV) generated at Au–SnO2 heterojunctions will provide additional modulation of resistance during the adsorption and desorption of ethanol gas by changing the heterojunction barrier. For hierarchical Au@SnO2/C60/SnO2 composite film, we obtain remarkable development of ethanol sensors, and the sensor response is up to 16.8 for 0.5 ppm ethanol gas, which is a prominent result in terms of ethanol detection at room temperature.
2. Experimental section
2.1 Experimental methods
![[thin space (1/6-em)]](https://www.rsc.org/images/entities/char_2009.gif) :F127:EtOH:HCl:H2O in the final Sn precursor solution was 1:0.01:40:3:10. The thin films were prepared by spin-coating 50 μl of the Sn precursor solution onto one sensor device of ca. 10 × 10 mm2 with interdigital electrode at 4000 rpm for 30 s under 30% relative humidity for five times, and then dried at 60 °C for 2 h. The films were then exposed to a water vapour hydrothermal treatment, 80% relative humidity, at 100 °C for 96 h. The relative humidity was achieved using a supersaturated salt aqueous solution, kept at 100 °C, in a humidity controlled chamber. The films were then heat treated by annealing at temperature of 300 °C for 2 h with an up/down ramp rate of 1.0 °C min−1. In Fig. 1, the step 1 shows the ordered nanoporous SnO2 thin film on the sensor device.
:F127:EtOH:HCl:H2O in the final Sn precursor solution was 1:0.01:40:3:10. The thin films were prepared by spin-coating 50 μl of the Sn precursor solution onto one sensor device of ca. 10 × 10 mm2 with interdigital electrode at 4000 rpm for 30 s under 30% relative humidity for five times, and then dried at 60 °C for 2 h. The films were then exposed to a water vapour hydrothermal treatment, 80% relative humidity, at 100 °C for 96 h. The relative humidity was achieved using a supersaturated salt aqueous solution, kept at 100 °C, in a humidity controlled chamber. The films were then heat treated by annealing at temperature of 300 °C for 2 h with an up/down ramp rate of 1.0 °C min−1. In Fig. 1, the step 1 shows the ordered nanoporous SnO2 thin film on the sensor device.
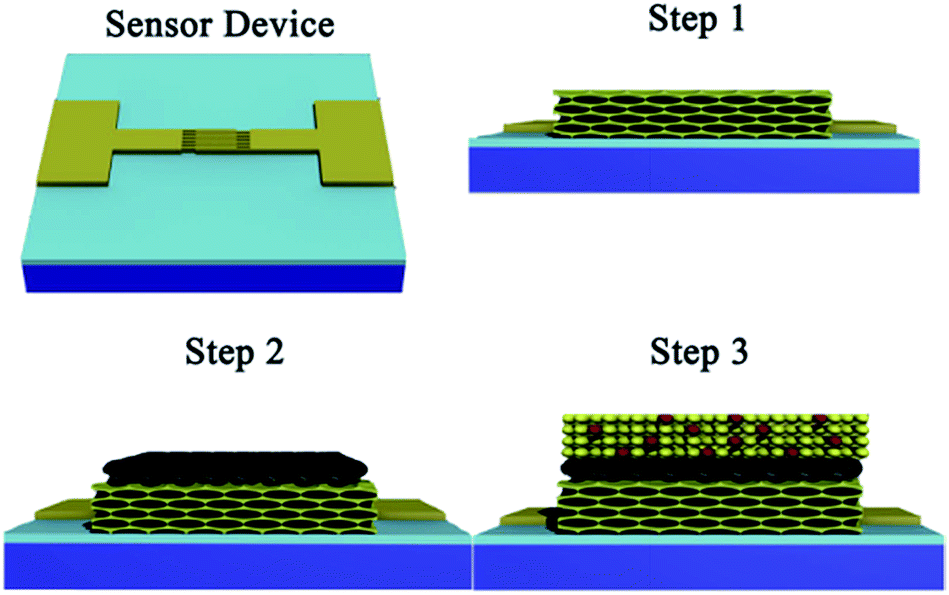 | ||
| Fig. 1 Schematic illustration of the fabrication for Au@SnO2/C60/SnO2 sensing film based on the sensor device. | ||
2.2 Materials characterization
WAXRD data were obtained by a Bruker D8 Advance X-ray diffractometer with Cu Kα (0.15406 nm) radiation. High resolution transmission electron microscopy (HRTEM) and scanning transmission electron microscopy in high angle annular dark field mode (STEM-HAADF) were performed using a FEI Titan 80-300 equipped with a field emission gun operated at 300 kV; film parts were scratched from the substrate and collected on an amorphous holey carbon film on a copper grid. Raman spectra were recorded with a LabRAM HR UV-vis (Horiba Jobin Yvon) Raman microscope (Olympus BX41) with a Symphony CCD detection system using a HeNe laser at 632.8 nm. The spectra were taken from material removed from the substrate. The Fourier transform infrared spectra (FTIR) of the samples were recorded on an AVATAR370FT-IR spectrophotometer using conventional KBr pellets.2.3 Sensing measurement
During the sensing measurement, liquid VOCs inputted through a sample inlet and led down to a heater, which vaporized it. A fan ensured that the vapour was homogeneously distributed. The gas sensing properties were determined in a sample cell consists of a sample chamber and has a gas inlet and outlet.22 A certain concentration of VOCs gas or pure air is periodically passed into the test chamber based on computer-controlled mass flow controllers (MFCs), and the total flow rate is maintained at 1000 sccm. Resistance changes upon sample exposure to gases recorded by a high resistance meter Keithley 6517B. The sensor response is defined as Ra/Rg, where Ra and Rg are the sensor resistances in air and in the target gas, respectively. This parameter is positive for n-type VOCs sensing behaviour. Here, the response or recovery time defined as the time taken for the sensor to achieve 90% of its maximum response or decreases to 10% of its maximum response, respectively.3. Results and discussion
Scanning transmission electron microscopy (STEM) image (Fig. 2a) depicts the structure and morphology of the resulting nanoporous Au@SnO2/C60/SnO2 sensing film. It can be seen that there are bigger nanopores with the average diameter of 300 nm exhibiting on the surface of sensing composite film. The pore walls with an average thickness of 160 nm are made up of nanoparticle. The presence of C60 and Au nanoparticles in the pore wall is further confirmed by the high resolution TEM image (Fig. 2b) showing the region enclosed within the square in upper right of Fig. 2a. The image shows that Au nanoparticles have uniform particle size, and small size of SnO2 nanoparticles distributed among Au nanoparticles. The high magnification HRTEM image shows the lattice spacing of 0.33 nm and 0.24 nm, corresponding to the (110) plane of cassiterite phase and (111) plane of gold, respectively. Under these bigger nanopores, the high magnification TEM image (Fig. 2c) of selected region in the lower left of Fig. 2a shows that smaller nanopore arrays are packed in an ordered arrangement with a repeating distance. A fast Fourier transformation of the smaller nanoporous SnO2 layer depicted in the insert image of Fig. 2c, indicates orthorhombic symmetry of a [111] oriented Fmmm nanostructure.23 It is proved that this sensing film is composed of Au@SnO2/C60 layer covering the surface of ordered nanoporous SnO2 layer. The elemental mappings of the nanocomposite film are obtained by energy-dispersive spectroscopy (EDS) for Sn, C, and Au as shown in Fig. S1.† Clearly, C and Au are evenly distributed throughout the Au@SnO2/C60 layer. The STEM image (Fig. 2d) illuminates the cross-section structure of Au@SnO2/C60/SnO2 sensing film. Further EDX line measurement taken from the selected area (marked by a red line in Fig. 2d) exhibits the presence of C60 layer in the composite film, indicating the formation of SnO2/C60/SnO2 heterojunctions. Notably, the unique electron coupling at this SnO2/C60/SnO2 interface is able to effectively facilitate the electron transfer from the sensing film to integrated electrode.24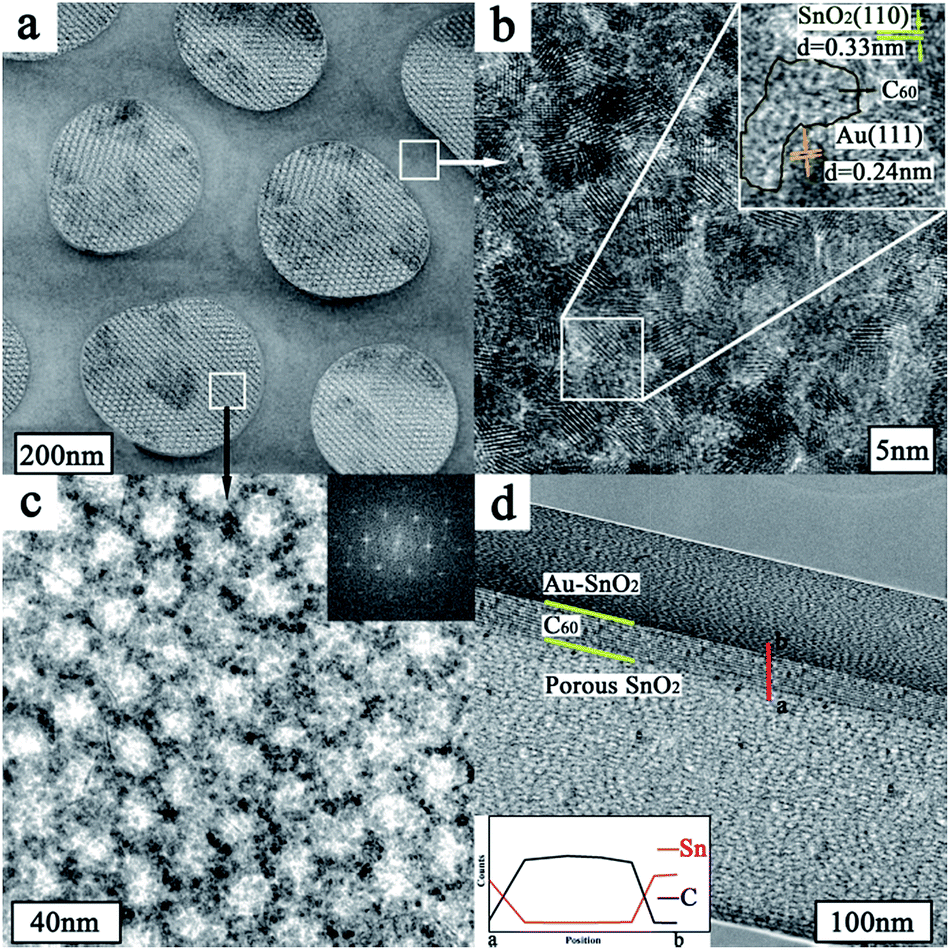 | ||
| Fig. 2 (a) STEM image of Au@SnO2/C60/SnO2 nanocomposite film, (b) HRTEM image shows the region enclosed within the square in upper right of (a). The insert image shows the high magnification of square region in (b). (c) HRTEM image shows the square region in lower left of (a). The insert image shows the fast Fourier transformation of bottom nanoporous SnO2 layer. (d) STEM image of cross-section of nanocomposite film. The insert image shows the EDX line measurement of the film. | ||
As shown in Fig. 3a, Au@SnO2/C60 layer is directly grown on ordered nanoporous SnO2 thin film using post-synthetic hydrothermal treatment and then oxygen-plasma treated. For further investigating the composite sensing film, the structure and crystallinity of the synthesized thin film are confirmed by X-ray diffraction, FTIR, and Raman studies. Fig. 3b shows the XRD characterization of Au@SnO2/C60/SnO2 nanocomposite films prepared by the proposed method. The characteristic peaks of the synthesized nanocomposite films are observed at 10.7°, 17.6°, 20.7° and 27.9° 2θ for the C60 layer. The diffraction peaks at around 38.3° and 44.5° could be indexed to the (111) and (200) planes of a face-centered crystalline structure of Au, respectively. The peaks at 25.7°, 33.8° and 51.9° are due to the diffraction at the (110), (101) and (211) of SnO2, respectively, indicating the successful formation of cassiterite SnO2. The mean crystallite size of the synthesized SnO2 nanoparticles, which is calculated using Scherrer's formula: Ds = 0.9 × λ/(β × cosθ), where Ds is the crystallite size, λ is the wavelength of X-rays (λCu = 0.15418 nm), β is the full width at half maximum (FWHM) of the diffraction peak, and θ is the Bragg diffraction angle of the XRD peak. The mean crystallite size is 3.1 nm, which is in good agreement with the HRTEM studies (Fig. 2b).
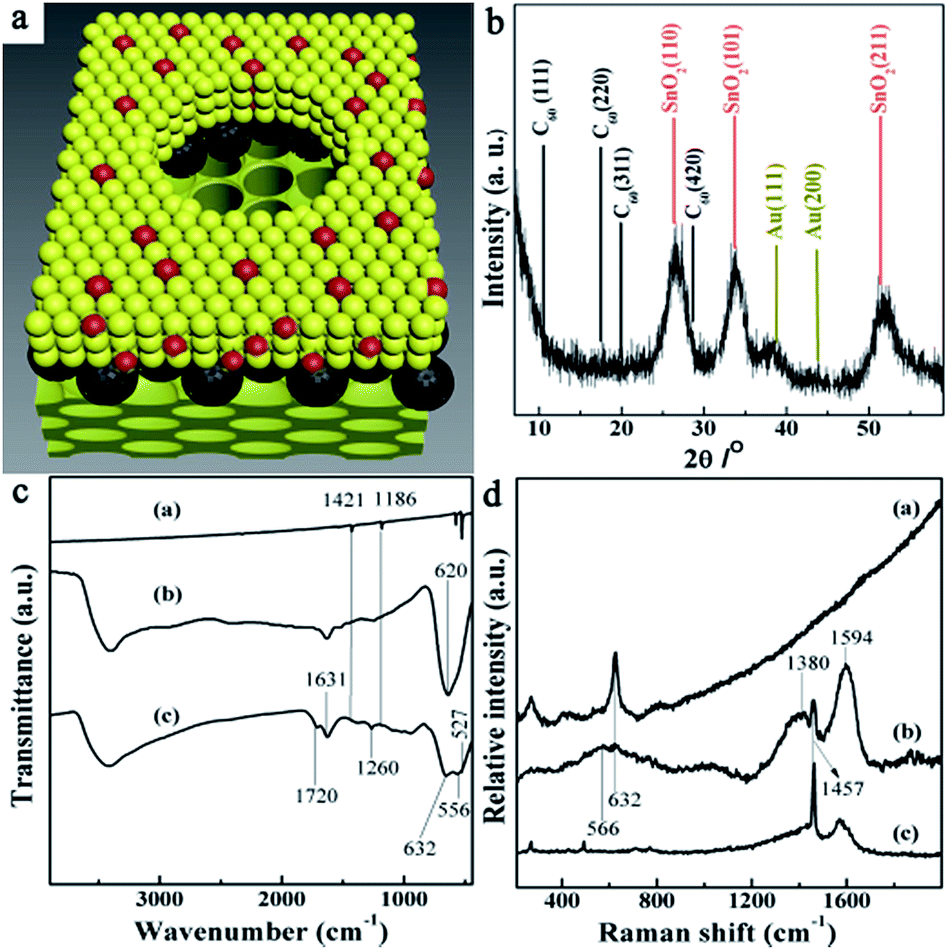 | ||
| Fig. 3 (a) Schematic illustration of the Au@SnO2/C60/SnO2 sensing film. (b) Wide-angle XRD patterns of Au@SnO2/C60/SnO2 sensing films. (c) FT-IR spectra of C60 (a), SnO2 (b), nanocomposite film (c). (d) Raman spectrum of SnO2 (a), nanocomposite film (b), and C60 (c). | ||
Fig. 3c shows the IR spectra in the range of 400 to 3400 cm−1 for IR-active fundamental vibrations of C60 (a), SnO2 (b), and Au@SnO2/C60/SnO2 nanocomposites (c). The peak at 1631 cm−1 can be attributed to O–H bending vibrations. For Au@SnO2/C60/SnO2 nanocomposite films (c), the bands at 527, 577, 1186 and 1421 cm−1 are attributed to the internal modes of the C60 molecule. Two new peaks display at 1659 and 1720 cm−1 for oxygen-plasma treated C60, resulting from the stretching vibration of carboxyl groups formed during the treatment. It should be mentioned that these surface functional groups provide active sites for connection with SnO2 nanocrystals. The IR-active fundamental vibrations of SnO2 are located in the range of 400–1000 cm−1, and the intensive broad bands are ascribed to the stretching vibrations of Sn–O bonds at 556 and 632 cm−1. For pure SnO2 nanoparticle, a broad peak at 621 cm−1 can be assigned to the vibration of Sn–O. When SnO2 is modified with C60, covalent bonds (e.g., Sn–O–C–O or Sn–O–C) formed due to interaction between oxygen plasma-treated C60 and SnO2. As a result, the main peak associated with SnO2 slightly red-shift to low frequency, especially for the band at 632 cm−1. The IR results further confirm the chemically bonded interaction between C60 and SnO2 nanoparticles.
Fig. 3d shows the Raman spectra of SnO2 (a), the synthesized composite films (b), C60 (c). For the synthesized composite film (b), the Raman shifts of C60 are observed at 265 cm−1, 491 cm−1, and 1457 cm−1, which can be associated with H1g squashing, A1g breathing, A2g pentagonal pinch modes of C60 molecules, respectively. The two strong peaks located at 1380 cm−1 (k-point phonons of A1g symmetry, D-band) and 1594 cm−1 (E2g phonons of C sp2 atoms, G-band) exhibit that partial C60 transforms into carbon crystallite in nanocomposite film.25 Compared to the pure C60 (c), changes in the relative intensities of the D and G bands (D/G) indicate the changes of the electronic conjugation state of the C60 during the fabrication procedure. The weak peak located at 632 cm−1 in nanocomposite film can be assigned to the A1g modes of the SnO2 rutile phase. Besides, the other mode named M2 (located at 566 cm−1) being related to the nanostructure of composite film is also identified in the spectra.26
For comparison, we examine the sensing performance of C60/SnO2 film (a), SnO2/C60/SnO2 film (b), and Au-functionalized SnO2/C60/SnO2 film (c), in terms of the ethanol sensing. The typical response curves of three different SnO2 based gas sensors being measured at various ethanol concentrations are shown in Fig. 4a. The response, S, is defined as Rair/Rgas for the reducing gases (ethanol) where Rgas and Rair denote resistance in the presence and absence of test gases, respectively. The measurements are performed at room temperature with ethanol gas exposure concentration ranging from 0.5 ppm to 50 ppm. A clear increase in the sensor response is observed with increasing gas concentration, and of all the materials tested, Au@SnO2/C60/SnO2 composite film displays the best ethanol-sensing performance, with high sensor response of 16.8.6 to 0.5 ppm ethanol gas at room temperature.
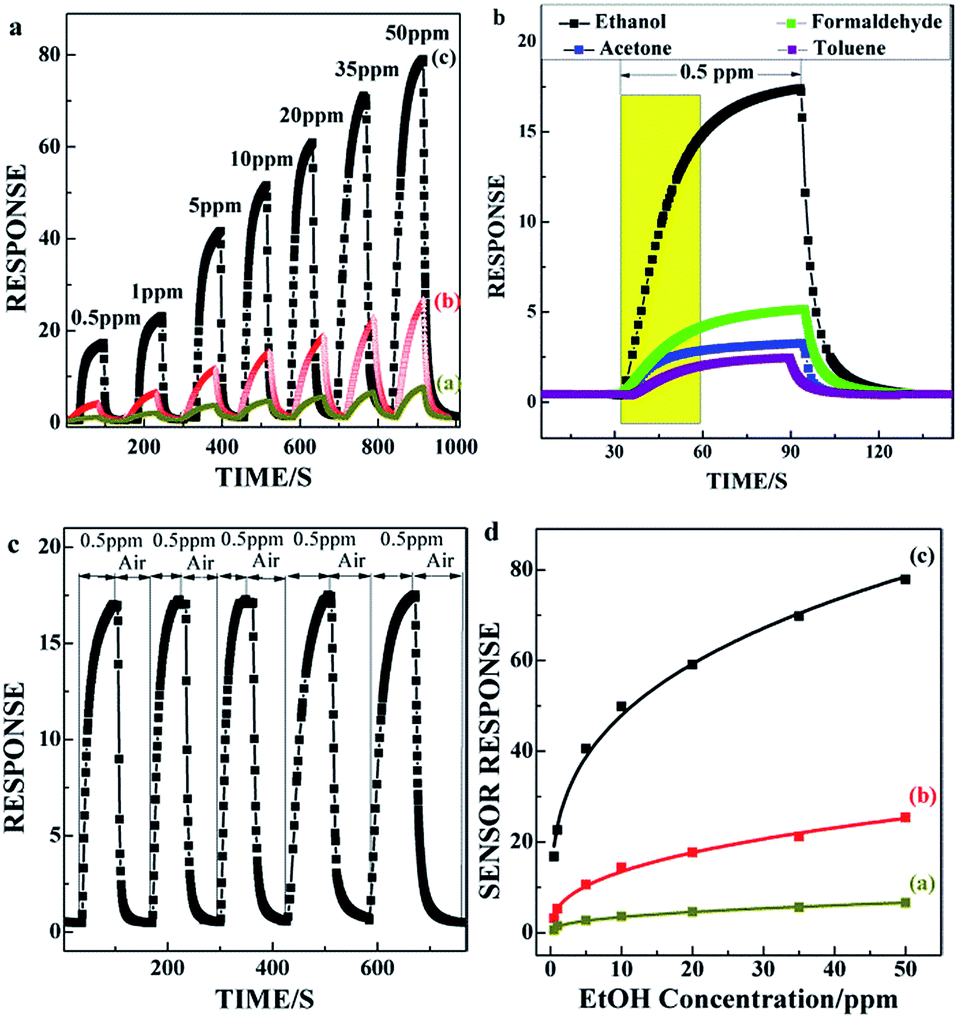 | ||
| Fig. 4 (a) Responses curves of C60/SnO2 (a), SnO2/C60/SnO2 (b), and Au@SnO2/C60/SnO2 sensors (c) measured under various ethanol gas concentrations. (b) Typical response and recovery curves of the Au@SnO2/C60/SnO2 sensor to different VOCs at 0.5 ppm. (c) Cyclic response changes between air, and 0.5 ppm ethanol in N2. (d) Normalized responses of C60/SnO2 (a), SnO2/C60/SnO2 (b), and Au@SnO2/C60/SnO2 (c) sensors as a function of ethanol gas concentrations. | ||
Moreover, the Au@SnO2/C60/SnO2 sensor also depicts the response to formaldehyde, acetone, and toluene gases, as shown in Fig. 4b. The 0.5 ppm ethanol response (16.8) becomes more than four times as high as that of formaldehyde. Thus, the Au@SnO2/C60/SnO2 sensor reveals not only high response but also high ethanol selectivity at low concentration. The response curves illuminate excellent stability, as shown in Fig. 4c. The response time defined as the time necessary to reach 90% of the maximum response is about 35 s, and the recovery time is about 9 s. In Fig. 4d, the Au@SnO2/C60/SnO2 gas sensor (c) shows a power law relationship between S and CEtOH, and the correlation coefficient (n) is estimated to be 0.31 within the gas concentration ranging from 0.5 to 50 ppm (S = a × Cn). They are determined by n/p/n heterostructure in the nanoporous structure which strongly influences carrier mobility in the sensing film. The high sensitivity of Au@SnO2/C60/SnO2 sensor may be due to the high reactivity of ethanol with adsorbed oxygen in the presence of Au-sites on the SnO2/C60/SnO2 surface. The quick response and recovery would also be attributed to the nanoporous structure and n/p/n heterostructure of the composite film. Fig. S2† exhibits the long-term stability of the Au@SnO2/C60/SnO2 sensor exposed to 0.5 ppm ethanol gas. The stability of the sensor is measured over different times on stream. The average and relative standard deviation of the response (S) of the ethanol gas sensor at a testing concentration of 0.5 ppm of ethanol for 48 days are 16.8 and 1.1%, respectively.
The generation of n/p/n heterojunctions (Fig. 5a) can inevitably develop the depletion regions of both sides of junctions, decreasing the conduction volume of SnO2 nanoparticles. The introduction/removal of ethanol gas will induce the more significant change of conduction volume in case of SnO2/C60/SnO2 composite films. This will bring about the larger change in resistance, enhancing the sensitivity. Fig. 5b schematically depicts the changes of the electronic energy bands for C60/SnO2 material before and after the adsorption of ethanol gases. This figure shows two depletion layers-one is on the surface of the SnO2 nanoparticles, and the other is in the interface between C60 and SnO2 nanoparticles. In the n/p/n heterojunctions, the work function of n-SnO2 and C60 are 4.55 and 4.72 eV,27 respectively. Due to the charge transfer, the potential barrier (0.17 eV) will be developed at heterojunctions, being accompanied by the bending of the vacuum energy level and the energy band. The local p/n heterojunctions between C60 and SnO2 nanoparticles will provide additional modulation of resistance during the introduction and removal of ethanol gas by changing the heterojunction barrier.
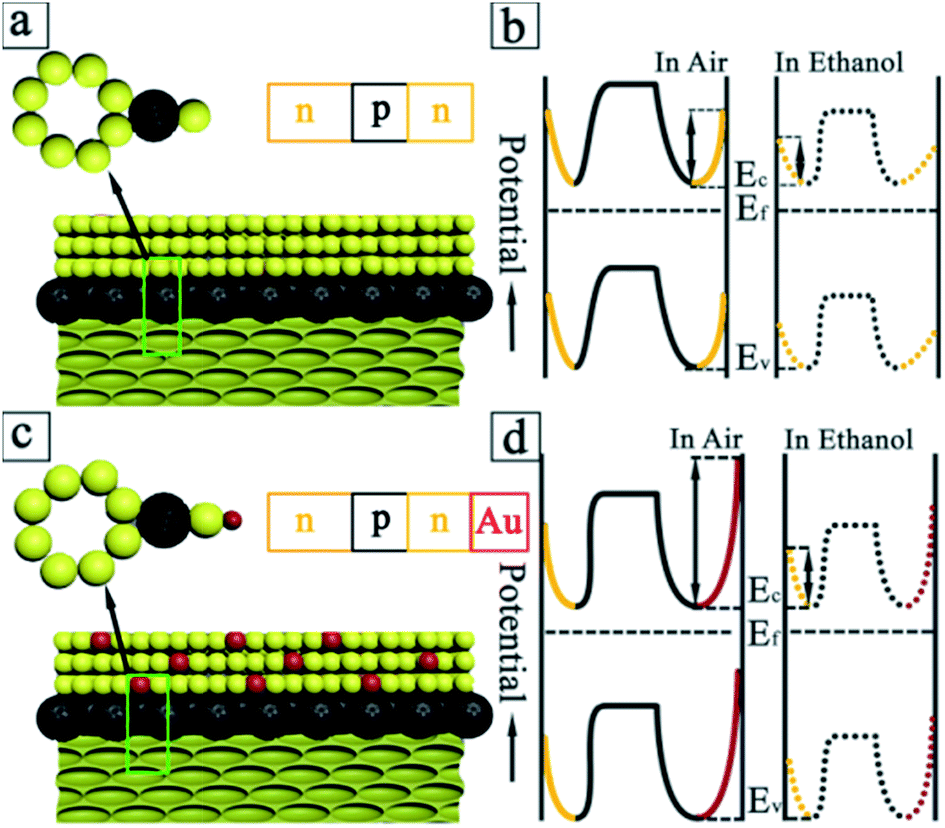 | ||
| Fig. 5 (a) Schematic illustration of the SnO2/C60/SnO2 sensing film. (b) Potential barrier to electronic conduction at grain boundary for SnO2/C60/SnO2 sensing film. (c) Schematic illustration of the Au@SnO2/C60/SnO2 sensing film. (d) Potential barrier to electronic conduction at grain boundary for Au@SnO2/C60/SnO2 sensing film. | ||
In case of Au, Au being a better oxygen dissociation catalyst than SnO2 enhances the rate of dissociation and diffusion of oxygen species on the surface of SnO2, resulting in a greater degree of electron withdrawal from the conduction band of SnO2 (“spill-over” effect). In the Au/SnO2 heterojunctions (Fig. 5c), the work function of Au (5.1 eV) is larger than that of SnO2 (4.55 eV). In order to align the Fermi level, the electrons will flow from SnO2 to Au sides, as the electrostatic potential of the semiconductor is increased. Being similar to the C60–SnO2 heterojunctions, the Schottky barriers (0.55 eV) generated at Au–SnO2 heterojunctions will provide additional modulation of resistance during the adsorption and desorption of gas molecules by changing the heterojunction barrier. In equilibrium and in the absence of ethanol gas, because the Au work function is large, a depletion layer will be developed in the SnO2 nanoparticle. For Au with high work function, this depletion region of electrons is much more pronounced, which gives rise to a larger barrier height. This manifests a larger electrical resistance of the sensing film in air, as shown in Fig. 5d.
From Fig. 5b, we can see that Au@SnO2/C60/SnO2 nanocomposite sensor shows far greater sensitivity to ethanol gas than other gases, manifesting the excellent selectivity to ethanol. On the one hand, it is reported that the O–H band of ethanol is important for the adsorption onto the SnO2 (110) surface. And the SnO2 (110) surface is highly sensitive to ethanol due to its powerful attraction to the polar O–H bond. Even more, quantum size SnO2 nanoparticles (3.1 nm) can provide a catalytic effect to decrease the activation energy of ethanol to oxidize and decompose by first weakening the O–H bond of the ethanol molecule at room temperature.28 On the other hand, the Au-functionalized SnO2/C60/SnO2 sensor exhibits an extreme selectivity to ethanol, in comparison to other gases such as toluene. Adsorbed phenyl groups are stable on the surface until 165 K, but the chemisorbed phenyl group will be desorbed from the Au surface at room temperature. With the reasonable assumption that the stable adsorption is the primarily crucial step for subsequent catalytic reactions, Au NPs will provide both high sensitivity and selectivity in sensing ethanol in comparison to toluene at room temperature.29
Up to the present, significant amount of research work has been reported on the sensing of ethanol gas (Table S1†). First, high sensor responses were attained by means of using various materials systems, including SnO2–ZnO core–shell nanowires,30 Pt@SnO2 nanorods,1 ZnO/MWNTs nanocomposite films,31 C3N4 nanosheet modified SnO2,32 noble metal@metal oxide semiconductors core@shell nanoarchitectures,3 SnO2–RGO hybrid composite films.10,33,34 Accordingly, there are rare reports on the preparation of highly sensitive ethanol sensor operating at room temperature below 1 ppm. Wu et al. have investigated the sensing activity of Ag@SnO2 core@shell NPs for ethanol by comparing its gas sensing performance with bare SnO2 nanomaterials. The sensor response of core@shell NPs was 0.3 and the response and recovery times of 34 s and 68 s at room temperature.35 Li et al. utilized Au-decorated SnO2 nanoparticles for obtaining the higher response of 0.6 at a low concentration of 0.5 ppm.36 However, the grain size was more than 30 nm, which hindered the further improvement in sensing performance. In this work, the gas sensor exhibits ultrahigh sensitivity to ethanol gas with response value up to 16.8 to 0.5 ppm at room temperature.
4. Conclusions
In summary, we employ not only the Au-functionalization but also the C60-functionalization to synthesize hierarchically nanoporous composite films for enhancing the sensing performance. The fabricated hierarchically nanoporous Au@SnO2/C60/SnO2 nanocomposite are obtained through water vapour hydrothermal treatment and layer by layer self-assembly. Their hierarchical nanopore structure is bimodal with closely packed open macropores (∼300 nm) at Au@SnO2/C60 layer and with highly ordered nanoporous with a narrow size range of nanopores mainly from 8–10 nm at the bottom SnO2 layer. The structure, crystallinity and composition of the hierarchical structure Au@SnO2/C60/SnO2 nanocomposite films are characterized by XRD, Raman, HRTEM, and SAED. Interestingly, the Au@SnO2/C60/SnO2 nanocomposite films are treated with oxygen-plasma treatment to remove the organic template and modify the sensing activity. The Au@SnO2/C60/SnO2 nanocomposite sensor demonstrates the ultrasensitive ethanol sensing behaviour at room temperature. The sensing properties of Au@SnO2/C60/SnO2 nanocomposite sensors are investigated by exposing it to ethanol gas with a concentration range from 0.5 ppm to 50 ppm. Furthermore, these gas sensors exhibit ultrahigh sensitivity to ethanol gas with response value up to 16.8 to 0.5 ppm and a short recovery time of 9 second at room temperature. The synthesis method of combining the hierarchical nanoporous structure with layer by layer self-assembly is a general technique, and offers a promising strategy for preparing high performance nanoporous crystalline materials for applications including gas sensing, photocatalysis, and 3rd generation photovoltaics.Conflicts of interest
There are no conflicts to declare.Acknowledgements
This work was supported by the Start up Foundation for Introducing Talent of NUIST (2014r034), Project of Natural Science Foundation of the Higher Education Institutions of Jiangsu Province (17KJB430024) and Horizontal Subject (2016h036).References
- X. Xue, Z. Chen, C. Ma, L. Xing, Y. Chen, Y. Wang and T. Wang, J. Phys. Chem. C, 2010, 114, 3968 CAS.
- B. Zhang, W. Fu, H. Li, X. Fu, Y. Wang, H. Bala, X. Wang, G. Sun, J. Cao and Z. Zhang, Appl. Surf. Sci., 2016, 363, 560 CrossRef CAS.
- P. Rai, S. M. Majhi, Y.-T. Yu and J.-H. Lee, RSC Adv., 2015, 5, 76229 RSC.
- S. Shao, R. Koehn, H. Wu, T. Wu and W.-F. Rao, New J. Chem., 2016, 40, 5523 RSC.
- X. Sun, H.-t. Fang, H.-l. Yu, Y. Chu, B.-y. Zhang, J.-h. Du, D.-w. Wang, F. Li and F.-p. Wang, New Carbon Mater., 2010, 25, 218 CAS.
- S. Salehi, E. Nikan, A. A. Khodadadi and Y. Mortazavi, Sens. Actuators, B, 2014, 205, 261 CrossRef CAS.
- P. Baraneedharan, S. Alexander and S. Ramaprabhu, J. Appl. Electrochem., 2016, 46, 1187 CrossRef CAS.
- M. Mazloum-Ardakani and A. Khoshroo, Electrochem. Commun., 2014, 42, 9 CrossRef CAS.
- J. A. Rather, A. J. A. Harthi, E. A. Khudaish, A. Qurashi, A. Munama and P. Kannan, Anal. Methods, 2016, 8, 5690 RSC.
- C. A. Zito, T. M. Perfecto and D. P. Volanti, Sens. Actuators, B, 2017, 244, 466 CrossRef CAS.
- Y. Qu, H. Wang, H. Chen, M. Han and Z. Lin, Sens. Actuators, B, 2016, 228, 595 CrossRef CAS.
- Q. T. Minh Nguyet, N. Van Duy, N. T. Phuong, N. N. Trung, C. M. Hung, N. D. Hoa and N. Van Hieu, Sens. Actuators, B, 2017, 238, 1120 CrossRef.
- P. Clément, S. Korom, C. Struzzi, E. J. Parra, C. Bittencourt, P. Ballester and E. Llobet, Adv. Funct. Mater., 2015, 25, 4011 CrossRef.
- A. Wittstock, J. Biener and M. Baumer, Phys. Chem. Chem. Phys., 2010, 12, 12919 RSC.
- S. Arunkumar, T. Hou, Y.-B. Kim, B. Choi, S. H. Park, S. Jung and D.-W. Lee, Sens. Actuators, B, 2017, 243, 990 CrossRef CAS.
- C. Liu, H. Tai, P. Zhang, Z. Ye, Y. Su and Y. Jiang, Sens. Actuators, B, 2017, 246, 85 CrossRef CAS.
- N. Goswami, F. Lin, Y. Liu, D. T. Leong and J. Xie, Chem. Mater., 2016, 28, 4009 CrossRef CAS.
- Y. Liu, Y. Zheng, B. Du, R. R. Nasaruddin, T. Chen and J. Xie, Ind. Eng. Chem. Res., 2017, 56, 2999 CrossRef CAS.
- J. Li, T. Zhao, T. Chen, Y. Liu, C. N. Ong and J. Xie, Nanoscale, 2015, 7, 7502 RSC.
- Y. Liu, Q. Yao, X. Wu, T. Chen, Y. Ma, C. N. Ong and J. Xie, Nanoscale, 2016, 8, 10145 RSC.
- F. Gu, H. Wang, D. Han and Z. Wang, Sens. Actuators, B, 2017, 245, 1023 CrossRef CAS.
- S. Shao, H. Wu, S. Wang, Q. Hong, R. Koehn, T. Wu and W.-F. Rao, J. Mater. Chem. C, 2015, 3, 10819 RSC.
- C. Boissiere, D. Grosso, S. Lepoutre, L. Nicole, A. B. Bruneau and C. Sanchez, Langmuir, 2005, 21, 12362 CrossRef CAS PubMed.
- Z. Zhu, Y. Bai, X. Liu, C. C. Chueh, S. Yang and A. K. Jen, Adv. Mater., 2016, 28, 6478 CrossRef CAS PubMed.
- Y. Qu, H. Wang, H. Chen, M. Han and Z. Lin, Sens. Actuators, B, 2016, 228, 595 CrossRef CAS.
- F. H. Aragón, J. C. R. Aquino, N. C. S. Gomes, J. D. Ardisson, S. W. da Silva, D. G. Pacheco-Salazar and J. A. H. Coaquira, J. Eur. Ceram. Soc., 2017, 37, 3375 CrossRef.
- H. Liang, S. Xu, W. Liu, Y. Sun, X. Liu, X. Zheng, S. Li, Q. Zhang, Z. Zhu, X. Zhang, C. Dong, C. Li, G. Yuan and H. Mimura, Phys. Lett. A, 2013, 377, 2676 CrossRef CAS.
- J. Yue, X. Jiang and A. Yu, J. Phys. Chem. C, 2013, 117, 9962 CAS.
- D. Syomin, J. Kim, B. E. Koel and G. B. Ellison, J. Phys. Chem. B, 2001, 105, 8387 CrossRef CAS.
- D. T. Thanh Le, D. D. Trung, N. D. Chinh, B. T. Thanh Binh, H. S. Hong, N. Van Duy, N. D. Hoa and N. Van Hieu, Curr. Appl. Phys., 2013, 13, 1637 CrossRef.
- D. Zhang, Y. e. Sun and Y. Zhang, J. Mater. Sci.: Mater. Electron., 2015, 26, 7445 CrossRef CAS.
- J. Cao, C. Qin, Y. Wang, H. Zhang, B. Zhang, Y. Gong, X. Wang, G. Sun, H. Balac and Z. Zhang, RSC Adv., 2017, 7, 25504 RSC.
- D. Zhang, J. Liu, H. Chang, A. Liu and B. Xia, RSC Adv., 2015, 5, 18666 RSC.
- J.-H. Kim, A. Katoch, H. W. Kim and S. S. Kim, Chem. Commun., 2016, 52, 3832 RSC.
- R.-J. Wu, D.-J. Lin, M.-R. Yu, M. H. Chen and H.-F. Lai, Sens. Actuators, B, 2013, 178, 185 CrossRef CAS.
- Y. Li, F.-X. Zhao, X.-X. Lian, Y.-L. Zou, Q. Wang and Q.-J. Zhou, J. Electron. Mater., 2016, 45, 3149 CrossRef CAS.
Footnote |
| † Electronic supplementary information (ESI) available. See DOI: 10.1039/c7ra11021a |
| This journal is © The Royal Society of Chemistry 2017 |