 Open Access Article
Creative Commons Attribution 3.0 Unported Licence
Highly sensitive and selective fluorescence detection of Hg2+ based on turn-on aptamer DNA silver nanoclusters†
Baozhu Zhangab and
Chunying Wei *a
*a
aKey Laboratory of Chemical Biology and Molecular Engineering of Ministry of Education, Institute of Molecular Science, Shanxi University, Taiyuan 030006, P. R. China. E-mail: weichuny@sxu.edu.cn
bCollege of Chemistry and Chemical Engineering, Jinzhong University, Yuci 030600, P. R. China
First published on 13th December 2017
Abstract
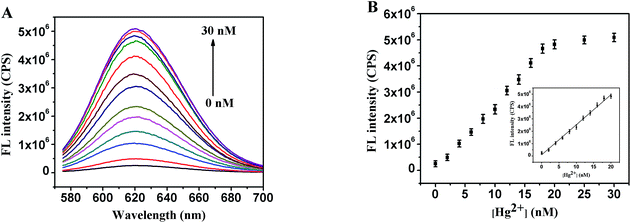
A novel turn-on Hg2+ sensor was constructed based on fluorescent C–Hg2+-aptamer DNA-stabilized Ag nanoclusters (DNA–AgNCs), and was used to determine the concentration of Hg2+ over the range 2–18 nM with a detection limit as low as 0.25 nM. The sensing assay relied on a target-induced conformational transition of Hg2+-aptamer DNA. The conformational change of Hg2+-aptamer DNA from a single strand to a hairpin DNA due to the formation of a T–Hg2+–T complex in the presence of Hg2+ made the two darkish DNA–AgNCs approach each other closely and then enhanced the fluorescence of the AgNCs, which enabled the sensitive and specific detection of Hg2+. The proposed sensor was found to be easy to use, and allowed for the sensitive, selective, and turn-on detection of Hg2+. Furthermore, this approach has also been successfully applied to the detection of Hg2+ in real water samples, so this sensor may find application in monitoring Hg2+ in environmental samples.
1 Introduction
Hg2+ is a highly toxic metal ion, and causes, even at low concentrations, severe damage to various organs such as the brain and kidneys and to the nervous, endocrine and cardiovascular systems.1–3 Therefore, many methods have been developed for detecting Hg2+ in recent years, including electrochemical methods,4,5 atomic absorption/emission spectroscopy,6,7 fluorescence resonance energy transfer,8 use of electrochemiluminescence sensors,9 inductively coupled plasma mass spectrometry,10,11 high-performance liquid chromatography,12 and atomic fluorescence spectroscopy.13 However, these methods have disadvantages, in particular they either require special instrumentation or take a lot of time to perform. Alternatively, molecular fluorescence-based methods have garnered special attention owing to their high sensitivity, good selectivity, and low-cost instruments, particularly in those systems involving DNA,14 small molecules,15 peptides, and proteins.16,17Fluorescent noble metal nanoclusters, including gold/silver nanoclusters comprising a few to tens of atoms, have attracted great interest due to their good photostability, low toxicity, excellent biocompatibility, and ultrasmall size. They have been applied as fluorescent probes and photoluminescent and electroluminescent materials for bio-labeling, bio-imaging, and ultrasensitive biological detection.18,19 Noble metal nanoclusters are often synthesized by employing templates such as amino acids, thiols, proteins, dendrimers, and DNA.20–24 Among them, the fluorescent Ag nanoclusters using DNA as the scaffold (DNA–AgNCs) have attracted special attention25,26 because of their outstanding spectral and photophysical properties and tunable fluorescence properties from blue to near-infrared emission that is realized by varying the base sequences or strand lengths of the oligonucleotides.27,28 Ag+ ions bind selectively to the heterocyclic bases of the DNA oligonucleotides rather than to their phosphate and sugar groups.29 In particular, Ag+ can selectively coordinate with the cytosine base.30 Ag atoms reduced by NaBH4 bind very tightly to cytosines of oligonucleotide, rendering them chemically stable in biological buffers. Fluorescent metal nanoclusters have been employed for the detection of Hg2+,31,32 but most of them are ‘light-off’ sensors,28,31,32 which are undesirable from the sensing point of view due to susceptibility to false signals, large background variation, and the limited room for signal change. To overcome these problems, some ‘light-up’ sensors to detect Hg2+ have been designed.14,33 However, it is very challenging to develop low-cost, easy-to-use, highly sensitive, real-time turn-on sensors of Hg2+ based on metal nanoclusters.
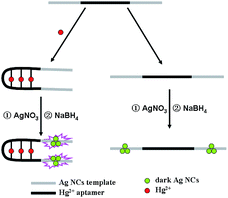
Inspired by the fluorescence light-up phenomenon resulting from placing two darkish DNA–AgNCs together to form a probe pair through their complementary linkers,34 we herein used a similar procedure to construct a novel Hg2+ sensor, and the working principle of the proposed assay is depicted in Scheme 1. The DNA template included two segments, one was a thymine (T)-containing Hg2+ aptamer segment (Hg2+-aptamer-1 and Hg2+-aptamer-2, Table S1†) in the middle of the DNA template, and the other was AgNC-nucleation segments at the two termini. Hg2+ has been shown to specifically bind to two thymine (T) residues of DNA to form the T–Hg2+–T complex.35 Therefore, the hairpin structure formed by C–Hg2+-aptamer-AgNCs (Table S1†) in the presence of Hg2+ made the two darkish DNA–AgNCs approach each other closely and then enhanced the fluorescence of the DNA–AgNCs, which enabled the sensitive and specific detection of Hg2+. This approach provided for a novel fluorescent turn-on chemical assay avoiding the need to design a complicated fluorescent sensor and use an organic solvent.
 | ||
| Scheme 1 Schematic illustration of the strategy used to detect Hg2+. This strategy is based on ssDNA-templated silver nanoclusters combining with an Hg2+ aptamer. | ||
2 Experimental
2.1 Reagents and apparatus
The DNA oligonucleotides used in this work were obtained from Sangon Biotechnology Inc. (Shanghai, China). The sequences of these oligonucleotides are listed in Table S1.† NaBH4, AgNO3, NaNO3, KNO3, Mg(NO3)2, CaCl2, Cu(NO3)2, Zn(NO3)2, Cd(NO3)2, Hg(NO3)2, Fe(NO3)3, Co(NO3)2, Pb(NO3)2, Mn(NO3)2, Cr(NO3)3, and TbCl3 were provided by Aladdin Bio-Chem Technology Co. Ltd. (Shanghai, China). All chemical reagents were of analytical grade and used as received without further purification. Phosphate buffer solution (PBS, 20 mM, pH 6.6 or 6.3) was used in all of the experiments. All solutions were prepared using Milli-Q water.Fluorescence spectra were acquired on a Fluoromax-4 spectrofluorometer (Horiba Jobin Yvon Inc., France), and the slit widths were 10 nm and 5.0 nm for emission and excitation, respectively. UV-Vis absorption measurements were recorded on a Cary 50 Bio spectrophotometer (Varian Inc., CA). Time-resolved fluorescence measurements were taken using an FL920 fluorescence lifetime spectrometer (Edinburgh Instruments, Livingston, UK) operating in the time-correlated single photon counting (TCSPC) mode. For data analyses, commercial software by Edinburgh Instruments was used. The average excited-state lifetime was expressed by using the equation  , when
  . The reported spectrum of each sample represented the average of three scans. The average sizes and morphologies of the DNA–AgNCs were characterized by using a JEOL JEM-2100 transmission electron microscope with an acceleration voltage of 200 kV. CD spectra were acquired by using a Chirascan circular dichroism spectrometer (Applied Photophysics Ltd., Surrey, UK), and the spectrum was recorded from 220 to 320 nm at 1 nm intervals using a quartz cell with a 1 mm optical path length and an instrument scanning speed of 120 nm min−1 at room temperature. X-ray photoelectron spectroscopy (XPS) (ESCAL-ab 220i-XL, VG Scientific, England) was performed by using monochromic Al K-alpha radiation as a source at 1486.6 eV.
2.2 Preparation of DNA–AgNCs and fluorescence assay of Hg2+
DNA–AgNCs were synthesized according to our previously reported method but with minor modifications.36 Briefly, the DNA oligonucleotides (0.3 nM) were mixed with various concentrations (0–30 nM) of Hg2+ ions in PBS buffer (20 mM, pH 6.6 for C–Hg2+-aptamer-1-AgNCs, and pH 6.3 for C–Hg2+-aptamer-2-AgNCs) and then incubated for 10 min. Then, an AgNO3 aqueous solution was added to the mixture under vigorous shaking for 30 s, and the resulting mixture was kept in the dark at 4 °C for 20 min, followed by being reduced with freshly prepared NaBH4 with vortexing for 1 min. The final concentrations of DNA, AgNO3, and NaBH4 were 0.3, 1.8, and 1.8 μM, respectively. The final C–Hg2+-aptamer-1-AgNC and Hg2+-aptamer-2-AgNC mixtures were stored in the dark at 4 °C for 2.5 hours and one hour, respectively, and these incubation times were calculated based on the amount of NaBH4 added. The fluorescence spectrum of each sample was monitored at room temperature.2.3 Selective detection of Hg2+
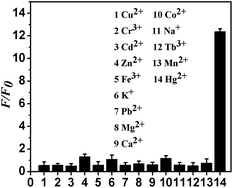
The selectivity of the fluorescence assay was measured by testing 13 different metal ions, specifically Na+, K+, Mg2+, Ca2+, Cu2+, Zn2+, Cd2+, Fe3+, Co2+, Pb2+, Mn2+, Cr3+, and Tb3+. The concentrations of Hg2+ and the other metal ions were 0.01 and 0.1 μM, respectively. The assay method used for the other metal ions was same as that used for Hg2+.2.4 Circular dichroism measurements
A concentration of 5.0 μM of each C–Hg2+-aptamer was first mixed with or without 20 nM Hg2+ in 20 mM PBS buffer (pH 6.6 or 6.3), and then C–Hg2+-aptamer-DNA–AgNCs were prepared according to the method described above (see Section 2.2). Subsequently, CD spectra of the DNA–AgNCs were acquired.2.5 Analytical applications
To evaluate the practical application of the probe for the detection of Hg2+ in real samples such as tap water and lake water (from Shanxi University), the samples were spiked with standard Hg2+ solutions of various known concentrations, and the actual samples were measured under the same condition as that in the buffer.3 Results and discussion
3.1 Characterization of the DNA–AgNCs
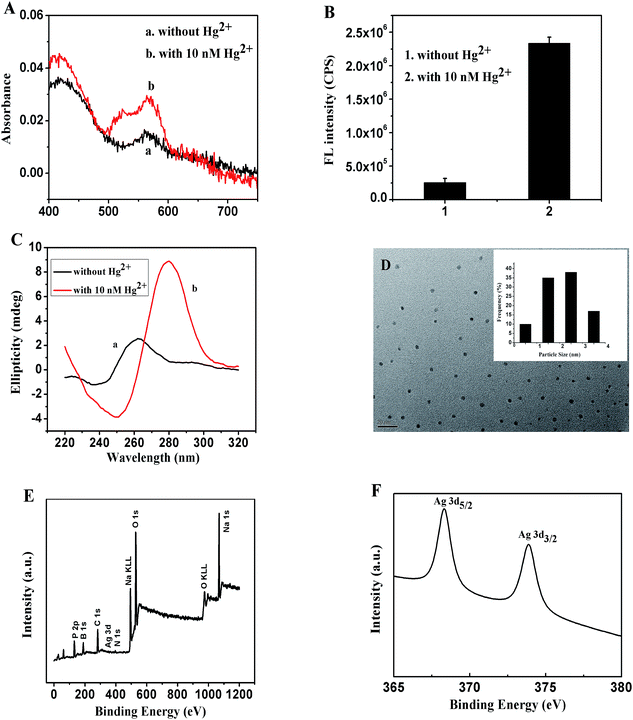
Two different DNA sequences, C–Hg2+-aptamer-1 and C–Hg2+-aptamer-2 (Table S1†), were designed as the templates to form the DNA–AgNCs, in which the Hg2+ aptamer segment was in the middle of the template (italic), while the C-rich segments were at the 5′ and 3′ ends, respectively (bold). The optical characterizations of C–Hg2+-aptamer-1-AgNCs in the absence and presence of 10 nM Hg2+ are shown in Fig. 1A. Both UV-Vis absorption spectra of C–Hg2+-aptamer-1-AgNCs alone (curve a) and with 10 nM Hg2+ (curve b) showed two peaks at wavelengths of 430 and 560 nm, and the peak at 430 nm was the characteristic plasmon absorption band of the Ag nanoparticles37,38 and the peak at 560 nm was likely the AgNC absorption band. Fig. S1A and B† show the fluorescent emission spectra of C–Hg2+-aptamer-1-AgNCs in the absence and presence of 10 nM Hg2+ under various excitation wavelengths, respectively, and the DNA–AgNCs displayed excitation wavelength-dependent emission properties. Upon excitation at 560 nm, the C–Hg2+-aptamer-1-AgNCs in the absence and presence of Hg2+ presented a maximum emission peak at 620 nm, but the fluorescence intensity of the latter was about nine times stronger than that of the former (Fig. 1B); this difference may have been due to the Hg2+-aptamer-1 DNA being folded into a hairpin-shaped structure in the presence of Hg2+ and hence making the two darkish DNA–AgNCs approach each other closely, resulting in the relatively strong fluorescence (Scheme 1). To confirm this proposal, CD spectra of the C–Hg2+-aptamer-1-AgNCs in the absence and presence of Hg2+ were acquired. As shown in Fig. 1C, the CD spectrum of the probe itself showed a random coil (curve a), whereas the CD spectrum of the probe incubated with 20 nM Hg2+ (curve b) presented a positive band centered at a wavelength of 280 nm together with a negative band at 250 nm. This result was in accordance with the CD spectrum of Hg2+-aptamer-1 in the presence of 8 μM Hg2+,39 indicating the C–Hg2+-aptamer-1-AgNCs formed a hairpin structure in the presence of Hg2+. In addition, the UV-Vis absorption spectra and fluorescence spectra of C–Hg2+-aptamer-2-AgNCs alone and with 10 nM Hg2+ are shown in Fig. S2.† Both the absorption spectrum of C–Hg2+-aptamer-2-Ag NCs alone (curve a) and that with 10 nM Hg2+ (curve b) showed a strong peak at 430 nm and a weak band at about 550 nm. Fig. S2B and C† show the fluorescence emission spectra of, respectively, C–Hg2+-aptamer-2-AgNCs alone and with 10 nM Hg2+, under various excitation wavelengths. Upon excitation at 570 nm, C–Hg2+-aptamer-2-AgNCs alone and that with 10 nM Hg2+ each presented a maximum emission peak at a wavelength of 622 nm. In accordance with the results of C–Hg2+-aptamer-1-AgNCs, the fluorescence intensity of the latter was 5.6 times stronger than that of the former (Fig. S2D†). The CD spectrum of C–Hg2+-aptamer-2-AgNCs with 20 nM Hg2+ (Fig. S2E†) demonstrated that Hg2+-aptamer-2 also formed the hairpin structure when Hg2+ was added.39According to the above results, the enhancement of the fluorescence intensity of the C–Hg2+-aptamer-1-AgNCs after incubating with 10 nM Hg2+ was greater than that of the C–Hg2+-aptamer-2-AgNCs in the same condition. Thus, we further investigated the properties of the C–Hg2+-aptamer-1-AgNCs probe alone and with Hg2+. The fluorescence lifetimes at a wavelength of 620 nm of the C–Hg2+-aptamer-1-Ag NCs incubated with and without the target Hg2+ were first measured (Fig. S3†). The fluorescence transients of C–Hg2+-aptamer-1-Ag NCs presented the tri-exponential time constants as tabulated in Table S2.† The results illustrated that there were no obvious differences between the average fluorescence lifetimes of C–Hg2+-Aptamer-1-AgNCs in the absence and presence of different concentrations of Hg2+, further demonstrating a static interaction mechanism. Furthermore, the acquired TEM image of C–Hg2+-aptamer-1-AgNCs in the presence of 10 nM Hg2+ illustrated the formation of uniformly dispersed and nearly spherical DNA–AgNCs with an average diameter of nearly 2 nm (Fig. 1D). XPS was performed to determine whether various elements were present and to determine the valence state of the Ag element in the C–Hg2+-aptamer-1-AgNCs. As shown in Fig. 1E, the presence of B, C, N, O, P, Na and Ag was confirmed. The percentage of the AgNCs consisting of Ag was calculated from the peak areas of the elements to be 0.65%. As shown in the magnified view of the spectrum in its Ag 3d region (Fig. 1F), binding energy values at 368.2 eV for Ag 3d5/2 and 374.2 eV for Ag 3d3/2 were observed, confirming the presence of elemental Ag(0) in the C–Hg2+-aptamer-1-AgNCs.40
3.2 Optimization of experimental conditions for Hg2+ determination
| Samples | Spiked (nM) | C–Hg2+-aptamer-1-AgNCs | C–Hg2+-aptamer-1-AgNCs |
|---|---|---|---|
| Measured (nM), meana ± SDb | Recovery (%) | ||
| a The mean of three determinations.b SD = standard deviation. | |||
| Lake water 1 | 5 | 5.315 ± 0.13 | 106.3 |
| Lake water 2 | 10 | 10.06 ± 0.06 | 100.6 |
| Lake water 3 | 15 | 15.08 ± 0.12 | 100.5 |
| Tap water 1 | 5 | 5.102 ± 0.07 | 102.0 |
| Tap water 2 | 10 | 10.13 ± 0.21 | 101.3 |
| Tap water 3 | 15 | 14.89 ± 0.32 | 99.27 |
4 Conclusions
In summary, a novel strategy for the detecting Hg2+ has been developed using C–Hg2+-aptamer-DNA-stabilized AgNCs as a turn-on fluorescent probe based on an Hg2+-induced conformational transition of Hg2+-aptamer-DNA. This sensor presented high sensitivity and selectivity with an LOD of 0.25 nM that met the requirements of industrial and environmental monitoring applications. This novel sensing assay was a low-cost, turn-on, and sensitive assay and could be easily performed by carrying out simple mixing. In addition, it was also successfully applied to practical situation, specifically the detection of Hg2+ in real water samples. So the proposed sensing system is considered to have the potential to be a useful tool for detection of Hg2+ in environmental water.Conflicts of interest
There are no conflicts to declare.Acknowledgements
This work was supported by the National Natural Science Foundation of China (21171108) and Shanxi Provincial Fund for Natural Sciences (201601D011026).Notes and references
- M. Zaib, M. Athar, A. Saeed and U. Farooq, Biosens. Bioelectron., 2015, 74, 895–908 CrossRef CAS PubMed.
- Z. Li, Y. Ni and S. Kokot, Biosens. Bioelectron., 2015, 74, 91–97 CrossRef CAS PubMed.
- E. M. Nolan and S. J. Lippard, Chem. Rev., 2008, 108, 3443–3480 CrossRef CAS PubMed.
- D. Han, Y.-R. Kim, J.-W. Oh, T. H. Kim, R. K. Mahajan, J. S. Kim and H. Kim, Analyst, 2009, 134, 1857–1862 RSC.
- C. Rusinek, A. Bange, I. Papautsky, W. Heineman, J. Chen, S. Zhou and J. Wen, Anal. Chem., 2014, 86, 3108–3114 CrossRef PubMed.
- K. Kristian, S. Friedbauer, D. Kabashi, K. Ferencz, J. Barajas and K. Brien, J. Chem. Educ., 2015, 92, 698–702 CrossRef CAS.
- F. Han, W. Patterson, Y. Xia, B. Sridhar and Y. Su, Water, Air, Soil Pollut., 2006, 170, 161–171 CrossRef CAS.
- H. Cheng and Y. Qian, Sens. Actuators, B, 2015, 219, 57–64 CrossRef CAS.
- R. Huang, X. Li, Q. Gai, G. Liu and Z. Wei, Biosens. Bioelectron., 2015, 71, 194–199 CrossRef CAS PubMed.
- B. M. W. Fong, T. S. Siu, J. S. K. Lee and S. Tam, J. Anal. Toxicol., 2007, 37, 281–287 CrossRef.
- D. Malinovsky, R. E. Sturgeon and L. Yang, Anal. Chem., 2008, 80, 2548–2555 CrossRef CAS PubMed.
- L. Dong, X. Yan, Y. Li, Y. Jiang, S. Wang and D. Jiang, J. Chromatogr., A, 2004, 1036, 119–125 CrossRef CAS PubMed.
- J. L. Gomez-Ariza, F. Lorenzo and T. Garcia-Barrera, Anal. Bioanal. Chem., 2005, 382, 485–492 CrossRef CAS PubMed.
- L. Deng, Z. Zhou, J. Li, T. Li and S. Dong, Chem. Commun., 2011, 47, 11065–11067 RSC.
- B. Adhikari and A. Banerjee, Chem. Mater., 2010, 22, 4364–4371 CrossRef CAS.
- C. Guo and J. Irudayaraj, Anal. Chem., 2011, 83, 2883–2889 CrossRef CAS PubMed.
- H. Wei, Z. Wang, L. Yang, S. Tian, C. Hou and Y. Lu, Analyst, 2010, 135, 1406–1410 RSC.
- S. Choi, R. M. Dickson and J. Yu, Chem. Soc. Rev., 2012, 41, 1867–1891 RSC.
- L. Shang, S. Dong and G. U. Nienhaus, Nano Today, 2011, 6, 401–418 CrossRef CAS.
- N. Liu, S. Mukherjee, K. Bao, Y. Li, L. Brown, P. Nordlander and N. Halas, ACS Nano, 2012, 6, 5482–5488 CrossRef CAS PubMed.
- J. Petty, J. Zhang, N. Hud and R. Dickson, J. Am. Chem. Soc., 2004, 126, 5207–5212 CrossRef CAS PubMed.
- T. Udayabhaskararao and T. Pradeep, J. Phys. Chem. Lett., 2013, 4, 1553–1564 CrossRef CAS PubMed.
- N. Zhang, Y. Si, Z. Sun, L. Chen, R. Li, Y. Qiao and H. Wang, Anal. Chem., 2014, 86, 11714–11721 CrossRef CAS PubMed.
- A. Fihey, F. Maurel and A. Perrier, J. Phys. Chem. C, 2014, 118, 4444–4453 CAS.
- Y. Antoku, Fluorescent poly-cytosine-encapsulated silver nanoclusters, PhD thesis, Georgia Institute of Technology, 2007.
- J. L. MacLean, K. Morishita and J. Liu, Biosens. Bioelectron., 2013, 48, 82–86 CrossRef CAS PubMed.
- C. I. Richards, S. Choi, J. Hsiang, Y. Antoku, T. Vosch, A. Bongiorno, Y. Tzeng and R. M. Dickson, J. Am. Chem. Soc., 2008, 130, 5038–5039 CrossRef CAS PubMed.
- E. G. Gwinn, P. O'Neill, A. J. Guerrero, D. Bouwmeester and D. K. Fygenson, Adv. Mater., 2008, 20, 279–283 CrossRef CAS.
- B. Han and E. Wang, Anal. Bioanal. Chem., 2012, 402, 129–138 CrossRef CAS PubMed.
- A. Ono, S. Cao, H. Togashi, M. Toshiro, T. Fujimoto, T. Machinami, S. Oda, Y. Miyake, I. Okamoto and Y. Tanaka, Chem. Commun., 2008, 39, 4825–4827 RSC.
- W. Guo, J. Yuan and E. Wang, Chem. Commun., 2009, 45, 3395–3397 RSC.
- C. Li and C. Wei, Sens. Actuators, B, 2017, 242, 563–568 CrossRef CAS.
- Y. Tao, Y. Lin, Z. Huang, J. Ren and X. Qu, Talanta, 2012, 88, 290–294 CrossRef CAS PubMed.
- B. Yin, J. Ma, H. Le, S. Wang, Z. Xu and B. Ye, Chem. Commun., 2014, 50, 15991–15994 RSC.
- Y. Miyake, H. Togashi, M. Tashiro, H. Yamaguchi, S. Oda, M. Kudo, Y. Tanaka, Y. Kondo, R. Sawa, T. Fujimoto, T. Machinami and A. Ono, J. Am. Chem. Soc., 2006, 128, 2172–2173 CrossRef CAS PubMed.
- J. Xu and C. Wei, Biosens. Bioelectron., 2017, 87, 422–427 CrossRef CAS PubMed.
- X. Liu, R. Hu, Z. Gao and N. Shao, Langmuir, 2015, 31, 5859–5867 CrossRef CAS PubMed.
- E. Shaviv, O. Schubert, M. Alves-Santos, G. Goldoni, R. D. Felice, F. Vallée, N. Fatti, U. Banin and C. Sönnichsen, ACS Nano, 2011, 5, 4712–4719 CrossRef CAS PubMed.
- J. Xu, Z. Song, Y. Fang, J. Mei, L. Jia, A. J. Qin, J. Z. Sun, J. Ji and B. Z. Tang, Analyst, 2010, 135, 3002–3007 RSC.
- Z. K. Wu, Angew. Chem., Int. Ed., 2012, 51, 2934–2938 CrossRef CAS PubMed.
- U. S. EPA, EPA-452/R-05-003, U. S. Government Printing Office, Washington, DC, 2005 Search PubMed.
- W. Chansuvarn and A. Imyim, Microchim. Acta, 2012, 176, 57–64 CrossRef CAS.
- G. Liang, L. Wang, H. Zhang, Z. Han and X. Wu, Microchim. Acta, 2012, 179, 345–350 CrossRef CAS.
- R. Z. Wang, D. L. Zhou, H. Huang, M. Zhang, J. J. Feng and A. J. Wang, Microchim. Acta, 2013, 180, 1287–1293 CrossRef CAS.
- C. Chiang, C. Huang, C. Liu and H. Chang, Anal. Chem., 2008, 80, 3716–3721 CrossRef CAS PubMed.
- H. Park, S. Hwang and K. Kim, Electrochem. Commun., 2012, 24, 100–103 CrossRef CAS.
Footnote |
| † Electronic supplementary information (ESI) available. See DOI: 10.1039/c7ra11566k |
| This journal is © The Royal Society of Chemistry 2017 |


