 Open Access Article
Facile synthesis of Pt nanoparticles supported on anatase TiO2 nanotubes with good photo-electrocatalysis performance for methanol†
Jianbo Zhang‡
abc,
Nan Su‡abc,
Xiulan Hu *abc,
Faquan Zhuabc,
Yawei Yuabc and
Hui Yangabc
aCollege of Materials Science and Engineering, Nanjing Tech University, Xin-Mo-Fan Road No. 5, 210009, Nanjing, Jiangsu, China. E-mail: whoxiulan@163.com; Tel: +86 152 4022 7230
bThe Synergetic Innovation Center for Advanced Materials, Xin-Mo-Fan Road No. 5, 210009, Nanjing, Jiangsu, China
cJiangsu National Synergetic Innovation Center for Advanced Materials (SICAM), Xin-Mo-Fan Road No. 5, 210009, Nanjing, Jiangsu, China
First published on 13th December 2017
Abstract
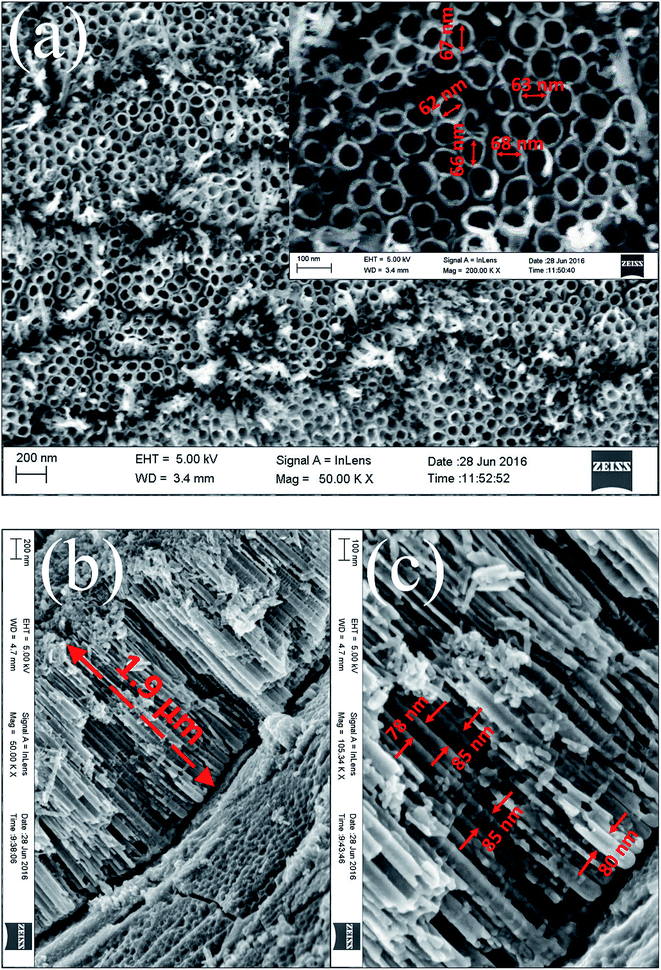
A simple, high-yield and rinsing-free method is used in this work to prepare Pt nanoparticles with a size of approximately 2 nm, which are successfully supported on free-standing TiO2 nanotubes (TNTs) synthesized by a simple two-step anodization method with titanium metal foil. Field-emission scanning electron microscopy images indicate that in the case of 30 V for 90 min, the inner diameter of as-synthesized TNTs is 60–70 nm and the length is approximately 1.9 μm. Electrochemical experimental results clarify that the Pt/TNTs/C catalyst has higher electrochemically active specific surface areas and better catalytic activity toward methanol electro-oxidation compared with the Pt/C and Pt/TNTs catalysts. What's more important, catalytic activity of Pt/TNTs/C is drastically enhanced under light illumination, with the mass activity of 525.0 mA mgPt−1, 1.47 times higher than that in the dark (357.4 mA mgPt−1). The improved activity is mainly derived from the synergistic effects between the electro-catalysis on Pt nanoparticles and the photo-catalysis of TiO2 nanotubes. In this work, the improved photo-electrocatalysis performance of the Pt/TNTs/C catalyst is further analyzed and the findings here are of significance in providing a new strategy to fabricate Pt-based photo-electro catalysts for the methanol oxidation reaction.
1. Introduction
Direct methanol fuel cells (DMFCs) have attracted much attention as power sources for portable devices and fuel-cell vehicles due to their good power efficiency, low operation temperature, and easy transportation and storage of methanol compared with H2 gas fuel cells.1 Pt-based catalysts supported on carbons play a significantly important role in catalyzing methanol oxidation reaction (MOR).2 However, there are still a lot of challenges facing the wide commercialization of the applications of Pt-based catalysts, such as high cost, low catalytic efficiency and poisoning effect.3–5 Recently, various kinds of electrocatalysts were developed to enhance the MOR performance, among which, metal oxides promoted Pt-based catalysts have been considered to be quite active. It was reported that the involvement of metal oxides (such as TiO2,6–14 ZnO,15–17 SnO2,18–22 WO3,1,23–26 Fe2O3 (ref. 27–29) and Co3O4,30,31 etc.) can result in higher catalytic activities and stabilities of Pt-based catalysts during the MOR process. Due to the abundant –OH species adsorbed on the metal oxides and the strong support-metal interaction, these oxides can mitigate the poisoning of Pt catalysts by CO-like intermediate species during the MOR process and further enhance the MOR activity.The photoresponsive semiconductor metal oxides, among these oxides mentioned above, are of great interests.15,16,21,23,26,29,32–44 The anodic catalysts incorporating photoresponsive semiconductor evidently improve MOR peak current density in the presence of UV irradiation compared with those traditional Pt catalysts. Hybrid TiO2/CF/Pt–Ru catalyst (CF, carbon fiber) for methanol electro-oxidation was developed to boost the performance of DMFCs in the presence of UV.32 The atomic layer deposition (ALD), a kind of in situ synthesis method which can cause strong interface interaction, was used to combine the ZnO nanorods with Pt nanoparticles on the carbon cloth. And the Pt@ZnO/C electrode exhibited 90% higher methanol oxidation activity than commercial Pt catalysts.15 Especially, the graphene nanosheets (GNs) or reduced graphene oxide (RGO) were considered as effective materials to extend light adsorption range and enhance photoresponsive effect of these semiconductor metal oxides by the formation of graphene-semiconductor nanostructure.16,21,37,38,40,45 But the increasing activity of the catalysts is at the expense of the cumbersome and risky synthesis process and high cost of graphene materials, which might be relatively unfavourable in the application.
It was reported that anodization of titanium metal foil to synthesis TiO2 nanotubes is a simple way to obtain a high yield of products with vertical orientation arranged nanotube arrays. Nanostructured TiO2 has great applicative potential in photo-electrochemical devices46–51 due to the large effective light-harvesting interface area and wide band gap. As is known to all, the TiO2 is a kind of excellent photoresponsive material. What's more, the nanotube-like TiO2 materials with larger specific surface area and abundant surface oxygen locus to generate –OH species were of great hot topics of photo-electrocatalyst. In this paper, TiO2 nanotubes were chosen as the support material of Pt nanoparticles, in order to enhance their MOR activity under the light illumination.
Noble metal nanoparticles are widely used as electrocatalysts and photocatalysts, and recent years of intense efforts have seen an increasing interest in heterogeneous nanocomposites, which usually exhibit enhanced catalytic properties due to the synergistic effect among their different domains.52 The heterogeneously structured nanomaterials usually exhibit enhanced catalytic properties in comparison with each one of the constituent materials due to the synergistic effect among their different domains.53
In this present work, the free-standing TiO2 nanotubes were synthesized by a simple two-step anodization method with titanium metal foils and NH4F in ethylene glycol. A simple, high-yield and rinsing-free method, preparation of Pt nanoparticles with plasma sputtering in water,54–58 was used. The electrochemical results indicated that TiO2 nanotubes supporting Pt catalysts (Pt/C/TNTs) expressed a promoted activity toward methanol electro-oxidation under light illumination.
2. Experimental
2.1 Preparation of TiO2 nanotubes
A two-step anodization method59 was used in this work to prepare well-organized free-standing TiO2 nanotubes (Fig. S1a†). Prior to carrying out anodization, Ti foils (2 × 3 × 0.05 cm) were degreased by ultrasonic treatment in acetone, ethanol and deionized water for 15 min, respectively, and then dried at 60 °C in air. Anodization was carried out in a two-electrode system with a counter of stainless steel sheet. 0.5 wt% NH4F (Sinopharm Chemical Reagent Co., Ltd) in ethylene glycol (Sinopharm Chemical Reagent Co., Ltd) with 3 vol% H2O was used as electrolyte for anodization. The first step of anodization on Ti foils was conducted under 30 V for 90 min. After anodization, samples were washed with deionized water and dried at 60 °C in air, then annealed at 450 °C for 2 h in air atmosphere and cooled slowly together with the furnace to room temperature. The second step of anodization on the annealed Ti foils was carried out under 30 V for 30 min in the same electrolyte, in order to obtain free-standing TiO2 nanotube membrane. After the second-step anodization, the TiO2 nanotube membrane detached from the Ti foil was treated with an ultrasonic bath for 5 min. Subsequently the free-standing TNTs were cleaned with centrifugation for three times to remove the residual ethylene glycol and NH4F, and then dried at 60 °C in air. Therefore, the as-obtained TiO2 nanotubes powder was defined as TNTs.2.2 Synthesis of Pt nanoparticles
The method, synthesis of Pt nanoparticles by plasma sputtering in water, was similar to our previous works.55–57,60 Fig. S1b† shows the experiment setup for this method. Generally speaking, the Pt metal wires (Φ = 1.0 mm) were served as opposite electrodes, and immersed into deionized water. The gap between two opposite electrodes was kept at about 0.3 mm. Discharge was generated using a high voltage pulsed DC power supply (repetition frequency: 10–20 kHz, pulse width: 1–2 μs, Kurita Co. Ltd., Japan). The water gradually changed from being colorless to dark grey with increasing discharge time. The yields of Pt nanoparticle can be controlled by adjusting the discharge time in this study. The as-synthesized Pt nanoparticles were well-dispersed in water.2.3 Preparation of Pt/TNTs/C catalyst
The Pt-based catalysts were prepared by step-wise mechanical mixing process in deionized water. Firstly, 16 mg TNTs were put into the suspension containing 8 mg Pt nanoparticles with ultrasonic dispersion for 90 min to obtain homogeneous suspension of Pt/TNTs mixture. Secondly, a well-dispersed XC-72 suspension was put into the homogeneous suspension of Pt/TNTs mixture with stirring vigorously for 30 min and subsequently treated with ultrasound bath for 60 min to obtain homogeneous suspension of Pt/TNTs/C mixture. Then this mixture was dried at 45 °C in air to obtain Pt/TNTs/C composite. The mass ratio of Pt nanoparticles, TNTs and XC-72 carbon was fixed to 1![[thin space (1/6-em)]](https://www.rsc.org/images/entities/char_2009.gif) :
:![[thin space (1/6-em)]](https://www.rsc.org/images/entities/char_2009.gif) 2
2![[thin space (1/6-em)]](https://www.rsc.org/images/entities/char_2009.gif) :
:![[thin space (1/6-em)]](https://www.rsc.org/images/entities/char_2009.gif) 4 (Pt loading of 14.3 wt%). And the Pt/TNTs and Pt/C composites with the Pt loading of 20 wt% were prepared as the same procedure mentioned above.
4 (Pt loading of 14.3 wt%). And the Pt/TNTs and Pt/C composites with the Pt loading of 20 wt% were prepared as the same procedure mentioned above.
2.4 Characterization
The X-ray diffraction (XRD) measurements were carried out by a Rigaka Smartlab system with Cu Kα (λ = 1.5418 Å) radiation operated at 30 kV and 40 mA to evaluated the crystal phase and the scanning rate of measurements was 8° min−1. The morphology and structure of samples were studied by a field-emission scanning electron microscopy (FE-SEM, ZEISS Ultra 55) and a transmission electron microscopy (TEM, JEOL JEM-2100F). X-ray photoelectron spectroscopy (XPS, Kratos AXIS ULTR DLD) with an Al X-ray source was carried out to detect the surface properties of the samples.2.5 Electro- and photo-electrochemical measurements
6 mg Pt/TNTs/C composite was ultrasonically dispersed in 2 mL deionized water containing 20 μL Nafion® solution (5 wt%, DuPont, USA) for at least 30 min to form a homogeneous catalyst ink. The Pt/TNTs and Pt/C catalysts ink were also prepared with 4.3 mg composites and 2 mL deionized water containing 20 μL Nafion® solution. Electrochemical measurements were carried out in a three-electrode electrochemical cell at 25 °C. A piece of Pt foil (1 cm2) and an Ag/AgCl electrode (3.5 mol dm−3 KCl, 0.205 V relative to standard hydrogen electrode, SHE) were used as the counter and reference electrodes, respectively. The working electrode was prepared as follows. A glassy carbon electrode (GCE, Φ = 3 mm, geometrical area of 0.07 cm2) which was polished with 0.03 μm alumina suspensions to a mirror surface was served as an underlying substrate for the working electrode. 6 μL of three kinds of catalyst inks was pipetted onto the GCE, respectively. The loading of Pt on the GCE was 2.57 μg. A solution of 0.5 mol dm−3 H2SO4 purged with nitrogen gas for 40 min to remove dissolved oxygen served as the electrolyte for cyclic voltammetry (CV) measurements. The CV measurements were carried out in the solution of 0.5 mol dm−3 H2SO4 (N2 saturated) within a potential range of −0.2 to 1.2 V at 50 mV s−1. The electro- and photo-electrocatalytic oxidization of methanol was monitored with CV measurements in a solution of 0.5 mol dm−3 H2SO4 containing 1 mol dm−3 CH3OH within the potential range of 0–1.0 V. Chronoamperometry (CA) was carried out in 0.5 mol dm−3 H2SO4 containing 1.0 mol dm−3 CH3OH at 0.6 V. A 50 W Xe lamp (PLS-SXE300UV, Peking Perfectlight Co., China, wave length ≥ 200 nm) was used in the test of photo-electrocatalytic oxidization of methanol. The distance between illuminant with working electrode was kept at approximately 15 cm. The catalysts supported on GCEs were pre-conditioned by CV within the potential range of −0.2 to 1.2 V at 10 mV s−1 for 8 full potential cycles in 0.5 mol dm−3 H2SO4 (N2 saturated). The all potentials in the present work were expressed versus Ag/AgCl (3.5 mol dm−3 KCl). All the electro- and photo-electrochemical measurements were performed on a Zahner Zennium (ZAHNER-Elektrik GmbH & Co. KG, Germany) electrochemical workstation at room temperature.3. Results and discussion
3.1 Characterization
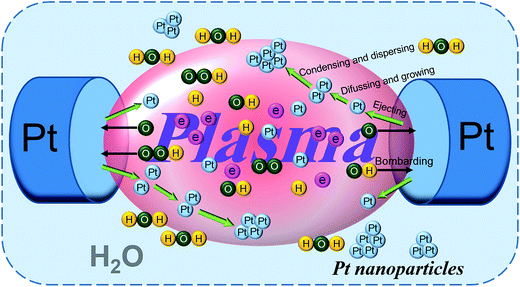
Based on the results of our previous work,55 the formation mechanism of Pt nanoparticles is shown in Fig. 1, indicated by in situ light emission spectra, via solution plasma sputtering. Briefly, Pt atoms were ejected into the plasma region from their electrodes by the bombardment of highly energetic electrons and radical particles (such as ˙OH, ˙H, O, O2−, and HO2). Since the surfaces of Pt electrodes pair were bombarded continuously, Pt nanoparticles were formed in water by diffusion, growth, and condensation. And the size of as-prepared Pt nanoparticles is approximately 2–5 nm, on the basis of our previous TEM measurements.55,61Fig. S2† shows the XRD patterns of two Ti foils, which were directly obtained after the first anodization step and obtained after annealing process, respectively. For both patterns (a) and (b) in Fig. S2,† the peaks at 35.1°, 38.4°, 40.1°, 53.0°, 62.9°, 70.6°, 76.1° and 77.4° can be assigned to the (100), (002), (101), (102), (110), (103), (112) and (201) planes of Ti metal (JCPDS card no. 85-2959), respectively. For the pattern (b) only, the peaks at 25.3°, 37.8°, 48.1°, 53.8°, 55.0° and 68.7° are corresponding to the (101), (004), (200), (105), (211), (116) planes of anatase TiO2 (JCPDS no. 84-1285), respectively. While no significant diffraction peaks of TiO2 were detected in the pattern (a) except for the peaks of Ti metal. These results clarified only amorphous TiO2 was formed after the first-step anodization. Crystalline anatase TiO2 was formed after annealing at 450 °C for 2 h.59 These sharp characteristic peaks of anatase TiO2 further indicated their good crystallinity.
Fig. 2 shows the SEM images of the top view and cross section of as-synthesized TNTs on Ti foil before detaching by the second-step anodization. From the top view in Fig. 2a, the TNTs is highly self-organized and with the inner diameter of 60–70 nm (the inset of Fig. 2a). The gaps between the individual tubes are formed and nanotubes are incompact and well-arranged. The aligned TNTs length shown in Fig. 2b is approximately 1.9 μm (Fig. 2b) and the external diameter of TNTs is 78–85 nm (Fig. 2c).
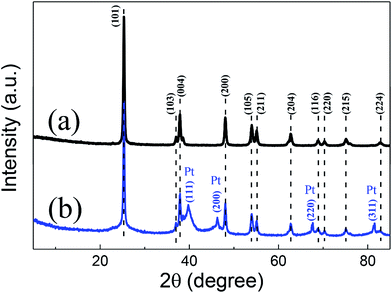
After the second anodization step, the as-prepared TNTs membrane detached from the Ti foil substrate. Fig. 3 exhibits the XRD patterns of the TNTs powder and the Pt/TNTs composite. For these two samples, the peaks at 25.3°, 37.0°, 37.8°, 48.0°, 53.8°, 55.0°, 62.7°, 68.8°, 70.3°, 75.0° and 82.7° are corresponding to the JCPDS card no. 99-0008 of anatase TiO2. In pattern (b), four relatively weaker diffraction peaks (2θ = 39.8°, 46.2°, 67.5° and 81.3°) were detected. These results agreed extremely well with those of the JCPDS card no. 65-2868 for Pt, demonstrating that the black products formed during solution plasma sputtering are definitely Pt metal particles. And these broaden diffraction peaks imply the relatively smaller size of Pt particles.
Fig. S3† shows the TEM images of the as-obtained TNTs. It can be clearly seen from the typical TEM image in Fig. S3a† that the TiO2 sample synthesized by anodization has an obvious tubular appearance. In the middle part of a single TNT (Fig. S3b†), the regular crystal lattice fringes can be clearly detected. And in the inset of Fig. S3b,† it can be found that the lattice plane spacing is 0.35 nm, which is highly consistent with the (101) plane of the anatase TiO2. From the edge part of the TNT in Fig. S3c,† the disordered structure with the lattice of different orientations can be clearly observed. Furthermore, the corresponding selected area electron diffraction (SAED) analysis in the inset of Fig. S3c† indicates the different orientations of TiO2 crystals in this edge part, as well. The disordered small-particle-like morphology can be further obviously observed at a broken tip of a single TNT in Fig. S3d,† which could be advantageous to store electrolyte, providing a quick supply and short diffusion distance to accelerate the electrocatalytic kinetics.
The morphology of the Pt/TNTs composite was further determined by TEM in Fig. 4. From the bright field TEM image in Fig. 4a, the Pt nanoparticles are arranged in line on the surface of TNT, while the Pt nanoparticles with the size of 2 nm could be well-dispersed on the surface of XC-72 carbon without aggregation.55 Sui et al. have also reported this phenomenon that the Pt nanoparticles would tend to be arranged in line on the TNTs' surface.10 In Fig. 4b, it can be distinctly observed that the arrangement of Pt nanoparticles on TNTs' surface presents an extension trend from the surface to outward. Furthermore, from the HR-TEM image in Fig. 4c, the Pt nanoparticles on TNTs' surface with a size range of 2–5 nm present the different lattice orientations of the (111) plane with the lattice plane spacing of 0.226 nm. It could be assumed that these Pt nanoparticles in line on TNTs' surface would exhibit outstanding catalytic ability, but it should be further proved by electrochemical measurements.
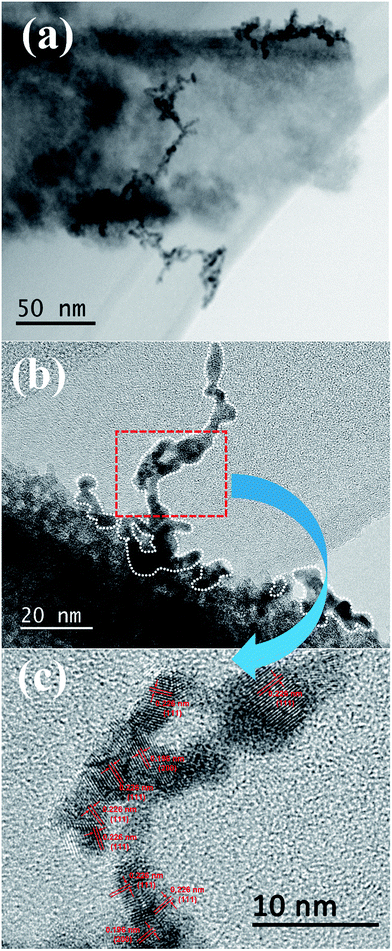 | ||
| Fig. 4 TEM images of the Pt/TNTs composite. (a) Bright field TEM image of Pt/TNTs composite; (b) typical TEM image of the Pt nanostructure on TNT's surface; (c) HR-TEM image of the Pt nanoparticles. | ||
XPS is an efficient method to analyze the chemical state information of elements. The XPS spectra of Pt/C and Pt/TNTs/C are shown in Fig. S4.† Fig. S4a† compares the wide XPS surveys for the Pt/C and Pt/TNTs/C composites. The peaks of C 1s and O 1s can be found at 284.4 eV and 532.4 eV, respectively. The Ti element is clearly detected in the Pt/TNTs/C sample. Furthermore, the peak at approximately 71.3 eV and the paired peaks at 315.5 eV & 331.8 eV are corresponded to the Pt 4f and Pt 4d, respectively. In the comparison with Pt/C, the distinctly enhanced Pt signal of Pt/TNTs/C was detected, and the surface Pt to C mass ratios calculated from XPS spectrum for the Pt/C and Pt/TNTs/C samples are 0.09 and 0.183, respectively, indicating that the addition of TNTs causes the Pt nanoparticles to be distributed more uniformly on the surface of supporting materials. As depicted in Fig. S4b,† the binding energies of Pt 4f for the Pt/C and Pt/TNTs/C samples are 71.4 eV & 71.55 eV (Pt 4f7/2) and 74.7 eV & 74.9 eV (Pt 4f5/2), respectively. Compared with the binding energies of Pt 4f for Pt/C, the values for Pt/TNTs/C present a slightly positive shift, on account of the relatively strong interaction between Pt and TNTs. And according to the spectra of Pt 4f, the intensity of Pt 4f peak for Pt/TNTs/C is definitely stronger than the value of Pt/C, which is in agreement with the observation of wide survey. The Ti 2p XPS spectra of the Pt/TNTs/C sample is shown in Fig. S4c.† The two peaks at 459.6 eV and 465.3 eV can be assigned to Ti 2p3/2 and Ti 2p1/2, respectively. The peak separation between Ti 2p3/2 and Ti 2p1/2 lines is 5.7 eV, which is consistent with the +4 oxidation state of Ti.62
3.2 Electro- and photo-electrochemical measurements
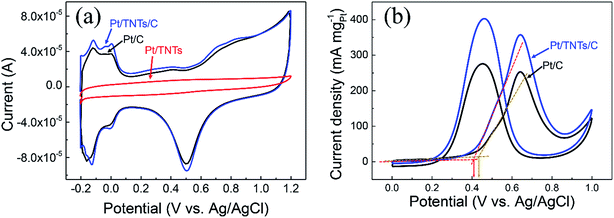
CVs for the Pt/C, Pt/TNTs and Pt/TNTs/C samples were carried out in 0.5 mol dm−3 H2SO4 and the results are shown in Fig. 5. All the curves in Fig. 5a, except the sample of Pt/TNTs, present the typical hydrogen adsorption–desorption peaks (within the potential range from −0.2 V to 0.1 V) and reduction peaks for platinum oxide (within the potential range from 0.3 V to 0.7 V). Electrochemically active specific surface areas (ECSA) of Pt-based catalysts are obtained with the measurements of the hydrogen adsorption–desorption (HAD) integrals. The ECSA of as-prepared catalysts can be easily calculated via the equation below with coulombic charges accumulated during HAD after correcting for the double-layer charging current from the CVs:
 | (1) |
Fig. 5b shows the catalytic activity toward methanol electro-oxidation of the Pt/C and Pt/TNTs/C catalysts with CVs in a solution of 0.5 mol dm−3 H2SO4 containing 1.0 mol dm−3 CH3OH. The CV curves of the Pt-based catalysts for methanol electro-oxidation basically includes two anodic peaks, the forward peak and backward peak. The forward peak current density (normalized by the loading of Pt metal) defined as the mass activity that is normally used to evaluate the catalytic activity. It can be seen that the value for Pt/TNTs/C is 357.4 mA mgPt−1, 1.4 times higher than the value of Pt/C (252.8 mA mgPt−1), suggesting that the catalytic activity of the Pt/TNTs/C catalyst is much better than that of Pt/C catalysts. What is noteworthy is that this relatively lower ECSA increase (1.27 times) causes a larger increase of mass activity for methanol electro-oxidation (1.4 times). And it can be easily found that the onset oxidation potential of forward anodic peak presents a slightly negative shift with the addition of TNTs indicating that the MOR is easier to perform on the Pt/TNTs/C than on the Pt/C catalysts. These two phenomena imply the metal-support electronic interaction and bifunctional effect between Pt nanoparticles and TNTs, which is in agreement with the observation in XPS measurements.
From the all above, the enhanced catalytic performance of the Pt/TNTs/C catalysts may result from the following factors. Firstly, this Pt/TNTs/C catalyst has more electrochemical active sites than Pt/C catalyst, as evidenced by the larger ECSA of the former catalyst.12 Secondly, the relatively strong metal-support interaction between Pt and TNTs support, as evidenced by the positively shifted binding energies of Pt 4f in Pt/TNTs/C catalyst, could result in lower bonding strength between Pt and CO-like species and thus enhance MOR activity on Pt surface.14 Third, TiO2 can supply the rich active –OH species, which are able to remove the CO-like intermediate species adsorbed on Pt surface and thus enhance the MOR kinetics through the bifunctional mechanism.63
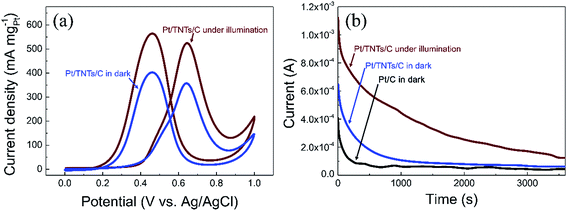
Given the fact that TiO2 is an effective photo-responsive semiconductor with a wide band gap of 3.0–3.2 eV, the light illumination effects on Pt/TNTs/C toward methanol electro-oxidation were also investigated in this work. Fig. 6a shows that the mass activity toward methanol electro-oxidation of the Pt/TNTs/C catalyst increase drastically under light illumination. The Pt/TNTs/C catalyst exhibits remarkably enhanced mass activity of 525.0 mA mgPt−1 under light illumination, 1.47 times higher than the value of the same catalyst and 2.07 times higher than the value of Pt/C catalyst in dark, suggesting that the Pt/TNTs/C exhibits higher catalytic activity toward MOR under light illumination. CA measurements on the Pt/C and Pt/TNTs/C catalysts at 0.6 V in a solution of 0.5 mol dm−3 H2SO4 containing 1.0 mol dm−3 CH3OH were also carried out to further evaluate the light illumination effects for MOR. The corresponding CA curves are shown in Fig. 6b. The current of all the catalysts decay rapidly during the earlier minutes due to the accumulation of CO-like intermediate poisonous species. As shown in Fig. 6b, the current declining rate of decay section for the Pt/TNTs/C catalyst under light illumination is the smallest among these three curves, which indicates that Pt/TNTs/C under light illumination shows the best tolerance performance toward CO-like intermediate poisonous species. It is noteworthy that, without light illumination, the Pt/TNTs/C also possesses a relatively slower current declining rate than Pt/C during the earlier minutes, demonstrating that Pt/TNTs/C has better electro-catalytic stability toward MOR and enhanced tolerance performance toward CO-like species in dark compared with the Pt/C catalyst, which agrees well with the analysis of CVs curves in Fig. 5b.
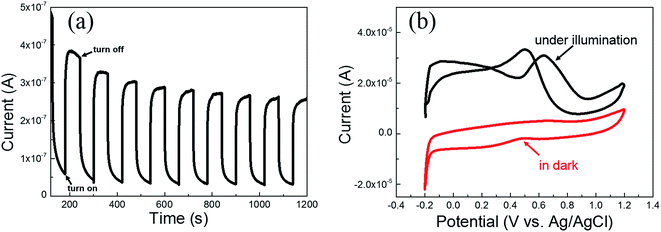
For the sake of figuring out the reasons for the improvement of methanol electro-oxidation performance of the Pt/TNTs/C catalyst under light illumination, CA measurement was carried out on bare TNTs sample, and CV measurements were also carried out on Pt/TNTs catalyst without any carbon materials. CA curve measured on the TNTs sample at 0.6 V by turning the light on/off in 0.5 mol dm−3 H2SO4 is shown in Fig. 7a. As we all know, TiO2 is a type of corrosion-proof oxides which could stably exist in dilute sulfuric acid. The observed current under light illumination in CA measurement on TNTs could be attributed to the double layer charging current and the photo-generated current, as the current increased sharply when the light was turned on and dived when the light was turned off. It can be found that the average photo-generated current density is approximately 0.3 μA, which is extremely smaller compared with the current of methanol electro-oxidation. Fig. 7b shows the CV curves measured on the Pt/TNTs catalyst under light illumination and in dark in 0.5 mol dm−3 H2SO4 containing 1.0 mol dm−3 CH3OH at 50 mV s−1. The background current of these two CV curves exhibit extremely larger difference because of light illumination. With the existence of the Pt nanoparticles on the TNTs, the photo-generated electron/hole (e−/h+) pairs can be split apart more efficiently, which can increase the photo-generated current. Anyhow, according to the observations described above, the increase of mass activity of the Pt/TNTs/C catalyst under light illumination (Fig. 6a) is partly resulted from the photo-generated current which caused by the TNTs under light illumination. From the CV curve of Pt/TNTs catalyst in dark in Fig. 7b, it can be clearly detected that there is neither evident forward peak nor backward peak, which can be attributed to the low electrical conductivity of the as-synthesized TiO2 sample. However, under light illumination, the CV curve of the Pt/TNTs catalyst shows two characteristic anodic peaks of methanol electro-oxidation, which could be attributed to the improvement of conductivity of TNTs caused by optical excitation and positive applied bias on Pt/TNTs catalyst.29
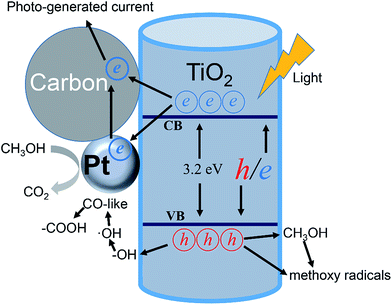
To sum up the analysis of photo-electrochemical measurements, the improvement in the methanol electro-oxidation performance under light illumination can be partly attributed to the photo-generated current caused by TNTs support. Furthermore, it is supposed that the enhancement of methanol electro-oxidation performance depends greatly on the improvement in charge transport properties within the catalyst under light illumination. The photo-induced improvements that occur at the Pt/TNTs/C interface are illustrated in Fig. 8. Firstly, as TiO2 is a kind of n-type semiconductor, under light illumination, the Fermi level would move to assisting charge separation with a interaction of Pt nanoparticles and a positive applied bias,64 which causes a greater fraction of the photon generated e−/h+ pairs participate in surface redox chemical reaction. This effect can as well translate into an improvement in the conductivity of catalyst and further enhance the charge transfer while decreasing carrier recombination. Secondly, it is known to all that the Pt-based catalysts would be poisoned easily by CO-like intermediate products (such as CO and COH) during the methanol electro-oxidation process. Under light illumination, the photo-generated h+s can migrate to the surface of TiO2 and participate in redox reactions, transforming the adsorbed –OH species to ˙OH radicals65 that can easily transform the CO-like species on Pt surface to –COOH species.29 Therefore the methanol electro-oxidation performance of the Pt/TNTs/C catalyst would increase a lot under light illumination. What's more, the methanol not only acts as a sacrificial electron donor to scavenge the h+s but also can promote the formation of methoxy radicals, which could further inject electrons to increase the current, known as the “current doubling effect”.15 The photocatalytic oxidation of methanol if adopted in a fuel cell should provide a good additive effect to boost the current generation. Thirdly, the as-prepared TNTs' surface is disordered and the electrolyte would be stored in the lacunes between these disordered structures, which provides a quick supply and short diffusion distance to accelerate the electrocatalytic activity. Generally speaking, it is reasonable that the enhancement of methanol electro-oxidation performance by TNTs support with disordered surface.
4. Conclusion
In summary, Pt nanoparticles with the particle size of ca. 3 nm were successfully prepared by plasma sputtering in water in this work, which is a simple, high-yield and rinsing-free method. And the well-organized free-standing TiO2 nanotubes with the inner diameter of 60–70 nm were synthesized by a simple two-step anodization method with titanium metal foil. The lining-arranged Pt nanoparticles on TNTs' surface, the strong metal-support interaction between Pt and TiO2, the disordered surface structure of TNTs and the higher ECSA of Pt/TNTs/C result in a much higher catalytic activity and stability toward methanol electro-oxidation. What's more, the synergistic effects of photo-assisted electro-catalysis toward methanol electro-oxidation are realized successfully under light illumination, drastically improving the catalytic performance on Pt/TNTs/C for methanol oxidation. To sum up the analysis of photo-electrocatalysis performance, the improvement in the conductivity of catalyst, the alleviating COads poisoning role of the photo-generated h+s and the photo-generated current from TiO2 cause the drastic improvement of activity toward methanol electro-oxidation under light illumination. The finding here will be of significance in attaining basic knowledge of photo-assisted electrocatalysis and provides a new strategy to fabricate photo-electro Pt-based catalysts for DMFCs anodic reaction.Conflicts of interest
There are no conflicts to declare.Acknowledgements
This work was supported by the National Natural Science Foundation of China (Grant No. 51372113), Jiangsu National Synergetic Innovation Center for Advanced Materials (SICAM), Program for New Century Excellent Talents in University (NCET-12-0733, China), the scientific research foundation for Returned Overseas Students, and Project Funded by the Priority Academic Program Development of Jiangsu Higher Education Institutions (PAPD).References
- X. He, C. Hu, Q. Yi, X. Wang, H. Hua and X. Li, J. Electrochem. Soc., 2013, 160, F566–F572 CrossRef CAS.
- N. Kakati, J. Maiti, S. H. Lee, S. H. Jee, B. Viswanathan and Y. S. Yoon, Chem. Rev., 2014, 114, 12397–12429 CrossRef CAS PubMed.
- N. S. Veizaga, V. I. Rodriguez, T. A. Rocha, M. Bruno, O. A. Scelza, S. R. de Miguel and E. R. Gonzalez, J. Electrochem. Soc., 2015, 162, F243–F249 CrossRef CAS.
- D. Sebastián, A. Stassi, S. Siracusano, C. L. Vecchio, A. S. Aricò and V. Baglio, J. Electrochem. Soc., 2015, 162, F713–F717 CrossRef.
- P. P. Patel, M. K. Datta, P. H. Jampani, D. Hong, J. A. Poston, A. Manivannan and P. N. Kumta, J. Power Sources, 2015, 293, 437–446 CrossRef CAS.
- M. Wang, D. J. Guo and H. L. Li, J. Solid State Chem., 2005, 178, 1996–2000 CrossRef CAS.
- Y. Y. Song, Z. D. Gao and P. Schmuki, Electrochem. Commun., 2011, 13, 290–293 CrossRef CAS.
- C. B. Xu, M. Q. Shi, L. Z. Kang and C. A. Ma, Mater. Lett., 2013, 91, 183–186 CrossRef CAS.
- C. L. Cao, C. G. Hu, J. Tian, W. D. Shen, S. X. Wang and H. Liu, J. Electrochem. Soc., 2013, 160, H793–H799 CrossRef CAS.
- X. L. Sui, Z. B. Wang, M. Yang, L. Huo, D. M. Gu and G. P. Yin, J. Power Sources, 2014, 255, 43–51 CrossRef CAS.
- Y. J. Wang, D. P. Wilkinson, V. Neburchilov, C. J. Song, A. Guest and J. J. Zhang, J. Mater. Chem. A, 2014, 2, 12681–12685 CAS.
- Y. H. Qin, Y. F. Li, R. L. Lv, T. L. Wang, W. G. Wang and C. W. Wang, J. Power Sources, 2015, 278, 639–644 CrossRef CAS.
- X. L. Sui, Z. B. Wang, Y. F. Xia, M. Yang, L. Zhao and D. M. Gu, RSC Adv., 2015, 5, 35518–35523 RSC.
- L. Zhao, Z. B. Wang, J. Liu, J. J. Zhang, X. L. Sui, L. M. Zhang and D. M. Gu, J. Power Sources, 2015, 279, 210–217 CrossRef CAS.
- C. Y. Su, Y. C. Hsueh, C. C. Kei, C. T. Lin and T. P. Perng, J. Phys. Chem. C, 2013, 117, 11610–11618 CAS.
- Z. S. Li, L. T. Ye, F. L. Lei, Y. L. Wang, S. H. Xu and S. Lin, Electrochim. Acta, 2016, 188, 450–460 CrossRef CAS.
- L. N. Gao, L. Ding and L. Z. Fan, Electrochim. Acta, 2013, 106, 159–164 CrossRef CAS.
- H. L. Zhang, C. G. Hu, C. L. Zhang, K. Y. Zhang, M. J. Wang, Y. Ding and Y. Lin, J. Electrochem. Soc., 2015, 162, F92–F97 CrossRef CAS.
- H. J. Wang, X. H. Wang, J. D. Zheng, F. Peng and H. Yu, J. Nanosci. Nanotechnol., 2015, 15, 3662–3669 CrossRef CAS PubMed.
- G. P. Lu, X. B. Ma, H. F. Yang, D. S. Kong and Y. Y. Feng, Int. J. Hydrogen Energy, 2015, 40, 5889–5896 CrossRef CAS.
- F. L. Lei, Z. S. Li, L. T. Ye, Y. L. Wang and S. Lin, Int. J. Hydrogen Energy, 2016, 41, 255–264 CrossRef CAS.
- M. Huang, W. Wu, C. Wu and L. Guan, J. Mater. Chem. A, 2015, 3, 4777–4781 CAS.
- C. Q. Wang, F. X. Jiang, R. Zhou, Y. K. Du, P. Yang, C. Y. Wang and J. K. Xu, Mater. Res. Bull., 2013, 48, 1099–1104 CrossRef CAS.
- J. Georgieva, S. Sotiropoulos, E. Valova, S. Armyanov and N. Karanasios, J. Electroanal. Chem., 2014, 727, 135–140 CrossRef CAS.
- H. J. Wang, X. H. Wang, J. D. Zheng, F. Peng and H. Yu, Chin. J. Catal., 2014, 35, 1687–1694 CrossRef CAS.
- T. Wang, J. Tang, S. C. Wu, X. L. Fan and J. P. He, J. Power Sources, 2014, 248, 510–516 CrossRef CAS.
- Y. T. Liu, Q. B. Yuan, D. H. Duan, Z. L. Zhang, X. G. Hao, G. Q. Wei and S. B. Liu, J. Power Sources, 2013, 243, 622–629 CrossRef CAS.
- S. J. Hoseini, M. Bahrami and M. Roushani, RSC Adv., 2014, 4, 46992–46999 RSC.
- S. Kang and P. K. Shen, Electrochim. Acta, 2015, 168, 104–110 CrossRef CAS.
- H. An, G. H. An and H. J. Ahn, J. Alloys Compd., 2015, 645, 317–321 CrossRef CAS.
- M. J. Han, M. W. Li, X. Wu, J. H. Zeng and S. J. Liao, Electrochim. Acta, 2015, 154, 266–272 CrossRef CAS.
- K. Drew, G. Girishkumar, K. Vinodgopal and P. V. Kamat, J. Phys. Chem. B, 2005, 109, 11851–11857 CrossRef CAS PubMed.
- D. V. Arulmani, J. I. Eastcott, S. G. Mavilla and E. B. Easton, J. Power Sources, 2014, 247, 890–895 CrossRef CAS.
- A. Leelavathi, G. Madras and N. Ravishankar, J. Am. Chem. Soc., 2014, 136, 14445–14455 CrossRef CAS PubMed.
- J. Liu, B. Liu, Z. Y. Ni, Y. D. Deng, C. Zhong and W. B. Hu, Electrochim. Acta, 2014, 150, 146–150 CrossRef CAS.
- N. Mojumder, S. Sarker, S. A. Abbas, Z. Tian and V. Subramanian, ACS Appl. Mater. Interfaces, 2014, 6, 5585–5594 CAS.
- C. Q. Wang, F. X. Jiang, R. R. Yue, H. W. Wang and Y. K. Du, J. Solid State Electrochem., 2014, 18, 515–522 CrossRef CAS.
- C. Q. Wang, R. R. Yue, H. W. Wang, C. Zou, J. Du, F. X. Jiang, Y. K. Du, P. Yang and C. Y. Wang, Int. J. Hydrogen Energy, 2014, 39, 5764–5771 CrossRef CAS.
- L. T. Ye, Z. S. Li, L. Zhang, F. L. Lei and S. Lin, J. Colloid Interface Sci., 2014, 433, 156–162 CrossRef CAS PubMed.
- L. T. Ye, Z. S. Li, X. F. Zhang, F. L. Lei and S. Lin, J. Mater. Chem. A, 2014, 2, 21010–21019 CAS.
- C. Y. Zhai, M. S. Zhu, D. Bin, H. W. Wang, Y. K. Du, C. Y. Wang and P. Yang, ACS Appl. Mater. Interfaces, 2014, 6, 17753–17761 CAS.
- X. L. Fan, C. X. Zhang, H. R. Xue, H. Guo, L. Song and J. P. He, RSC Adv., 2015, 5, 78880–78888 RSC.
- C. T. Lin, M. H. Shiao, M. N. Chang, N. Chu, Y. W. Chen, Y. H. Peng, B. H. Liao, H. J. Huang, C. N. Hsiao and F. G. Tseng, Nanoscale Res. Lett., 2015, 10, 1–8 CrossRef PubMed.
- Y.-H. Hsu, A. T. Nguyen, Y.-H. Chiu, J.-M. Li and Y.-J. Hsu, Appl. Catal., B, 2016, 185, 133–140 CrossRef CAS.
- Y. Liu, Y. Zheng, B. Du, R. R. Nasaruddin, T. Chen and J. Xie, Ind. Eng. Chem. Res., 2017, 56, 2999–3007 CrossRef CAS.
- Z. Li, Y. Xin, W. Wu, B. Fu and Z. Zhang, ACS Appl. Mater. Interfaces, 2016, 8, 30972–30979 CAS.
- N. J. Ray and E. G. Karpov, ACS Appl. Mater. Interfaces, 2016, 8, 32077–32082 CAS.
- X. Shi, Z. Lou, P. Zhang, M. Fujitsuka and T. Majima, ACS Appl. Mater. Interfaces, 2016, 8, 31738–31745 CAS.
- Y. Liu, Q. Yao, X. Wu, T. Chen, Y. Ma, C. N. Ong and J. Xie, Nanoscale, 2016, 8, 10145–10151 RSC.
- Y. Liu, J. Li, B. Zhou, H. Chen, Z. Wang and W. Cai, Chem. Commun., 2011, 47, 10314–10316 RSC.
- Y. Liu, J. Li, B. Zhou, S. Lv, X. Li, H. Chen, Q. Chen and W. Cai, Appl. Catal., B, 2012, 111–112, 485–491 CrossRef CAS.
- J. Tang, D. Chen, Q. Yao, J. Xie and J. Yang, Mater. Today Energ., 2017, 6, 115–127 CrossRef.
- J. Qu, F. Ye, D. Chen, Y. Feng, Q. Yao, H. Liu, J. Xie and J. Yang, Adv. Colloid Interface Sci., 2016, 230, 29–53 CrossRef CAS PubMed.
- X. L. Hu, X. D. Shen, O. Takai and N. Saito, J. Alloys Compd., 2013, 552, 351–355 CrossRef CAS.
- X. L. Hu, O. Takai and N. Saito, Jpn. J. Appl. Phys., 2013, 52, 01AE17 CrossRef.
- J. J. Shi, X. L. Hu, J. B. Zhang, W. P. Tang, H. T. Li, X. D. Shen and N. Saito, Prog. Nat. Sci.: Mater. Int., 2014, 24, 593–598 CrossRef CAS.
- X. L. Hu, J. J. Shi, J. B. Zhang, W. P. Tang, H. K. Zhu, X. D. Shen and N. Saito, J. Alloys Compd., 2015, 619, 452–457 CrossRef CAS.
- X. Hu, C. Ge, N. Su, H. Huang, Y. Xu, J. Zhang, J. Shi, X. Shen and N. Saito, J. Alloys Compd., 2017, 692, 848–854 CrossRef CAS.
- K.-L. Li, Z.-B. Xie and S. Adams, Electrochim. Acta, 2012, 62, 116–123 CrossRef CAS.
- X. L. Hu, J. B. Zhang, J. J. Shi and X. D. Shen, Abstracts of Papers of the American Chemical Society, 2014, p. 248 Search PubMed.
- X. Hu, C. Ge, N. Su, H. Huang, Y. Xu, J. Zhang, J. Shi, X. Shen and N. Saito, J. Alloys Compd., 2017, 692, 848–854 CrossRef CAS.
- R. Sanjines, H. Tang, H. Berger, F. Gozzo, G. Margaritondo and F. Levy, J. Appl. Phys., 1994, 75, 2945–2951 CrossRef CAS.
- Z. I. Bedolla-Valdez, Y. Verde-Gomez, A. M. Valenzuela-Muniz, Y. Gochi-Ponce, M. T. Oropeza-Guzman, G. Berhault and G. Alonso-Nunez, Electrochim. Acta, 2015, 186, 76–84 CrossRef CAS.
- V. Subramanian, E. E. Wolf and P. V. Kamat, J. Phys. Chem. B, 2003, 107, 7479–7485 CrossRef CAS.
- V. Subramanian, E. Wolf and P. V. Kamat, J. Phys. Chem. B, 2001, 105, 11439–11446 CrossRef CAS.
Footnotes |
| † Electronic supplementary information (ESI) available. See DOI: 10.1039/c7ra11564d |
| ‡ Nan Su and Jianbo Zhang are co-first authors. |
| This journal is © The Royal Society of Chemistry 2017 |

