DOI:
10.1039/C7RA11443E
(Paper)
RSC Adv., 2017,
7, 51528-51537
Removal of sulphur from model gasoline by CuAgY zeolite: equilibrium, thermodynamics and kinetics
Received
17th October 2017
, Accepted 1st November 2017
First published on 6th November 2017
Abstract
In this study, the removal of thiophene from cyclohexane using ion-exchanged Y zeolites was investigated in a batch system by performing static tests. The effects of initial sulphur concentration, contact time and adsorption temperature on the removal efficiency were studied. Changes to the adsorbents before and after the adsorption were characterized by ICP-AES, XRD, N2 physisorption, SEM, and TEM. The highest sulphur adsorption capacity of 60.98 mgS g−1 for CuAgY was achieved at 323 K. The equilibrium data were well fitted by the Sips model and the kinetics of the adsorption process could be described by the pseudo-second-order model. Thermodynamic parameters were obtained from the models and indicated that the adsorption was spontaneous and exothermic. Modeling results also showed that the Marquardt's Percent Standard Deviation (MPSD) and the Sum of the Squares of the Errors (SSE) provided the best fitting results for isotherm and kinetic models, respectively. In addition, it was found that CuAgY could maintain 84.5% of the capacity for sulphur after twice regeneration.
1. Introduction
Fuels with high sulphur content could pose a risk to the environment and human health.1,2 This also inhibits their application to many fields such as fuel cells which require ultra-low sulphur content (less than 0.1 ppmw).3 Therefore, developing effective deep desulphurization methods is necessary and crucial to satisfy environmental regulations and requirements for ultra-low sulphur fuels.4–6
Traditional hydrodesulphurization (HDS) is realized under harsh processing conditions and can effectively remove sulphur compounds including mercaptan and thioether from fuel products.7 However, it is ineffective in removing thiophene (TP), benzothiophene (BT) and their alkyl derivatives. In order to effectively remove these compounds, a number of new desulphurization technologies have been developed, which include oxidative desulfurization,8,9 biodesulfurization,10 extractive desulfurization,11,12 and adsorptive desulfurization.13–16 Among these technologies, adsorptive desulphurization was found to be the most promising technique due to its simplicity in system design and low operating cost.
So far, various adsorbents have been studied for adsorption desulphurization such as metal–organic frameworks (MOFs),17 magnetic alumina,18 active carbon (AC),19,20 clay materials,21 metal oxides,22 and zeolite-based materials.13–16,23–33 Y zeolites have been extensively studied due to the large surface area, suitable pore size and thermal stability. The studied Y-based materials included synthesized zeolite ([Ga]AlY),25 single metal modified zeolites (AgY, Cu(I)Y, NiY, ZnY, CeY, PdY),26–28 and bimetal modified zeolites (CuICeIVY, AgCeY, CuZnY, NiCeY).16,29–31
For single metal modified zeolites, Song et al.14,32 and Yang et al.26,27,33 investigated the removal of thiophenic compounds from transportation fuels (diesel, gasoline and jet fuels) by ion-exchanged Y zeolites with Ag+, Cu2+, Ni2+, Zn2+, Pd2+, and Ce3+ cation. The results showed that CuIY and AgY zeolites had relatively high sulphur adsorption capacities of 81.6 mgS g−1 and 28.8 mgS g−1, respectively, by π-complexation but their adsorption selectivities were adversely impacted by aromatic hydrocarbons. They also found out that CeIVY had less impact by aromatic hydrocarbons due to the direct sulphur–metal (S–M) interaction. Among the studies on bimetal modified zeolites, Shan et al.16 found out that the presence of Ce species could enhance the number of Cu+ on the CuICeIVY surface in comparison with CuIY. The AgCeY, CuICeIVY and NiCeY had better sulphur adsorption capacity via both π-complexation and S–M interaction. In addition, Zhang et al.31 showed that the co-exchanged CuIIZnIIY was more stable and favorable than AgY in terms of the adsorption desulphurization performance. The co-exchanged CuIIZnIIY was different to ZnY in terms of desorbing dibenzothiophene in higher temperatures, which may be related with the S–M bonding. Therefore, the bimetal modified Y zeolites have a better potential for adsorption desulphurization than single metal modified Y zeolites due to their high capacity and selectivity.
CuIY and AgY as π-complexation adsorbents have been developed for adsorption desulphurization. However, they were found not able to meet the requirement of industrial adsorption applications due to some issues. First, they have poor desulphurization performance in real oil samples. Second, after ion exchange, the Cu(II) in CuY has be converted Cu(I) under harsh conditions in order to increase its desulphurization performance which increases the operating cost.26 Therefore, it would be necessary to develop new bimetallic adsorbents without these drawbacks. Since Cu and Ag exchanged Y zeolites are inexpensive and easy to prepare, this study investigated the adsorption desulphurization performance of CuAgY, which was found to have a high desulfurization capacity.
Besides experimental studies, mathematical model analysis is a practical and efficient way to elaborate the chemical processes and equipment in detail. Song et al.34,35 investigated the model of adsorption kinetics and adsorption equilibrium of TP and BT in model fuel on AgCeY and CuICeIVY. They found that the Langmuir isotherm and the pseudo-first-order model exhibited the best fits of experimental data, and the intra-particle diffusion was not the rate controlling step. The results were similar to those for NiCeY.36 Theoretical and empirical models could be used for thermodynamics and kinetics of the adsorption at the solid/liquid interface.
The objective of the current work is to study the removal of TP by adsorption on CuAgY. Its performance was compared with NaY, CuY and AgY. The three factors affecting the adsorption desulphurization performance, the adsorption time, initial sulphur content and temperature, were investigated. The equilibrium, kinetics and thermodynamic systematically properties of adsorption system were studied to understand the adsorption of TP on CuAgY. In addition, the regeneration study of the adsorbents was performed and found that the CuAgY could maintain 84.5% of its capacity after twice regeneration.
2. Experiment
2.1. Materials
Thiophene (Analytical Reagent Grade, 99%), Cu(NO3)2·3H2O (99%), and AgNO3 (99.8%) were purchased from Tianjin Guangfu Fine Chemical Research Institute. Cyclohexane (Analytical Reagent Grade, ≥99.7%) was purchased from Tianjin Yuanli Chemical Corporation. All reagents were used without further purification. NaY zeolite (SiO2/Al2O3 = 4.8) was purchased from Nankai University Catalyst Factory.
The model gasoline with different sulphur concentrations were prepared by dissolving TP in cyclohexane. The studied sulphur concentrations included: 162 mgS L−1 (M-1), 223 mgS L−1 (M-2), 305 mgS L−1 (M-3), 471 mgS L−1 (M-4), 601 mgS L−1 (M-5), and 770 mgS L−1 (M-6).
2.2. Ion exchange
Prior to the ion exchange, the NaY zeolite was dehydrated in a muffle furnace heating at a rate of 1 K min−1 to 673 K and kept at 673 K for 2 h to remove the acid gases, such as CO2, SO2 and others. Then NaY zeolite was merged in a 0.1 mol L−1 Cu(NO3)2 or AgNO3 solution at 333 K for 12 h. The ratio of the solution volume (mL) to the mass of NaY (g) was 100![[thin space (1/6-em)]](https://www.rsc.org/images/entities/char_2009.gif) :
:![[thin space (1/6-em)]](https://www.rsc.org/images/entities/char_2009.gif) 1. After the ion exchange was done, the AgY or CuY was filtered and washed thoroughly with deionized water to remove the residual cations. The filtered cake was then dried at 383 K for 6 h and calcinated at 773 K for 4 h. Then the cake was ground into power and stored in a desiccator. The bimetallic zeolites (CuAgY) were prepared by co-exchanging 5 g of NaY in a mixed solution of 250 mL 0.1 mol L−1 AgNO3 and 250 mL 0.1 mol L−1 Cu(NO3)2. The procedures were the same as above. The operations with silver nitrate were performed in a dark environment due to the light sensitivity of silver (Table 1).
1. After the ion exchange was done, the AgY or CuY was filtered and washed thoroughly with deionized water to remove the residual cations. The filtered cake was then dried at 383 K for 6 h and calcinated at 773 K for 4 h. Then the cake was ground into power and stored in a desiccator. The bimetallic zeolites (CuAgY) were prepared by co-exchanging 5 g of NaY in a mixed solution of 250 mL 0.1 mol L−1 AgNO3 and 250 mL 0.1 mol L−1 Cu(NO3)2. The procedures were the same as above. The operations with silver nitrate were performed in a dark environment due to the light sensitivity of silver (Table 1).
Table 1 The three isotherm models evaluated in this study
| Isotherms |
Equations |
|
| Langmuir34 |
 |
(2) |
| Freundlich30 |
qe = KfCe1/n |
(3) |
| Sips37 |
 |
(4) |
2.3. Characterization of adsorbents
X-ray powder diffraction (XRD) patterns were obtained with a MinFlex-600 X/Rigaku Diffractometer equipped with Cu Kα radiation (λ = 1.54056 Å) at 40 kV and 15 mA. The patterns were recorded with the 2θ ranging from 5° to 50° at a scanning rate of 5° min−1. The chemical composition of cation-exchange zeolites was measured by inductively coupled plasma atomic emission spectrometry (ICP-AES) with a Perkin-Elmer Spectrometer. The surface morphologies of the zeolites were characterized by field emission scanning electron microscopy (SEM, Hitachi S-4800). Transmission electron micrographs (TEM) were taken with a Transmission Electron Microscope (JEOL JEM-2100F). N2 physisorption was measured on a Micromeritics ASAP 2020 (Micromeritics; USA) using nitrogen adsorption at 77 K (Table 2).
Table 2 Kinetic models used in this study
| Models |
Equations |
|
| Pseudo-first-order |
qt = qe(1 − exp(−k1t)) |
(8) |
| Pseudo-second-order |
 |
(9) |
| Intra-particle diffusion |
qt = kt0.5 + C |
(10) |
2.4. Batch adsorption experiments
For each experiment, 25 mL of model gasoline was mixed with 0.20 g adsorbent in a 100 mL three-necked, round-bottomed flask. The flask was agitated with a magnetic stirrer at a constant speed. A furnace was used to heat the solution to desired temperatures (30, 40, 50 °C). Model gasoline samples were taken during the course of adsorption experiments to obtain kinetic data of the adsorption. After the adsorption was finished, the precipitate was removed by centrifugation and the supernatant was analyzed (Table 3).
Table 3 Equation of these six different error functions
| Error functions |
Equations |
|
| SSE |
 |
(11) |
| HYBRID |
 |
(12) |
| ARE |
 |
(13) |
| MPSD |
 |
(14) |
| SAE |
 |
(15) |
| R2 |
 |
(16) |
2.5. Determination of the sulphur adsorption capacity
The sulphur concentrations of the model gasoline samples taken during the adsorption process were measured using a Gas Chromatograph (GC-6820) equipped with a flame ionization detector (FID). A DB-FFAP column with a length of 60 m and inside diameter 0.32 mm was used. The temperatures of the injector, detector, and oven were set as 200 °C, 250 °C, and 80 °C, respectively.
The amount of sulphur adsorbed at equilibrium (qe (mgS g−1)) was calculated by:
| |
 | (1) |
3. Theoretical basis of models
3.1. Adsorption isotherm models
Three different adsorption isotherm models, namely Langmuir, Freundlich, and Sips, were used to analyze the adsorption isotherms.
3.2. Adsorption thermodynamics
For adsorption process, the thermodynamic analysis is a key method to judge whether the adsorption process is spontaneous and exothermic or endothermic. The thermodynamic parameters (ΔG0, ΔH0, and ΔS0) of the studied adsorption system can be evaluated according to the following equations:38,39| |
 | (5) |
| |
ΔG0 = −RT![[thin space (1/6-em)]](https://www.rsc.org/images/entities/char_2009.gif) ln ln![[thin space (1/6-em)]](https://www.rsc.org/images/entities/char_2009.gif) Kp Kp
| (6) |
| |
 | (7) |
where Kp is dimensionless sorption distribution coefficient. The value of Kp is equal to the intercept in the plotting ln(Cs/Ce) versus Cs by extrapolating Cs to zero.39
3.3. Kinetic models
To better understand of the adsorption kinetics, models including pseudo-first-order, pseudo-second-order, and intra-particle diffusion models were used to fit the experimental data. These models have been widely used to describe the kinetics of sulphur adsorption on zeolites.34–36
3.4. Error functions
The modelling optimization requires error functions to determine the goodness of the fitting by the models. In addition to the correlation coefficients (R2), five different error functions including the Sum of the Squares of the Errors (SSE), the Hybrid Fractional Error Function (HYBRID),41 the Average Relative Error Function (ARE), the Marquardt's Percent Standard Deviation (MPSD),42 and the sum of the Absolute Errors Function (SAE) were used to evaluate the models.40 The model parameters were evaluated by the solver add-in with Microsoft Excel by minimizing the Sum of Normalized Errors (SNE)43,44 of the curve-fitting.
4. Results and discussion
4.1. Chemical and physical properties of various zeolites
XRD analysis was used for identifying changes to the mineralogical structures of the zeolites after modifications. The results in Fig. 1 showed that all the characteristic peaks of the modified NaY closely matched with those in original NaY. No additional phases/peaks were observed. Therefore the crystal structure of modified zeolites maintained the same. However, the crystallinities of these modified zeolites slightly decreased due to a decrease in the intensity of peaks. Meanwhile, the positions of the peaks for the modified NaY zeolites were slightly shifted to angles higher than those for NaY, which indicated a reduction in the d-spacing value due to the Bragg equation. These observations indicated the physical structure of FAU framework was nearly unchanged. Similar results have been provided in other literature.45 The SEM and TEM images of CuAgY zeolite before and after adsorption were shown in Fig. 2. In general, the SEM and TEM image of CuAgY showed the presence of crystals with the irregular cubic shaped structure, smooth and homogenous surface morphology without clusters forming. It indicated that the adsorbent was very stable. Results of nitrogen physisorption to determine the physical properties of original NaY and modified NaY were shown in Table 4. The micropore volume of CuAgY was 0.295 cm3 g−1, which was lower than that of NaY. It might be related to the partly collapse of zeolite structure. This phenomenon was consistent with the XRD results. ICP-AES was used to obtain the fraction of total silicon, aluminum, and metal ions. The original NaY and modified NaY were shown in Table 4. Since metal cations (M) in the zeolites balanced the negative charge of the aluminum tetrahedron, the n(mMm+ + Na+)/n(Al) ratio should be 1![[thin space (1/6-em)]](https://www.rsc.org/images/entities/char_2009.gif) :
:![[thin space (1/6-em)]](https://www.rsc.org/images/entities/char_2009.gif) 1 due to the law of conservation of charge. As shown in Table 4, the ratios of n(2Cu2+ + Na+)/n(Al), n(Ag+ + Na+)/n(Al), and n(2Cu2+ + Ag+ + Na+)/n(Al) are all close to 1. However, the n(Si)/n(Al) ratio increases after preparation. It indicates that the minority of framework aluminum dissolves in ion exchange and high-temperature calcination results in the collapse of zeolite structure.
1 due to the law of conservation of charge. As shown in Table 4, the ratios of n(2Cu2+ + Na+)/n(Al), n(Ag+ + Na+)/n(Al), and n(2Cu2+ + Ag+ + Na+)/n(Al) are all close to 1. However, the n(Si)/n(Al) ratio increases after preparation. It indicates that the minority of framework aluminum dissolves in ion exchange and high-temperature calcination results in the collapse of zeolite structure.
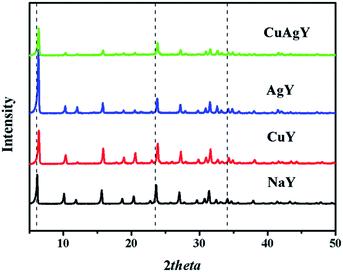 |
| | Fig. 1 XRD patterns of NaY, CuY, AgY, and CuAgY. | |
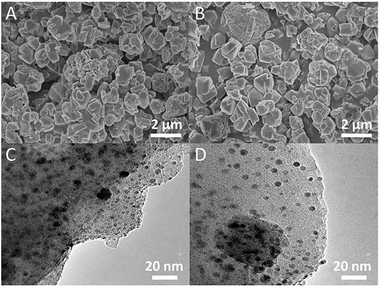 |
| | Fig. 2 SEM images (A, C) and TEM images (B, D) of CuAgY before and after TP adsorption. | |
Table 4 Chemical and physical properties of various zeolites
| Zeolites |
n(Na)/n(Al)a |
n(Cu)/n(Al)a |
n(Ag)/n(Al)a |
n(Si)/n(Al)a |
Vmicb cm3 g−1 |
SBETc m2 g−1 |
Smicc m2 g−1 |
| Measured by ICP. BET method. t-plot method. |
| NaY |
0.97 |
0 |
0 |
2.40 |
0.333 |
662 |
626 |
| CuY |
0.19 |
0.40 |
0 |
2.42 |
0.298 |
604 |
562 |
| AgY |
0.05 |
0 |
0.94 |
2.41 |
0.319 |
607 |
577 |
| CuAgY |
0.02 |
0.26 |
0.47 |
2.43 |
0.295 |
591 |
554 |
4.2. Batch adsorption experimental results
4.2.1. Effect of NaY and modified NaY zeolites. The desulphurization performances of the original NaY and modified NaY zeolites were studied, and the results are shown in Fig. 3. It was found that the modified NaY zeolites had higher desulfurization removal, which should be due to π-complexation when Cu or Ag was added.27 Among the modified NaY zeolites, CuAgY achieved the highest loading of 60.98 mgS g−1. The sulphur capacity of AgY is 32.00 mgS g−1, which was in good agreement with the results reported in the literature.46 The adsorption sulphur capacity of different adsorbents for removing TP in other literatures are listed in Table 5.
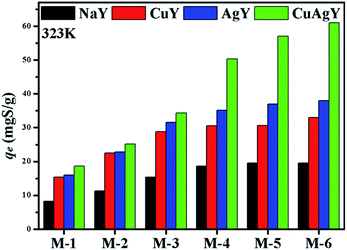 |
| | Fig. 3 The adsorption sulphur capacities on NaY, CuY, AgY, and CuAgY at 323 K. | |
Table 5 Adsorption capacities of the TP adsorption on various adsorbents
| Adsorbents |
Adsorbate/solvent |
C0 (mg L−1) |
Adsorption mode |
qe (mgS g−1) |
Ref. |
| HYD10B-MS-13X |
TP/n-hexane |
707 |
Batch |
4.78 |
47 |
| Ni/SBA |
TP/n-octane |
407 |
Fix bed |
7.04 |
48 |
| MnO/AC |
TP/(n-hexane and toluene) |
36 |
Batch/fix bed |
1.58 |
49 |
| Nickel NPs |
TP/n-octane |
524 |
Batch |
25.0 |
50 |
| HKUST-1/Fe3O4 |
TP/isooctane |
450 |
Batch |
19.8 |
51 |
| AgCeY |
TP/n-octane |
100 |
Batch |
1.70 |
34 |
| CuICeIVY |
TP/isooctane |
381 |
Batch |
38.4 |
16 |
| NiCeY |
TP/n-octane |
703 |
Batch |
22.4 |
36 |
| CuZnY |
TP/n-octane |
351 |
Batch |
17.2 |
31 |
| CuAgY |
TP/cyclohexane |
778 |
Batch |
60.98 |
This study |
4.2.2. Effect of contact time. The effect of contact time on the adsorption capacity of CuAgY was studied. As shown in Fig. 4, the sulphur adsorption capacity on CuAgY increased at all temperatures and reached the dynamic balance from 60 min to 180 min. Within the first 20 min, the adsorption rate was found to increase with increasing temperature. Increasing the temperature in the beginning was beneficial to heat and mass transfer, and the interaction between adsorbent and adsorbate.
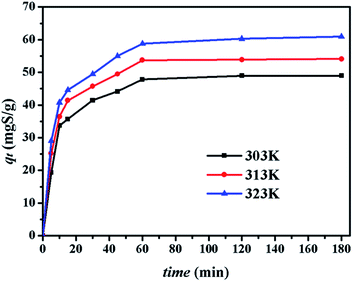 |
| | Fig. 4 Effect of contact time on desulphurization on CuAgY at different temperatures. | |
4.2.3. Effect of initial sulphur concentration. Adsorption experiments were executed with different initial sulphur concentrations at 303 K, 313 K, and 323 K to obtain the equilibrium data of sulphur adsorption on CuAgY in Fig. 5. At all temperatures, the adsorption equilibrium increased with initial sulphur concentration due to concentration driving force. At 313 K, the sulphur capacity on CuAgY increased from 18.61 mgS g−1 to 60.98 mgS g−1.
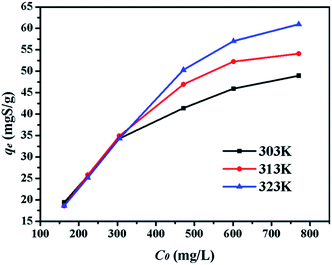 |
| | Fig. 5 Effect of C0 on adsorption capacity of CuAgY at different temperatures. | |
4.3. Modeling of adsorption isotherms
Five error functions were used to fit the experimental data and SNE was applied to evaluate the best error function for the Langmuir, Freundlich, and Sips models. The model parameters and error functions results are summarised in Table 6. MPSD was accounted as the best error function for estimating the isotherms due to the minimum SNE as highlighted in bold type in Table 6. The lowest SNE using the MPSD function were calculated as 4.344, 3.568, and 4.139 for Langmuir, Freundlich and Sips models, respectively. The modeling results for all three models and temperatures are compared in Table 7. The Sips model has lowest MPSD values and highest R2, which indicate that the Sips model fits the isotherms of TP adsorption on CuAgY best. The experimental adsorption data were fitted using the three isotherm models, which are shown in Fig. 6.
Table 6 SNE and error analysis for Langmuir, Freundlich, and Sips at 303 K
| |
SSE |
HYBRID |
ARE |
MPSD |
SAE |
| Langmuir |
| qm (mgS g−1) |
49.33 |
49.09 |
49.06 |
49.06 |
49.06 |
| KL (L mg−1) |
0.0542 |
0.0552 |
0.0598 |
0.0598 |
0.0598 |
| SSE |
16.00 |
16.11 |
18.93 |
18.93 |
18.93 |
| HYBRID |
11.40 |
11.33 |
13.85 |
13.85 |
13.85 |
| ARE |
1.845 |
1.767 |
1.042 |
1.042 |
1.042 |
| MPSD |
13.13 |
13.15 |
11.46 |
11.46 |
11.46 |
| SAE |
8.643 |
8.804 |
7.993 |
7.993 |
7.993 |
| SNE |
4.649 |
4.627 |
4.344 |
4.344 |
4.344 |
![[thin space (1/6-em)]](https://www.rsc.org/images/entities/char_2009.gif) |
| Freundlich |
| Kf (mg g−1)(L mg−1)1/n |
13.31 |
12.42 |
10.00 |
11.89 |
13.31 |
| 1/n |
0.2233 |
0.2367 |
0.2769 |
0.2455 |
0.2250 |
| SSE |
35.94 |
37.95 |
67.52 |
41.25 |
36.55 |
| HYBRID |
32.06 |
30.15 |
47.51 |
30.86 |
32.62 |
| ARE |
3.900 |
3.181 |
1.727 |
2.753 |
3.947 |
| MPSD |
20.15 |
17.95 |
19.00 |
16.59 |
20.05 |
| SAE |
11.57 |
11.06 |
13.62 |
10.72 |
11.36 |
| SNE |
4.045 |
3.705 |
4.380 |
3.568 |
4.057 |
![[thin space (1/6-em)]](https://www.rsc.org/images/entities/char_2009.gif) |
| Sips |
| Q (mgS g−1) |
52.92 |
52.31 |
52.70 |
61.32 |
52.28 |
| b (L mg−1) |
0.0462 |
0.0472 |
0.0468 |
0.0252 |
0.0472 |
| 1/m |
0.780 |
0.807 |
0.808 |
0.599 |
0.807 |
| SSE |
13.14 |
13.22 |
13.41 |
19.93 |
13.23 |
| HYBRID |
12.46 |
12.35 |
12.61 |
19.22 |
12.35 |
| ARE |
1.047 |
0.950 |
0.924 |
0.696 |
0.950 |
| MPSD |
11.92 |
11.54 |
11.74 |
8.74 |
11.52 |
| SAE |
7.149 |
7.065 |
7.218 |
5.349 |
7.048 |
| SNE |
4.299 |
4.161 |
4.197 |
4.139 |
4.158 |
Table 7 Comparison of the Langmuir, Freundlich, and Sips at different temperatures
| |
303 K |
313 K |
323 K |
| Langmuir |
| qm (mgS g−1) |
49.06 |
59.80 |
72.74 |
| KL (L mg−1) |
0.0598 |
0.0338 |
0.0199 |
| R2 |
0.9894 |
0.9911 |
0.9852 |
| MPSD |
11.46 |
13.74 |
13.68 |
![[thin space (1/6-em)]](https://www.rsc.org/images/entities/char_2009.gif) |
| Freundlich |
| Kf (mg g−1)(L mg−1)1/n |
11.89 |
9.30 |
6.68 |
| 1/n |
0.245 |
0.328 |
0.399 |
| R2 |
0.9779 |
0.9435 |
0.9203 |
| MPSD |
16.59 |
33.63 |
35.09 |
![[thin space (1/6-em)]](https://www.rsc.org/images/entities/char_2009.gif) |
| Sips |
| Q (mgS g−1) |
61.32 |
54.12 |
64.76 |
| b (L mg−1) |
0.0252 |
0.0410 |
0.0288 |
| 1/m |
0.5992 |
1.6435 |
1.3394 |
| R2 |
0.9890 |
0.9955 |
0.9978 |
| MPSD |
8.74 |
7.78 |
7.76 |
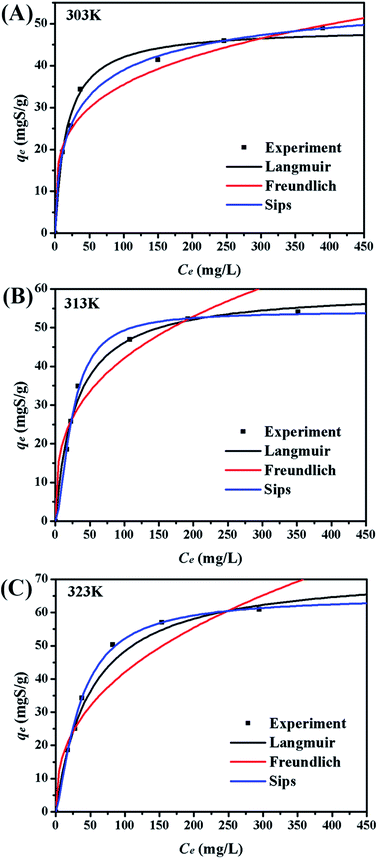 |
| | Fig. 6 Adsorption equilibrium isotherms on CuAgY at different temperatures. | |
4.4. Adsorption kinetics
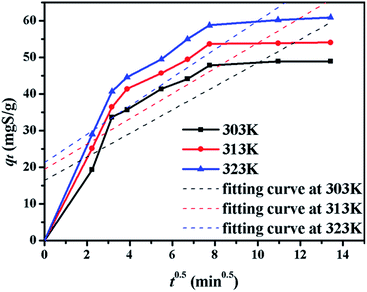
The kinetics of sulphur adsorption on CuAgY was analyzed with three widely used kinetic models for adsorption processes including pseudo-first-order, pseudo-second-order, and intra-particle diffusion models. Similar to the analysis of isotherms above, the five error functions were used and SNE were evaluated to determine the best error function for the pseudo-first-order and pseudo-second-order models. Model parameters and error functions analysis results are given in Table 8. The SNE values in bold shown in Table 8 indicated that the SSE error function was best one for optimizing the kinetics. The parameters estimated for different temperatures using the two kinetics models as well as the SSE and R2 values are shown in Table 9. It was found that the pseudo-second-order model had the lowest SSE values and R2 values above 0.99, which indicated that this model fit the uptake curve of sulphur on CuAgY best. Fittings of experimental data with the pseudo-first-order and pseudo-second-order models are demonstrated in Fig. 7 and 8. The rate constant k2 of the pseudo-second-order model were 0.00286, 0.00301, 0.00271 g mg−1 min−1 for different temperatures and the model predicted qe was close to the actual qexp. Hence, the pseudo-second-order kinetic model fitted the data better than the pseudo-first-order model. Furthermore, Fig. 9 shows the fitting of the intra-particle model with the kinetic data. The lines of the intra-particle diffusion model mainly contained three fractions at all temperatures. It was found that this model cannot describe the adsorption kinetics of sulphur of CuAgY. It was observed that the figure lines in the Fig. 9 had three fractions. The first fraction indicated the rapid adsorption of TP molecules on the external surface of CuAgY through the boundary film. The second fraction indicated that TP molecules moved from the external surface to the active intra-particle sites the rate of which was controlled by the intra-particle diffusion resulting in a slower uptake rate. The last fraction was the equilibrium stage there no further adsorption occurred. The dotted lines of the intra-particle diffusion model did not pass through the origin point, which indicated that the intra-particle diffusion was influenced by the boundary layer diffusion.28,52
Table 8 SNE and error analysis for the pseudo-first-order and pseudo-second-order kinetic at 303 K
| |
SSE |
HYBRID |
ARE |
MPSD |
SAE |
| Pseudo-first-order |
| qe (mgS g−1) |
46.91 |
46.70 |
47.96 |
47.96 |
47.96 |
| k1 (min−1) |
0.1065 |
0.1083 |
0.1034 |
0.1034 |
0.1034 |
| SSE |
39.47 |
39.66 |
44.50 |
44.50 |
44.50 |
| HYBRID |
13.85 |
13.78 |
15.86 |
15.86 |
15.86 |
| ARE |
4.233 |
4.370 |
4.038 |
4.038 |
4.038 |
| MPSD |
14.40 |
14.87 |
13.74 |
13.74 |
13.74 |
| SAE |
15.74 |
16.17 |
14.60 |
14.60 |
14.60 |
| SNE |
4.671 |
4.760 |
4.751 |
4.751 |
4.751 |
![[thin space (1/6-em)]](https://www.rsc.org/images/entities/char_2009.gif) |
| Pseudo-second-order |
| qe (mgS g−1) |
51.66 |
52.06 |
52.12 |
50.95 |
50.66 |
| k2 (g mg−1 min−1) |
0.00286 |
0.00268 |
0.00248 |
0.00285 |
0.00315 |
| SSE |
19.06 |
19.99 |
25.95 |
22.90 |
21.37 |
| HYBRID |
9.744 |
9.260 |
10.82 |
10.35 |
11.52 |
| ARE |
3.408 |
3.394 |
3.185 |
3.325 |
3.503 |
| MPSD |
11.59 |
11.54 |
10.83 |
11.31 |
11.92 |
| SAE |
9.441 |
9.916 |
9.829 |
9.533 |
9.317 |
| SNE |
4.478 |
4.511 |
4.748 |
4.640 |
4.763 |
Table 9 Comparison of the pseudo-first-order, pseudo-second-order kinetic, and Intra-particle models for sulphur adsorption on CuAgY
| |
Temperature (K) |
| 303 |
313 |
323 |
| qexp (mgS g−1) |
48.95 |
54.08 |
60.98 |
![[thin space (1/6-em)]](https://www.rsc.org/images/entities/char_2009.gif) |
| Pseudo-first-order |
| qe (mgS g−1) |
46.90 |
51.83 |
57.34 |
| k1 (min−1) |
0.1065 |
0.1172 |
0.1177 |
| R2 |
0.9819 |
0.9824 |
0.9727 |
| SSE |
39.47 |
46.08 |
88.43 |
![[thin space (1/6-em)]](https://www.rsc.org/images/entities/char_2009.gif) |
| Pseudo-second-order |
| qe (mgS g−1) |
51.66 |
56.61 |
62.73 |
| k2 (g mg−1 min−1) |
0.00286 |
0.00301 |
0.00271 |
| R2 |
0.9910 |
0.9960 |
0.9956 |
| SSE |
19.06 |
9.99 |
13.70 |
![[thin space (1/6-em)]](https://www.rsc.org/images/entities/char_2009.gif) |
| Intra-particle diffusion |
| C (mgS g−1) |
16.45 |
19.47 |
21.29 |
| k (mg g−1 min−0.5) |
3.213 |
3.450 |
3.871 |
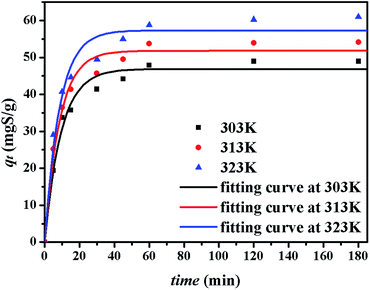 |
| | Fig. 7 Uptake curves of sulphur adsorption on CuAgY fitted by the pseudo-first-order model. | |
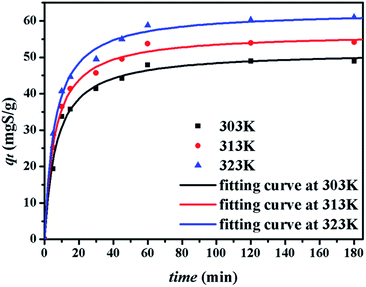 |
| | Fig. 8 Uptake curves of sulphur adsorption on CuAgY fitted by the pseudo-second-order model. | |
 |
| | Fig. 9 The plot of qt versus t0.5 for sulphur adsorption on CuAgY at different temperatures. | |
4.5. Adsorption thermodynamics
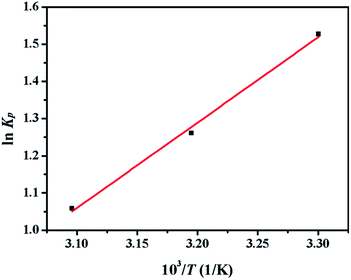
Thermodynamic parameters including ΔH0 and ΔS0 were obtained from the Van's Hoff plot of ln![[thin space (1/6-em)]](https://www.rsc.org/images/entities/char_2009.gif) Kp against 1/T shown in Fig. 10 and the calculated parameters are listed in Table 10. The negative values of Gibbs free energy change (ΔG0 < 0) indicated that the adsorption of sulphur on CuAgY was a spontaneous process. The value of ΔG0 became more negative with the increasing of temperature indicating that the increase of temperature favored the adsorption. The negative value of ΔH0 manifested that the adsorption was exothermic. The negative entropy ΔS0 indicated a decrease of randomness at the solid-solution interface during adsorption.
Kp against 1/T shown in Fig. 10 and the calculated parameters are listed in Table 10. The negative values of Gibbs free energy change (ΔG0 < 0) indicated that the adsorption of sulphur on CuAgY was a spontaneous process. The value of ΔG0 became more negative with the increasing of temperature indicating that the increase of temperature favored the adsorption. The negative value of ΔH0 manifested that the adsorption was exothermic. The negative entropy ΔS0 indicated a decrease of randomness at the solid-solution interface during adsorption.
 |
| | Fig. 10 Plot of ln![[thin space (1/6-em)]](https://www.rsc.org/images/entities/char_2009.gif) Kp vs. 1/T for the estimation of thermodynamic parameters of sulphur adsorption on CuAGY. Kp vs. 1/T for the estimation of thermodynamic parameters of sulphur adsorption on CuAGY. | |
Table 10 Thermodynamic parameters for adsorption of sulphur on CuAgY
| Zeolite |
Temperature (K) |
Kp |
ΔG0 (kJ mol−1) |
ΔH0 (kJ mol−1) |
ΔS0 (J K−1 mol−1) |
| CuAgY |
303 |
4.61 |
−3.83 |
|
|
| 313 |
3.53 |
−3.32 |
−19.11 |
−50.43 |
| 323 |
2.88 |
−2.82 |
|
|
4.6. Regeneration
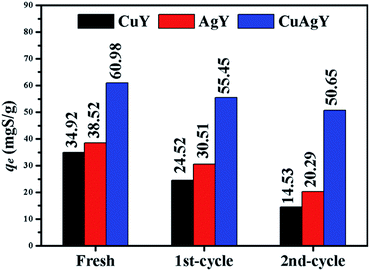
The used CuY, AgY and CuAgY were regenerated using air-calcination at 633 K for 6 h. The capacities of the regenerated zeolites were evaluated with the M-6. The results shown in Fig. 11 indicated that CuAgY lost 15.5% of capacity for sulphur adsorption in model gasoline after twice regeneration, while CuY and AgY lost about 58.3% and 47.3% of its capacity, respectively. This result showed that CuAgY had better regeneration performance than CuY and AgY.
 |
| | Fig. 11 Regeneration performance of CuY, AgY, and CuAgY for sulphur adsorption. | |
5. Conclusions
Compared with the adsorption performance on NaY, CuY, and AgY, CuAgY could be regarded as a better alternative, inexpensive, and environmentally benign adsorbent for removing TP. The types of cations and their exchange degree of zeolites were the important factors influencing the adsorption performance. Experimental results indicated that CuAgY had a higher adsorption capacity for sulphur (60.98 mgS g−1 at 323 K) than CuY (34.92 mgS g−1) and AgY (38.52 mgS g−1) studied in this work, and most other adsorbents in the literature. The isothermal equilibria could be represented by the Sips model using the MSPD error function and the kinetics of the adsorption process could be described by the pseudo-second-order model with the SSE error function. The negative values of ΔG and ΔH showed that the adsorption was spontaneous and exothermic. After twice regeneration, the sulphur adsorption capacity of CuAgY maintained at 50.65 mgS g−1 (15.5% loss), while the CuY and AgY lost 58.3% and 47.3% capacity, respectively, which showed that CuAgY had a good regeneration performance. Further studies are needed to study the effect of the relative content of Cu and Ag on CuAgY on the adsorption performance. As a bimetallic adsorbent, CuAgY with higher sulphur capacity and good regeneration presented a valuable reference for the further research.
Conflicts of interest
There are no conflicts to declare.
Abbreviations
| C0 | Initial sulphur concentration (mg L−1) |
| V | Volume of model gasoline (L) |
| m0 | Mass of adding adsorbent (g) |
| Ce | Equilibrium concentration of sulphur in model gasoline (mg L−1) |
| Cs | Concentration of adsorbate adsorbed onto the adsorbent at equilibrium (mg L−1) |
| qe | Uptake of the adsorbate by the adsorbent at equilibrium (mgS g−1) |
| qm | Maximum capacity (mgS g−1) |
| qt | Uptake of the adsorbate by the adsorbent at time t (mgS g−1) |
| KL | Langmuir equilibrium constant (L mg−1) |
| Kf | Freundlich adsorption isotherm constant [(mg g−1)(L mg−1)1/n] |
| 1/n | Freundlich constant |
| Q | Sips characteristic parameters (mgS g−1) |
| b | Sips constant (L mg−1) |
| m | Sips constant |
| Kp | Sorption distribution coefficient |
| ΔG0 | Free energy of sorption (kJ mol−1) |
| ΔH0 | Enthalpy changes (kJ mol−1) |
| ΔS0 | Entropy changes (J K−1 mol−1) |
| T | Absolute temperature (K) |
| R | Universal gas constant (8.314 J (mol−1 K−1)) |
| k1 | Rate constant of the pseudo-first-order model (min−1) |
| k2 | Rate constant of the pseudo-second-order model (g mg−1 min−1) |
| k | Intra-particle diffusion rate constant (mg g−1 min−0.5) |
| qexp | Observation from the batch experiment (mgS g−1) |
| qcal | Estimate from the model (mgS g−1) |
| qaexp | Average of qexp (mgS g−1) |
| n | Number of observations in the experimental isotherm |
| p | Number of constants in models |
| Vmic | Micropore volume (cm3 g−1) |
| SBET | Total surface area (m2 g−1) |
| Smic | Micropore surface area (m2 g−1) |
References
- C. Song and X. Ma, Appl. Catal., B, 2003, 41, 207–238 CrossRef CAS.
- A. Stanislaus, A. Marafi and M. S. Rana, Catal. Today, 2010, 153, 1–68 CrossRef CAS.
- X. Ma, L. Sun and C. Song, Catal. Today, 2002, 77, 107–116 CrossRef CAS.
- C. Song, Catal. Today, 2003, 86, 211–263 CrossRef CAS.
- I. V. Babich and J. A. Moulijn, Fuel, 2003, 82, 607–631 CrossRef CAS.
- M. Breysse, G. Djega-Mariadassou, S. Pessayre, C. Geantet, M. Vrinat, G. Pérot and M. Lemaire, Catal. Today, 2003, 84, 129–138 CrossRef CAS.
- M. J. Girgis and B. C. Gates, Ind. Eng. Chem. Res., 1991, 30, 2021–2058 CrossRef CAS.
- J. Zhang, A. Wang, X. Li and X. Ma, J. Catal., 2011, 279, 269–275 CrossRef CAS.
- J. L. García-Gutiérrez, G. A. Fuentes, M. E. Hernández-Terán, P. García, F. Murrieta-Guevara and F. Jiménez-Cruz, Appl. Catal., A, 2008, 334, 366–373 CrossRef.
- Y. Izumi, T. Ohshiro, H. Ogino, Y. Hine and M. Shimao, Appl. Environ. Microbiol., 1994, 60, 223–226 CAS.
- S. Zhang, Q. L. Zhang and Z. C. Zhang, Ind. Eng. Chem. Res., 2014, 43, 614–622 CrossRef.
- N. Yi, C. Li, A. Sun, H. Meng and Z. Wang, Energy Fuels, 2006, 20, 2083–2087 CrossRef.
- X. Ma, A. Michael Sprague and C. Song, Ind. Eng. Chem. Res., 2005, 44, 5768–5775 CrossRef CAS.
- X. Ma, S. Velu, J. H. Kim and C. Song, Appl. Catal., B, 2005, 56, 137–147 CrossRef CAS.
- J. H. Kim, X. Ma, A. Zhou and C. Song, Catal. Today, 2006, 111, 74–83 CrossRef CAS.
- J. H. Shan, X. Q. Liu, L. B. Sun and R. Cui, Energy Fuels, 2008, 22, 3955–3959 CrossRef CAS.
- Y. Shi, X. Zhang, L. Wang and G. Liu, AIChE J., 2014, 60, 2747–2751 CrossRef CAS.
- G. Shan, H. Liu, J. Xing, G. Zhang and K. Wang, Ind. Eng. Chem. Res., 2004, 43, 758–761 CrossRef CAS.
- J. Xiao, C. Song, X. Ma and Z. Li, Ind. Eng. Chem. Res., 2014, 51, 3436–3443 CrossRef.
- V. Selvavathi, V. Chidambaram, A. Meenakshisundaram, B. Sairam and B. Sivasankar, Catal. Today, 2009, 141, 99–102 CrossRef CAS.
- W. Ahmad, I. Ahmad, M. Ishaq and K. Ihsan, Arabian J. Chem., 2014, 50, 543–549 Search PubMed.
- R. Menzel, D. Iruretagoyena, Y. Wang, S. M. Bawaked, M. Mokhtar, S. A. Al-Thabaiti, S. N. Basahel and M. S. P. Shaffer, Fuel, 2016, 181, 531–536 CrossRef CAS.
- C. LabordeBoutet, G. Joly, A. Nicolaos, M. Thomas and P. Magnoux, Ind. Eng. Chem. Res., 2006, 45, 6758–6764 CrossRef CAS.
- A. J. Hernández-Maldonado and R. T. Yang, J. Am. Chem. Soc., 2004, 126, 992–993 CrossRef PubMed.
- K. Tang, L. J. Song, L. H. Duan, X. Q. Li, J. Z. Gui and Z. L. Sun, Sci. China: Chem., 2010, 53, 281–286 CrossRef CAS.
- A. J. Hernández-Maldonado, F. H. Yang, G. Qi and R. T. Yang, Appl. Catal., B, 2005, 56, 111–126 CrossRef.
- A. J. H. Hernández-Maldonado and R. T. Yang, Ind. Eng. Chem. Res., 2003, 42, 123–129 CrossRef.
- M. Montazerolghaem, A. Rahimi and F. Seyedeyn-Azad, Chem. Prod. Process Model., 2014, 257, 603–609 Search PubMed.
- H. Song, X. H. Cui, H. L. Song, H. J. Gao and F. Li, Ind. Eng. Chem. Res., 2015, 53, 14552–14557 CrossRef.
- J. Wang, F. Xu, W. J. Xie, Z. J. Mei, Q. Z. Zhang, J. Cai and W. M. Cai, J. Hazard. Mater., 2009, 163, 538–543 CrossRef CAS PubMed.
- Z. Y. Zhang, T. B. Shi, C. Z. Jia, W. J. Ji, Y. Chen and M. Y. He, Appl. Catal., B, 2008, 82, 1–10 CrossRef CAS.
- S. Velu, X. L. Ma and C. Song, Ind. Eng. Chem. Res., 2003, 42, 5293–5304 CrossRef CAS.
- A. J. Hernández-Maldonado and R. T. Yang, Ind. Eng. Chem. Res., 2003, 42, 3103–3110 CrossRef.
- H. Song, G. Yang, H. L. Song, X. H. Cui, F. Li and D. D. Yuan, J. Taiwan Inst. Chem. Eng., 2016, 63, 125–132 CrossRef CAS.
- H. Song, Y. Chang, W. Xia, M. Dai, H. Song and Z. Jin, Ind. Eng. Chem. Res., 2014, 53, 5701–5708 CrossRef CAS.
- L. Fei, J. Rui, R. Wang, Y. Lu and X. Yang, RSC Adv., 2017, 7, 23011–23020 RSC.
- C. Marínrosas, L. F. Ramírezverduzco, F. R. Murrietaguevara, G. Hernándeztapia and L. M. Rodríguezotal, Ind. Eng. Chem. Res., 2010, 49, 4372–4376 CrossRef.
- K. M. Doke and E. M. Khan, Rev. Environ. Sci. Bio/Technol., 2013, 12, 25–44 CrossRef CAS.
- J. W. Biggar and M. W. Cheung, Soil Sci. Soc. Am. J., 1973, 37, 863–868 CrossRef CAS.
- J. Sreńsceknazzal, U. Narkiewicz, A. W. Morawski, R. J. Wróbel and B. Michalkiewicz, J. Chem. Eng. Data, 2015, 60, 3148–3158 CrossRef.
- J. F. Porter, G. Mckay and K. H. Choy, Chem. Eng. Sci., 1999, 54, 5863–5885 CrossRef CAS.
- D. W. Marquardt, Jpn. J. Ind. Appl. Math., 1963, 11, 431–441 CrossRef.
- A. Gunay, J. Hazard. Mater., 2007, 148, 708–713 CrossRef CAS PubMed.
- Y. S. Ho, J. F. Porter and G. Mckay, Water, Air, Soil Pollut., 2002, 141, 1–33 CrossRef CAS.
- M. H. Fan, H. Panezai, J. H. Sun, S. Y. Bai and X. Wu, J. Phys. Chem. C, 2014, 118, 23761–23767 CAS.
- H. Song, W. Xia and X. Sun, Can. J. Chem. Eng., 2013, 91, 915–923 CrossRef CAS.
- A. Mohebbi and V. Mohebbi, Fluid Phase Equilib., 2017, 436, 30–37 CrossRef CAS.
- S. Aslam, F. Subhan, Z. Yan, Z. Liu, R. Ullah, U. J. Etim and W. Xing, Chem. Eng. J., 2017, 321, 48–57 CrossRef CAS.
- T. A. Saleh, K. O. Sulaiman, S. A. Al-Hammadi, H. Dafalla and G. I. Danmaliki, J. Cleaner Prod., 2017, 154, 401–412 CrossRef CAS.
- S. Aslam, F. Subhan, Z. Yan, U. J. Etim and J. Zeng, Chem. Eng. J., 2017, 315, 469–480 CrossRef CAS.
- T. Peng, X. Y. Xie, X. Q. Liu, T. Pan, G. Chen, P. F. Chen, J. Y. Zhou, Y. Pan and L. B. Sun, J. Hazard. Mater., 2017, 321, 344–352 CrossRef PubMed.
- E. Salehi, S. S. Madaeni and F. Heidary, Sep. Purif. Technol., 2012, 94, 1–8 CrossRef CAS.
|
| This journal is © The Royal Society of Chemistry 2017 |
Click here to see how this site uses Cookies. View our privacy policy here.  Open Access Article
 *a
*a
![[thin space (1/6-em)]](https://www.rsc.org/images/entities/char_2009.gif) :
:![[thin space (1/6-em)]](https://www.rsc.org/images/entities/char_2009.gif) 1. After the ion exchange was done, the AgY or CuY was filtered and washed thoroughly with deionized water to remove the residual cations. The filtered cake was then dried at 383 K for 6 h and calcinated at 773 K for 4 h. Then the cake was ground into power and stored in a desiccator. The bimetallic zeolites (CuAgY) were prepared by co-exchanging 5 g of NaY in a mixed solution of 250 mL 0.1 mol L−1 AgNO3 and 250 mL 0.1 mol L−1 Cu(NO3)2. The procedures were the same as above. The operations with silver nitrate were performed in a dark environment due to the light sensitivity of silver (Table 1).
1. After the ion exchange was done, the AgY or CuY was filtered and washed thoroughly with deionized water to remove the residual cations. The filtered cake was then dried at 383 K for 6 h and calcinated at 773 K for 4 h. Then the cake was ground into power and stored in a desiccator. The bimetallic zeolites (CuAgY) were prepared by co-exchanging 5 g of NaY in a mixed solution of 250 mL 0.1 mol L−1 AgNO3 and 250 mL 0.1 mol L−1 Cu(NO3)2. The procedures were the same as above. The operations with silver nitrate were performed in a dark environment due to the light sensitivity of silver (Table 1).


![[thin space (1/6-em)]](https://www.rsc.org/images/entities/char_2009.gif) ln
ln![[thin space (1/6-em)]](https://www.rsc.org/images/entities/char_2009.gif) Kp
Kp

![[thin space (1/6-em)]](https://www.rsc.org/images/entities/char_2009.gif) :
:![[thin space (1/6-em)]](https://www.rsc.org/images/entities/char_2009.gif) 1 due to the law of conservation of charge. As shown in Table 4, the ratios of n(2Cu2+ + Na+)/n(Al), n(Ag+ + Na+)/n(Al), and n(2Cu2+ + Ag+ + Na+)/n(Al) are all close to 1. However, the n(Si)/n(Al) ratio increases after preparation. It indicates that the minority of framework aluminum dissolves in ion exchange and high-temperature calcination results in the collapse of zeolite structure.
1 due to the law of conservation of charge. As shown in Table 4, the ratios of n(2Cu2+ + Na+)/n(Al), n(Ag+ + Na+)/n(Al), and n(2Cu2+ + Ag+ + Na+)/n(Al) are all close to 1. However, the n(Si)/n(Al) ratio increases after preparation. It indicates that the minority of framework aluminum dissolves in ion exchange and high-temperature calcination results in the collapse of zeolite structure.
![[thin space (1/6-em)]](https://www.rsc.org/images/entities/char_2009.gif)
![[thin space (1/6-em)]](https://www.rsc.org/images/entities/char_2009.gif)
![[thin space (1/6-em)]](https://www.rsc.org/images/entities/char_2009.gif)
![[thin space (1/6-em)]](https://www.rsc.org/images/entities/char_2009.gif)
![[thin space (1/6-em)]](https://www.rsc.org/images/entities/char_2009.gif)
![[thin space (1/6-em)]](https://www.rsc.org/images/entities/char_2009.gif)
![[thin space (1/6-em)]](https://www.rsc.org/images/entities/char_2009.gif)
![[thin space (1/6-em)]](https://www.rsc.org/images/entities/char_2009.gif)
![[thin space (1/6-em)]](https://www.rsc.org/images/entities/char_2009.gif) Kp against 1/T shown in Fig. 10 and the calculated parameters are listed in Table 10. The negative values of Gibbs free energy change (ΔG0 < 0) indicated that the adsorption of sulphur on CuAgY was a spontaneous process. The value of ΔG0 became more negative with the increasing of temperature indicating that the increase of temperature favored the adsorption. The negative value of ΔH0 manifested that the adsorption was exothermic. The negative entropy ΔS0 indicated a decrease of randomness at the solid-solution interface during adsorption.
Kp against 1/T shown in Fig. 10 and the calculated parameters are listed in Table 10. The negative values of Gibbs free energy change (ΔG0 < 0) indicated that the adsorption of sulphur on CuAgY was a spontaneous process. The value of ΔG0 became more negative with the increasing of temperature indicating that the increase of temperature favored the adsorption. The negative value of ΔH0 manifested that the adsorption was exothermic. The negative entropy ΔS0 indicated a decrease of randomness at the solid-solution interface during adsorption.

![[thin space (1/6-em)]](https://www.rsc.org/images/entities/char_2009.gif) Kp vs. 1/T for the estimation of thermodynamic parameters of sulphur adsorption on CuAGY.
Kp vs. 1/T for the estimation of thermodynamic parameters of sulphur adsorption on CuAGY.


