DOI:
10.1039/C7RA11358G
(Paper)
RSC Adv., 2017,
7, 53463-53471
A facile and viable approach to fabricate polyamide membranes functionalized with graphene oxide nanosheets†
Received
15th October 2017
, Accepted 15th November 2017
First published on 23rd November 2017
Abstract
Recently, graphene oxide (GO) nanosheet modified polyamide reverse osmosis (PA RO) membranes have been widely studied to improve the hydrophilicity and antifouling performance of PA RO membranes. However, a viable strategy for grafting GO nanosheets on the membrane surface remains challenging. In this study, a facile and viable approach to fabricate PA membranes functionalized with GO nanosheets is presented. The strategy is to react the primary amine functional groups of aminated GO (AGO) with the unreacted acid chloride groups of the nascent PA membrane. The successful grafting of AGO nanosheets on a membrane surface was demonstrated by field emission scanning electron microscopy, Raman spectroscopy and X-ray photoelectron spectroscopy. The effects of grafted AGO nanosheets on membrane surface properties were evaluated by contact angle goniometer, atomic force microscopy and electrokinetic analyzer. In addition, the AGO nanosheet dipping concentration was optimized by assessing the desalination performance under brackish water desalination conditions. With 0.15 wt% AGO nanosheet dipping concentration, the resulting surface functionalized membrane showed a water flux of 5.62 L per m2 per h per bar and a salt rejection of 97.9%. Compared to the control PA membrane, the surface functionalized membrane exhibited 45.2% higher water flux and comparable salt rejection. Moreover, the PA membrane functionalized with GO nanosheets showed better antifouling performance.
1 Introduction
The reverse osmosis (RO) process is a widely applied technology for producing freshwater from brackish water, seawater, and wastewater.1 Over the past 30 years, the commercial RO market has been predominated by the polyamide (PA) membrane owing to its good water permeability and high salt rejection.2,3 However, the inherent hydrophobicity of the PA membrane results in dramatically limited water permeability and fouling resistance.4 Graphene oxide (GO) nanosheets bear numerous oxygen functional groups, such as carboxyl and hydroxyl groups.5,6 Recently, GO modified PA RO membranes have been widely studied to improve the hydrophilicity and antifouling performance of PA RO membranes.7–14
Generally, there are two strategies to fabricate GO modified PA RO membranes. One strategy is to add GO into the aqueous phase or organic phase during the interfacial polymerization (IP) process. Chae et al. prepared GO-embedded thin film composite (TFC) RO membranes by dispersing GO in the aqueous phase before the IP process.9 The water flux, anti-biofouling performance, and chlorine resistance were improved. GO nanosheets dispersed in the organic phase were investigated by Yin et al.10 The water permeability of the PA membranes was enhanced due to the interlayer spacing of GO nanosheets. The aforementioned studies confirmed the incorporation of GO into PA matrix was an effective strategy to enhance the water permeability and antifouling performance. However, the poor compatibility of inorganic GO nanosheets with organic PA may lead to defects and affect the salt rejection, presenting a challenge in large-scale membrane manufacturing. Moreover, only few of the GO nanosheets were incorporated into the membrane surface.2–4
Another strategy used is surface modification by coating or grafting. Shao et al. fabricated GO modified PA membrane by spin coating.11 The chlorine resistance was improved due to the protection of GO layer. Choi et al. modified the PA RO membrane by layer-by-layer assembly of GO nanosheets.12 The antifouling performance and chlorine stability were enhanced owing to GO coating layers. Moreover, Huang et al. grafted commercial RO membrane with azide-functionalized GO by UV photoactivation.13 The antibacterial performance was dramatically improved. Perreault et al. functionalized the PA RO membrane with GO nanosheets by three-sequential steps.14 Firstly, carboxylic groups on PA membrane surface were activated. Secondly, ethylene diamine (ED) were reacted with the activated esters. Thirdly, the free amine groups of ED on the PA membrane surface were reacted with the activated GO. The PA membrane functionalized with GO exhibited good bactericidal performance. The aforementioned studies confirmed surface coating or grafting could improve the antifouling performance and enhance the salt rejection. However, the membrane permeability may be sacrificed, revealing a trade-off between water flux and antifouling performance. Moreover, the physical coatings and layer-by-layer assembled coatings will generally be unstable after long-term operation. Grafting by UV photoactivation or carbodiimide activation is difficult to apply in large-scale membrane manufacturing.3,15,16
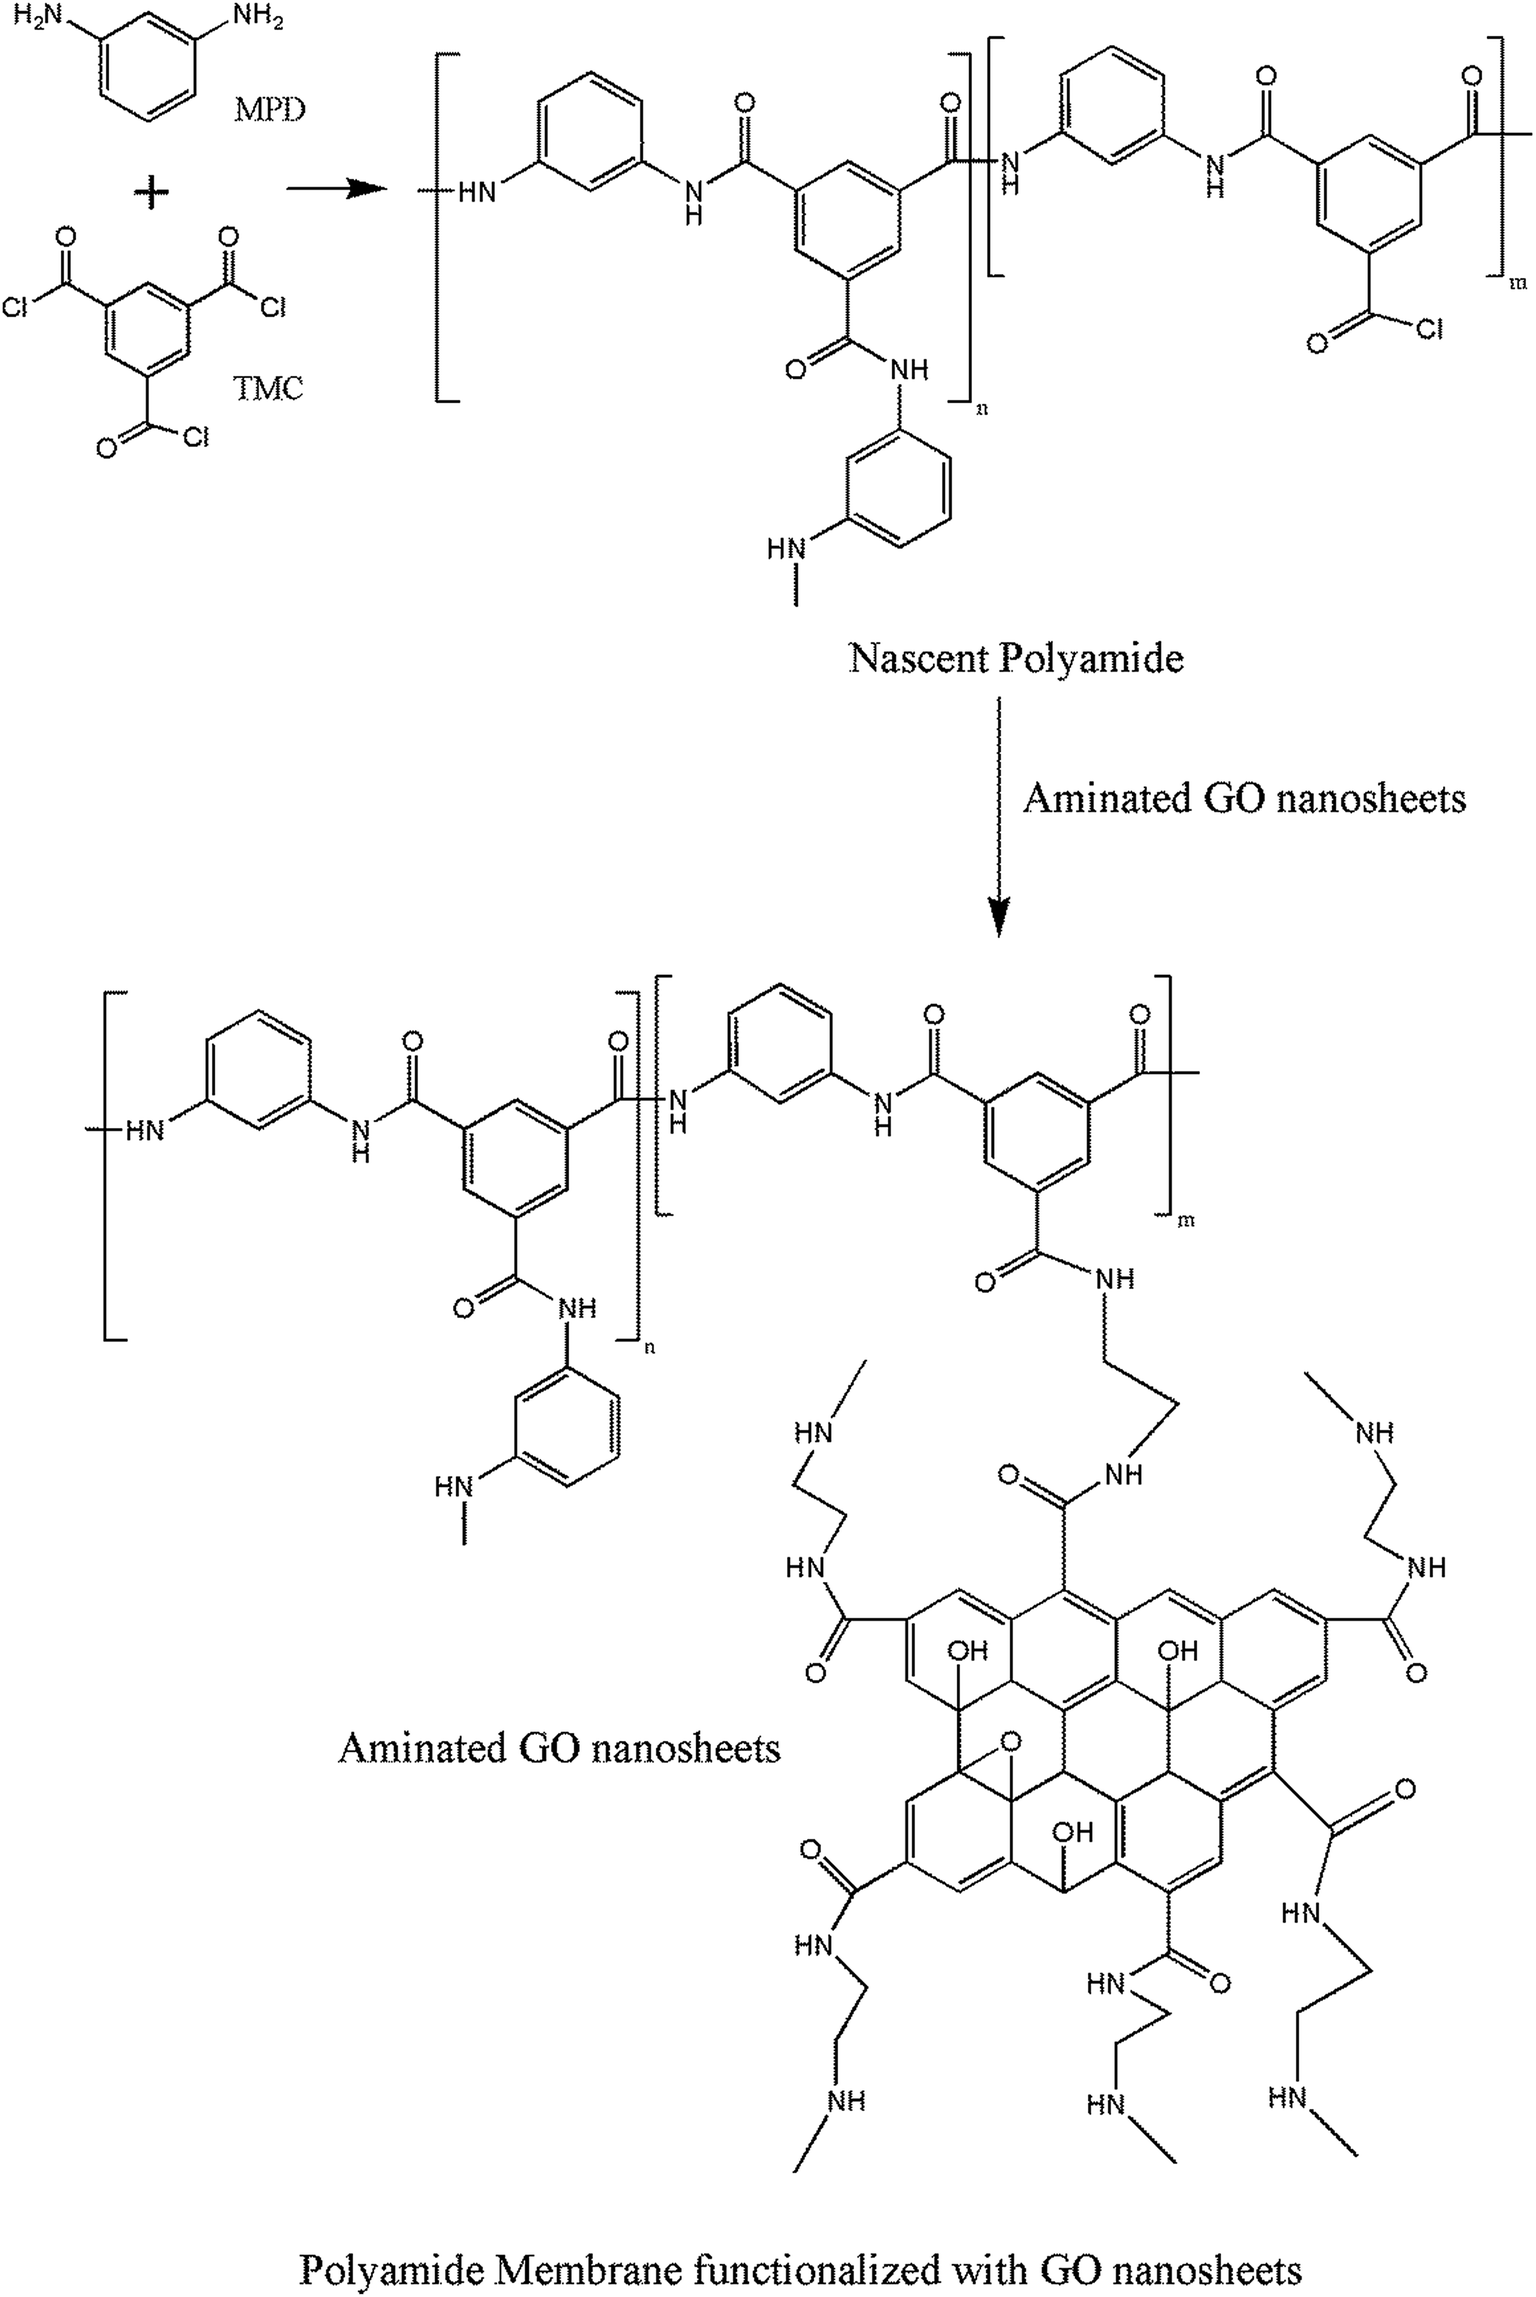
In this study, a facile approach to fabricate PA membranes functionalized with GO nanosheets is presented. The strategy is to react the primary amine functional groups of aminated GO (AGO) with the unreacted acid chloride groups of nascent PA membrane (Fig. 1). The facile approach could combine the advantages of nanomaterials blending approach and surface modification strategy. The purpose is to improve water flux and antifouling performance simultaneously. The successful grafting of AGO nanosheets on the membrane surface was verified by field emission scanning electron microscopy (FESEM), Raman spectroscopy and X-ray photoelectron spectroscopy (XPS). The effects of grafted AGO nanosheets on the membrane surface properties were evaluated by contact angle goniometer, atomic force microscopy (AFM) and electrokinetic analyzer. The AGO nanosheets dipping concentration was optimized by assessing the desalination performance. Furthermore, the antifouling performance of PA membrane functionalized with GO nanosheets was assessed by using tannic acid as the model pollutant, which is a representative natural organic matter in brackish water. Finally, the desalination stability of the PA membranes functionalized with GO nanosheets was determined by a 100 hour test under brackish water desalination conditions.
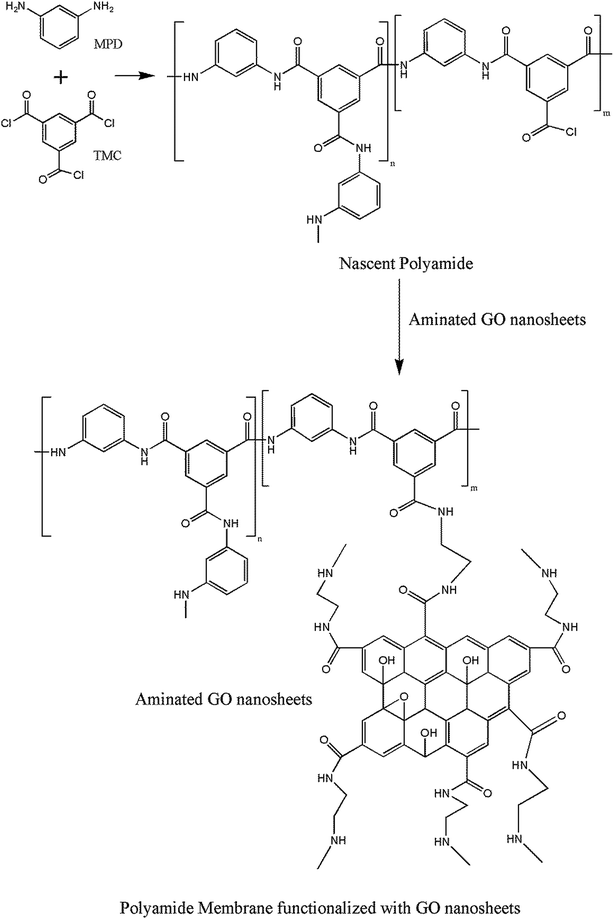 |
| | Fig. 1 Covalent binding of aminated GO nanosheets to the nascent polyamide membrane. | |
2 Experimental section
2.1 Materials
GO nanosheets were purchased from Beijing Dk Nano technology Co., Ltd (Beijing, China). 1-(3-Dimethylaminopropyl)-3-ethylcarbodiimide methiodide (EDC) and ethylenediamine were obtained from Sigma-Aldrich (Shanghai, China). (±)-Camphor-10-sulfonic acid (CSA), m-phenylenediamine (MPD) and trimethylamine (TEA) were supplied from Aladdin (Shanghai, China). Trimesoyl chloride (TMC) was purchased from TCI (Shanghai, China). Isopar G (isoparaffinic solvent) was received from ExxonMobil Chemical (Shanghai, China). Sodium chloride (NaCl), isopropanol (IPA) and ethanol were obtained from Sinopharm (Shanghai, China).
2.2 AGO nanosheets synthesis and characterization
AGO nanosheets were synthesized referring to previously reported method.12,17,18 Firstly, GO nanosheets (0.5 g) were dispersed in ethanol (80 mL) by sonication for 2 h. Secondly, ethylenediamine (5 g) and EDC (0.5 g) were added into the suspension of GO nanosheets. After stirred for 12 h at room temperature, the resulting suspension was centrifuged at 7500 rpm for 10 min. Finally, the resulting AGO nanosheets were washed with RO water 3 times and IPA once. The concentration of AGO nanosheets was measured by the drying method. The morphology of AGO nanosheets was examined by transmission electron microscopy (TEM, HITACHI H-7650). The chemical structure of the AGO nanosheets was analyzed by XPS (ESCALAB 250).
2.3 Fabrication of PA membranes functionalized with GO nanosheets
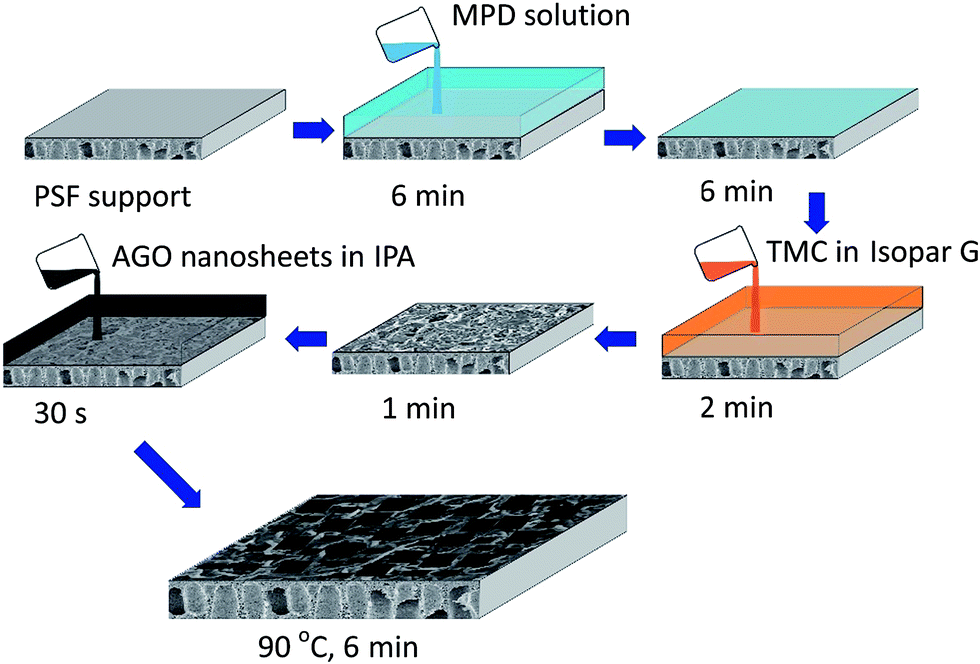
The schematic diagram for fabrication process of PA membranes functionalized with GO nanosheets is shown in Fig. 2. The polysulfone (PSF) support was taped under a custom-tailored 22 cm × 16 cm × 1 cm epoxy resin frame (inner cavity: 19 cm × 13 cm) and then soaked in RO water. About 4 h later, the support under the epoxy resin frame was taken out to remove the excess water upon standing vertically. The aqueous solution containing 2 wt% MPD and 5 wt% CSA–TEA salt was poured on the PSF support and allowed to soak for 6 min. The aqueous solution was poured off and dried for 6 min, while the droplets were absorbed by tissue papers. Subsequently, the organic phase solution of 0.1 wt% TMC in Isopar G was poured on the amine saturated PSF support. The organic phase solution was poured off after 2 min of IP reaction and then drained by standing vertically for 1 min. Afterward, 0.05–0.3 wt% AGO nanosheets in IPA solution was immediately poured on the resulting nascent PA membrane and soaked for 30 s. Finally, the membrane was cured in the oven at 90 °C for 6 min to remove the Isopar G and IPA. The resulting PA membranes functionalized with GO nanosheets were rinsed thoroughly and stored in RO water before testing. The preparation conditions of control PA membrane were identical to that of PA membranes functionalized with GO nanosheets, except for the AGO nanosheets dipping step.
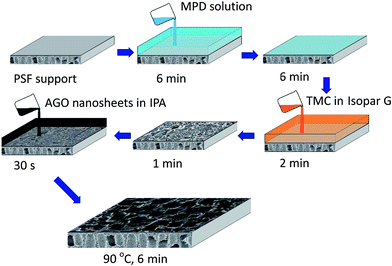 |
| | Fig. 2 Schematic diagram for the fabrication process of PA membranes functionalized with GO nanosheets. | |
2.4 Characterization of PA membrane functionalized with GO nanosheets
Surface morphologies of PA membranes functionalized with GO nanosheets were observed by FESEM (HITACHI S-4800) equipped with an X-ray energy dispersive spectroscope (EDS). Chemical structure of PA membranes functionalized with GO nanosheets was analyzed by Raman spectroscopy (LabRAM Aramis) and XPS (ESCALAB 250). Membrane surface hydrophilicity was evaluated by contact angle goniometer (Krüss DSA 30), while the membrane surface charge and roughness was assessed by electrokinetic analyzer (SurPASS Anton Paar) and AFM (Agilent 5500), respectively.
2.5 Membrane desalination test
Water flux and salt rejection tests were conducted in a cross-flow stainless steel cell (Sterlitech) with an active membrane area of 42 cm2. Synthetic 2000 ppm NaCl solution, which is the standard brackish water RO test condition, was used as the feed solution to simulate brackish water composition. The operating pressure and temperature were controlled at 1.55 MPa and 25 °C, respectively. Both water flux and salt rejection were determined after the membranes were compressed for 3 h, according to the reported method in the literature.19–21 All the water flux and salt rejection results are the average values measured by at least three membrane samples.
2.6 Membrane fouling test
Tannic acid, a representative natural organic matter in brackish water, was used to evaluate the antifouling performance of both control PA membrane and PA membrane functionalized with GO nanosheets. 2000 ppm NaCl solution was first used to measure the initial water flux at 1.55 MPa. After the water flux achieved a steady state, the NaCl solution was changed to tannic acid solution (100 ppm tannic acid and 2000 ppm NaCl). The water flux was recorded for a period of 300 min.
3 Results and discussion
3.1 Physicochemical characteristics of AGO nanosheets
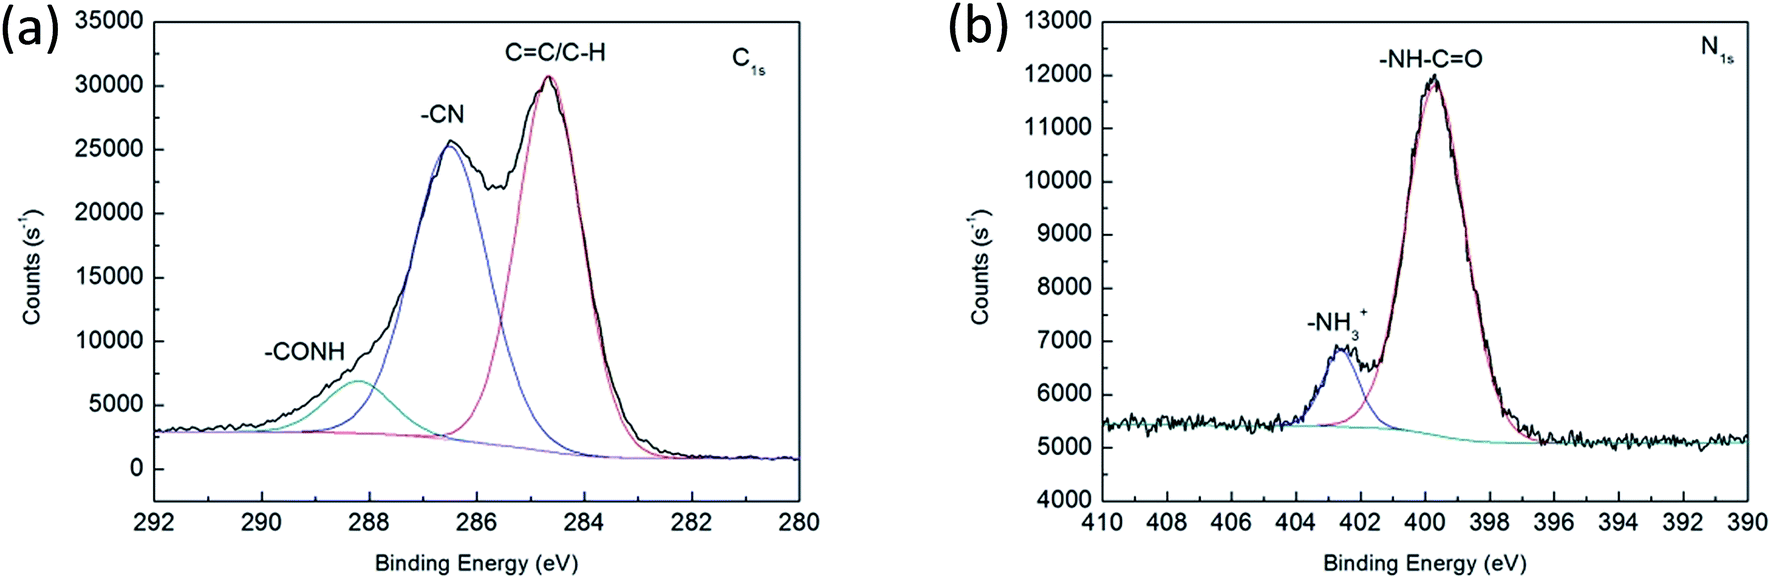
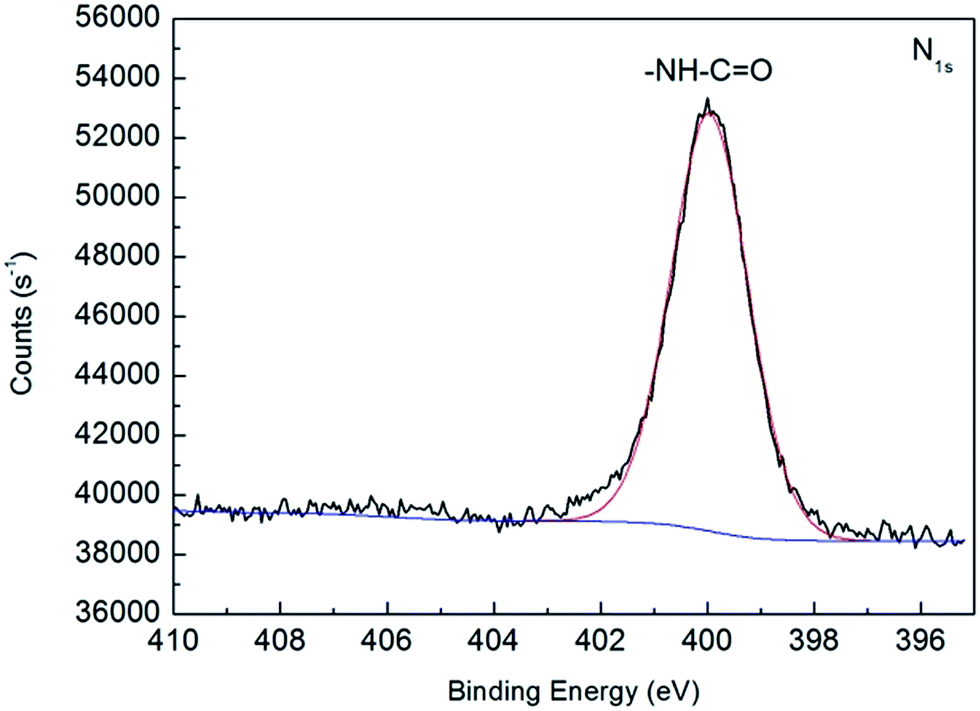
The morphology of AGO nanosheets was examined by TEM. As shown in Fig. 3, the AGO nanosheets exhibited a wrinkled and paper-like structure with 1–5 layers. The size of AGO nanosheets ranged from 500 nm to 3000 nm. The surface functional groups of AGO nanosheets were analyzed by XPS. As shown in Fig. 4, the amines NH2 (NH3+) (286.5 eV in C1s and 402.6 in N1s) and amide bonds N–C![[double bond, length as m-dash]](https://www.rsc.org/images/entities/char_e001.gif) O (288.2 eV in C1s and 399.7 in N1s) were observed.18 The XPS spectra confirmed the successful introduction of primary functional amine groups into GO nanosheets via the formation of amide bonds.
O (288.2 eV in C1s and 399.7 in N1s) were observed.18 The XPS spectra confirmed the successful introduction of primary functional amine groups into GO nanosheets via the formation of amide bonds.
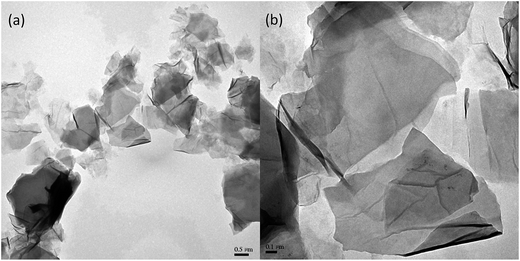 |
| | Fig. 3 TEM images of AGO nanosheets. (a) 0.5 μm scale bar. (b) 0.1 μm scale bar. | |
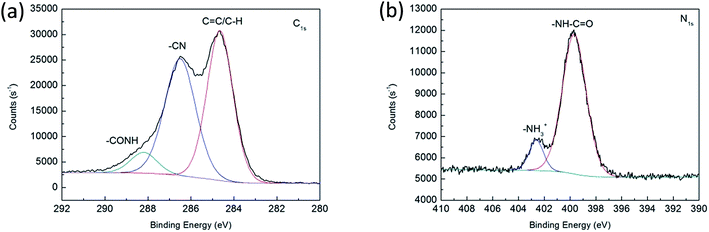 |
| | Fig. 4 XPS spectra of AGO nanosheets. (a) C1s spectra. (b) N1s spectra. | |
3.2 AGO nanosheets irreversibly bind to PA membrane
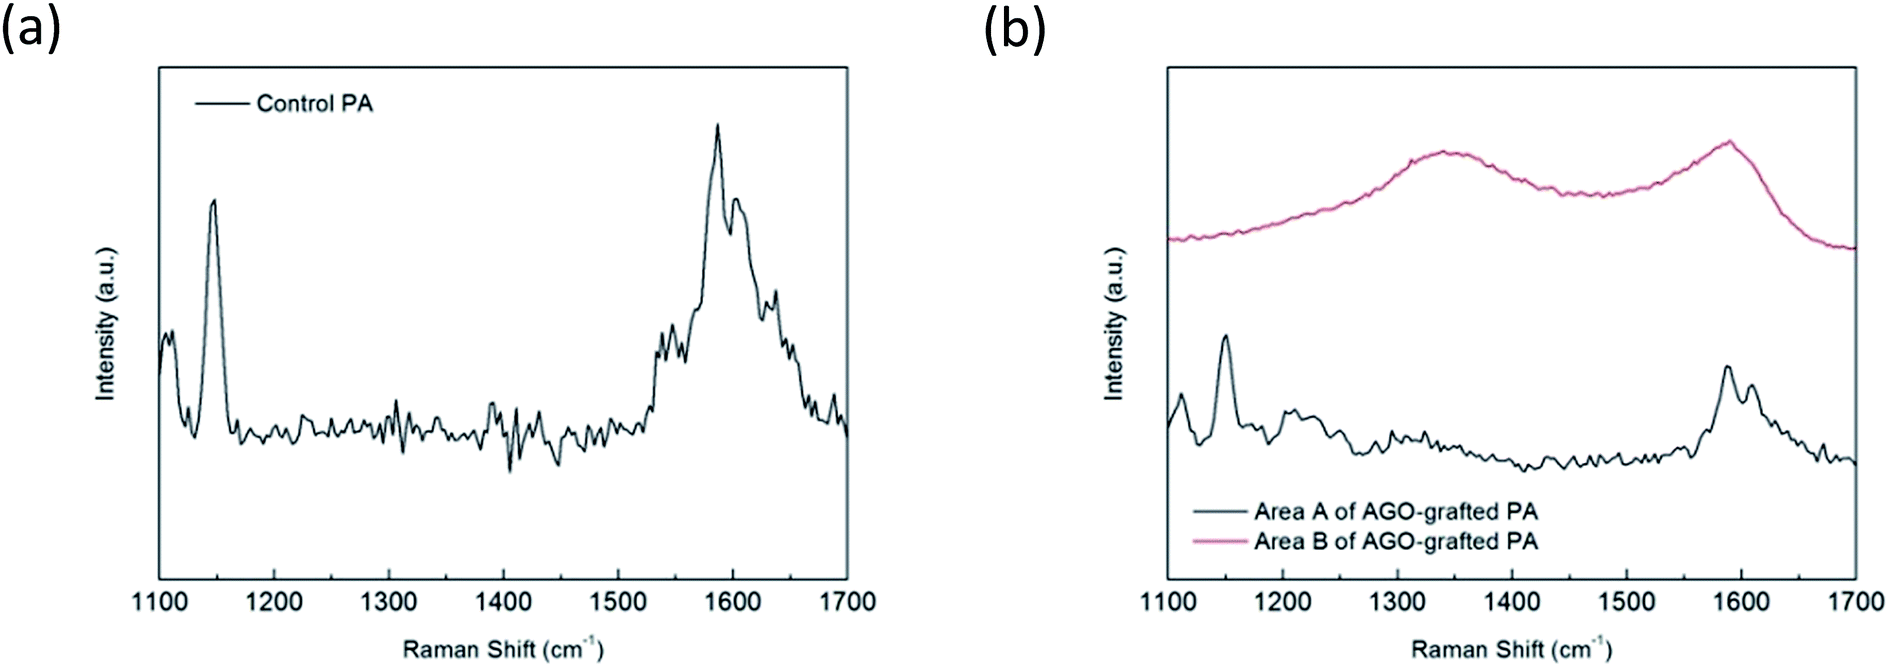
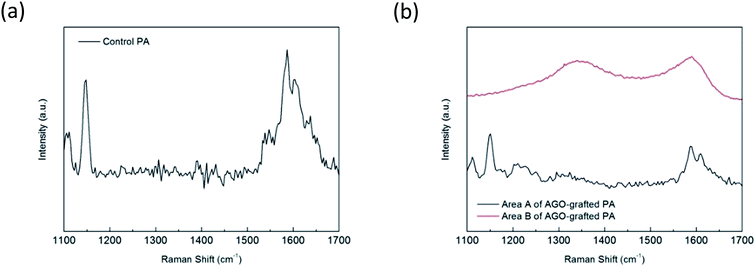
The primary functional amine groups of AGO nanosheets were covalently bonded to the membrane surface by reaction with the unreacted acid chloride groups of nascent PA membrane. The successful grafting of AGO nanosheets on the membrane surface was demonstrated by FESEM, Raman spectroscopy and XPS. Compared to control PA membrane (Fig. 5a), the wrinkled materials covering most of surface area were observed on PA membranes functionalized with AGO nanosheets (Fig. 5b–g). As shown in Fig. 6b, the Raman spectrum of area B suggested the presence of D band (1350 cm−1) and G band (1590 cm−1), which indicated the wrinkled materials were GO nanosheets (Fig. S1†).22 The typical Raman peak of the control PA membrane at 1147 cm−1 (Fig. 6a) disappeared in the area B of surface grafted membrane due to the binding of GO nanosheets. However, the typical Raman peak at 1147 cm−1 originating from the symmetric C–O–C stretching of PSF was observed in the area A of surface grafted membrane,23 which indicated there were still a few surface areas not covered by GO nanosheets. The SEM images and Raman spectra confirmed the good GO nanosheets coverage was achieved by this facile functionalization approach, although there were still a few surface areas not covered by GO nanosheets.
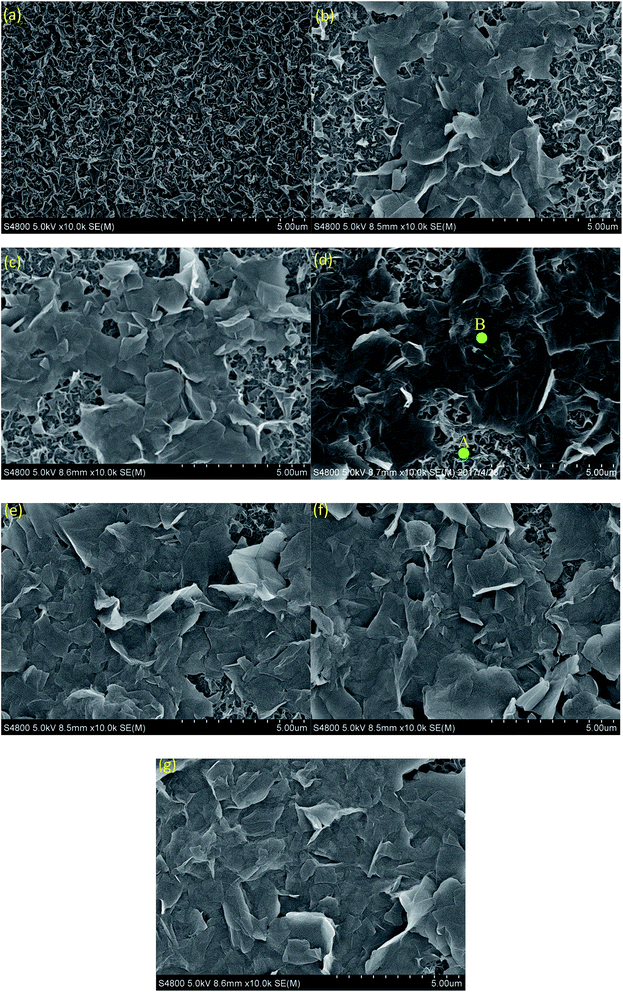 |
| | Fig. 5 SEM images for surface morphologies of (a) control PA and (b–g) PA membrane functionalized with 0.05%, 0.1%, 0.15%, 0.2%, 0.25% and 0.3% AGO dipping concentration, respectively. | |
 |
| | Fig. 6 Raman spectra for (a) control PA and (b) area A and area B of PA membrane functionalized with 0.15% AGO nanosheets. | |
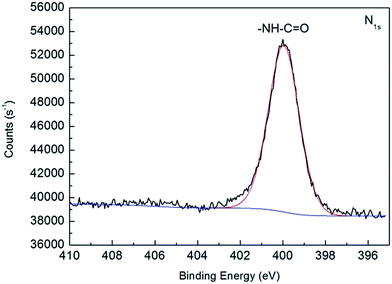
XPS was used to further confirm the successful binding of AGO nanosheets to membrane surface. XPS N1s spectrum of PA membranes functionalized with AGO nanosheets was shown in Fig. 7. Compared to XPS N1s spectra of AGO nanosheets (Fig. 4b), only amide bonds N–CO (399.7 in N1s) were observed on PA membranes functionalized with AGO nanosheets. The XPS spectra confirmed the successful covalent binding of AGO nanosheets to membrane surface via the formation of amide bonds. The relative surface atomic concentrations of AGO nanosheets, control PA membrane and AGO-grafted membrane determined by XPS (Fig. S2†) were shown in Table 1. The oxygen-to-carbon (O/C) ratio of AGO nanosheets (0.289) is higher than that of control polyamide membrane (0.174). Therefore, the O/C ratio of PA membranes functionalized with AGO nanosheets is expected to be higher than that of control polyamide membrane. As expected, the O/C ratio of PA membrane functionalized with AGO nanosheets shows a 27.6% increase relative to that of control PA membrane. Hence, XPS results further demonstrated the successful binding of AGO nanosheets to membrane surface.
 |
| | Fig. 7 XPS N1s spectra of PA membranes functionalized with AGO nanosheets. | |
Table 1 Relative surface atomic concentration of the control PA membrane and PA membrane functionalized with 0.15% AGO nanosheets determined by XPS
| Sample |
Atoms percent (mol%) |
O/C |
| C |
O |
N |
| AGO nanosheets |
71.68 |
20.7 |
7.61 |
0.289 |
| Control polyamide |
75.27 |
13.12 |
11.6 |
0.174 |
| AGO-grafted membrane |
72.89 |
16.15 |
10.95 |
0.222 |
3.3 Surface properties of PA membranes functionalized with AGO nanosheets
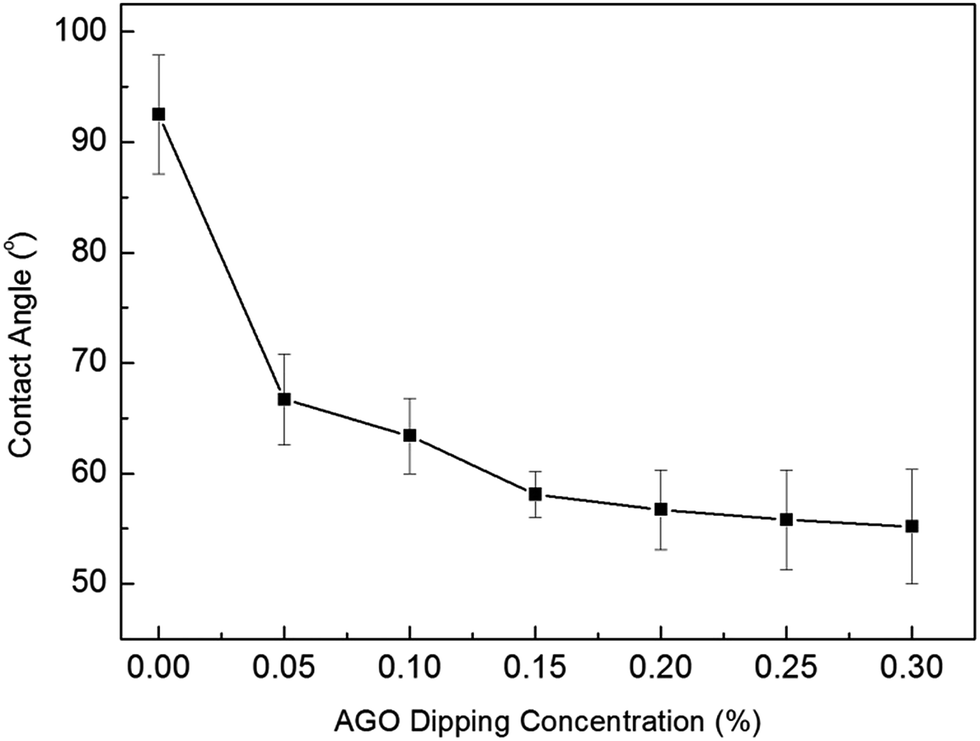
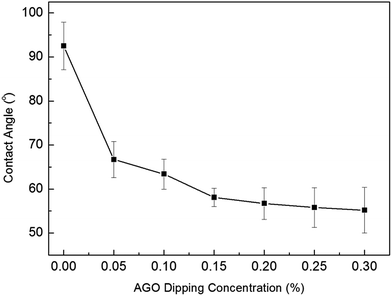
The effect of AGO nanosheets functionalization on the membrane surface hydrophilicity is shown in Fig. 8. The contact angle decreased dramatically from 92.5° to 58.1° as the AGO nanosheets dipping concentration increased from 0 wt% to 0.15 wt%. The obvious decrease of contact angle indicated the surface hydrophilicity of PA membranes functionalized with AGO nanosheets was improved significantly. The effect of AGO nanosheets functionalization on membrane surface roughness is shown in Fig. S3.† The surface roughness was not changed dramatically with the increase in AGO dipping concentration. The control PA membrane and PA membranes functionalized with AGO nanosheets had a root mean squared roughness of about 100 nm, each. Therefore, the significantly improved surface hydrophilicity is attributed to the high hydrophilicity of AGO nanosheets. However, the contact angle changed slightly from 58.1° to 55.2° as the AGO nanosheets dipping concentration increased from 0.15 wt% to 0.3 wt%. The good GO nanosheets coverage of AGO-grafted PA membrane was achieved in the membrane surface grafted with 0.15 wt% AGO dipping concentration (Fig. 5d). With further increase of AGO nanosheets dipping concentration, the GO nanosheets coverage was not improved significantly (Fig. 5e–g). Therefore, the contact angle changed slightly with further increase of AGO nanosheets.
 |
| | Fig. 8 The contact angles of PA membranes functionalized with different AGO nanosheets dipping concentration. | |
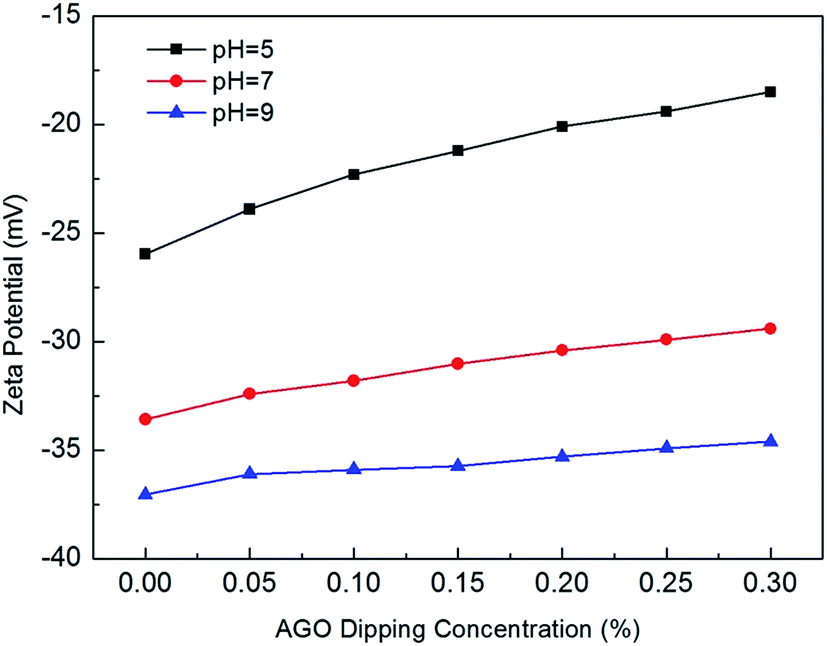
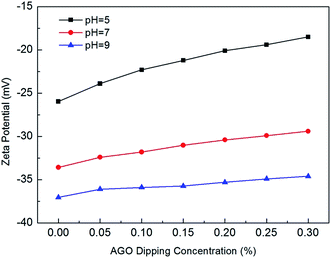
The effect of AGO nanosheets functionalization on membrane surface charge is presented in Fig. 9. Compared with control PA membrane, the PA membranes functionalized with AGO nanosheets were less negatively charged. Moreover, the negative zeta potential decreased with the increase of AGO dipping concentration. There were two reasons for the less negative zeta potential of PA membranes functionalized with AGO nanosheets. First, the chemical reaction between primary amine functional groups of AGO nanosheets and the unreacted acid chloride groups of nascent PA membrane decreased the surface density of acid chloride groups, thus the surface carboxyl groups generated by the hydrolyzation of acid chloride groups decreased.24 Therefore, the subsequent decrease of carboxyl group density led to a less negative zeta potential of PA membranes functionalized with AGO nanosheets. Secondly, since the AGO nanosheets are positively charged,12,17,18 the surface functionalization with AGO nanosheets will result in the less negative zeta potential.
 |
| | Fig. 9 Zeta potential of PA membranes functionalized with different AGO nanosheets dipping concentration at pH = 5, pH = 7 and pH = 9. | |
3.4 Effects of AGO nanosheets dipping concentration on desalination performance
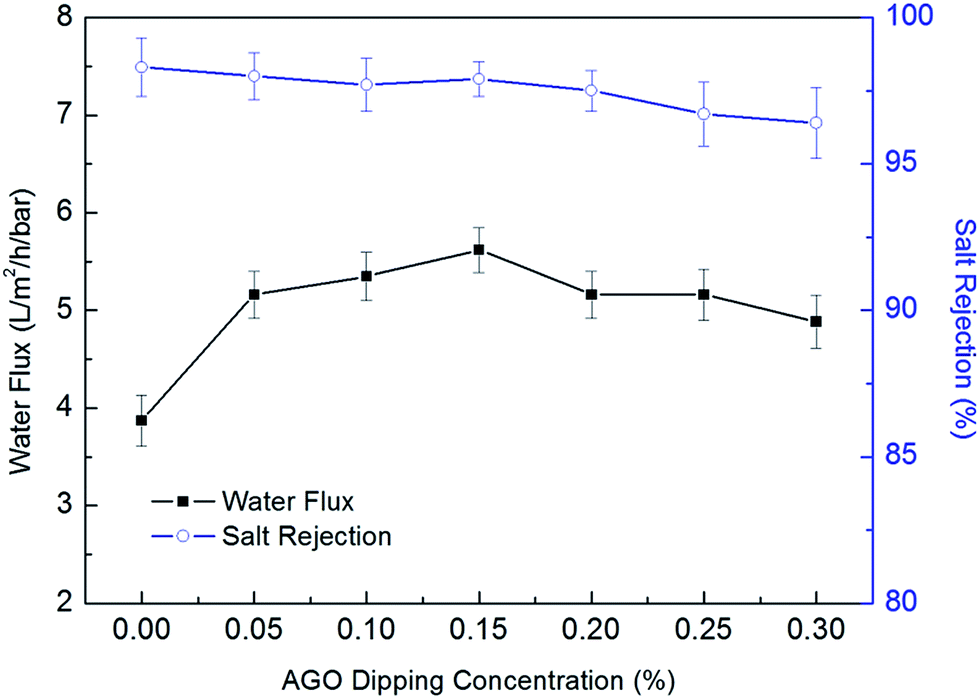
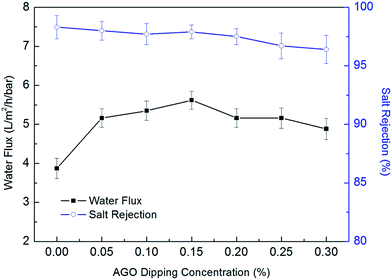
Effects of AGO nanosheets dipping concentration on desalination performance are depicted in Fig. 10. The water flux was improved dramatically from 3.87 ± 0.26 L per m2 per h per bar to 5.62 ± 0.23 L per m2 per h per bar as the AGO nanosheets concentration increased from 0 wt% to 0.15 wt% in IPA solution, while the salt rejection slightly changed from 98.3 ± 1.0% to 97.9 ± 0.6%. The significantly improved surface hydrophilicity by surface functionalization led to great improvement of the water flux.25 However, the water flux decreased with further increase of AGO nanosheets concentration. The surface hydrophilicity changed slightly with further increase of AGO nanosheets. However, the hydraulic resistance of surface grafting layer increased. Therefore, the water flux decreased with further increase of AGO nanosheets dipping concentration. As a result, the optimal AGO nanosheets concentration was 0.15 wt%.
 |
| | Fig. 10 Effects of AGO nanosheets dipping concentration on desalination performance. | |
The AGO-grafted PA membrane fabricated by the facile functionalization approach was compared with the other PA RO membranes reported in the literature and a state-of-the-art commercial membrane. As presented in Table 2, the water flux of AGO-grafted PA membrane is much higher than that of other PA RO membranes reported in the literature and the state-of-the-art commercial Dow-BW30 membrane with comparable salt rejection.
Table 2 Comparison of desalination performance of AGO-grafted PA membrane fabricated by the facile functionalization approach with the other PA RO membranes reported in the literature and a state-of-the-art commercial membrane
| Membranesa |
Water flux (LMH/bar) |
Salt rejection (%) |
References |
| All membranes were tested under brackish water desalination conditions. |
| AGO-grafted PA |
5.62 |
97.9 |
This work |
| AS–GO–TFC |
∼2.58 |
∼99 |
Chae7 |
| TFC/GO membrane |
1.97 |
≥97 |
Ali8 |
| GO10-coated PA |
0.9 |
96.4 |
Choi12 |
| AGO-RO |
2.34 |
95.3 |
Huang13 |
| PA-CNTa/GO |
3.80 |
96.21 |
Kim26 |
| CNT-PA/PSf TFC |
3.41 |
98.5 |
Lee27 |
| TFN-ZIF-8 |
3.35 |
98.5 |
Duan28 |
| MOF/PSF-PA |
3.03 |
96 |
Park29 |
| o-CNT/PSF-PA |
3.03 |
97.7 |
Lee30 |
| Dow-BW30 |
3.41 |
98.3 |
This work |
3.5 Antifouling performance of PA membrane functionalized with AGO nanosheets
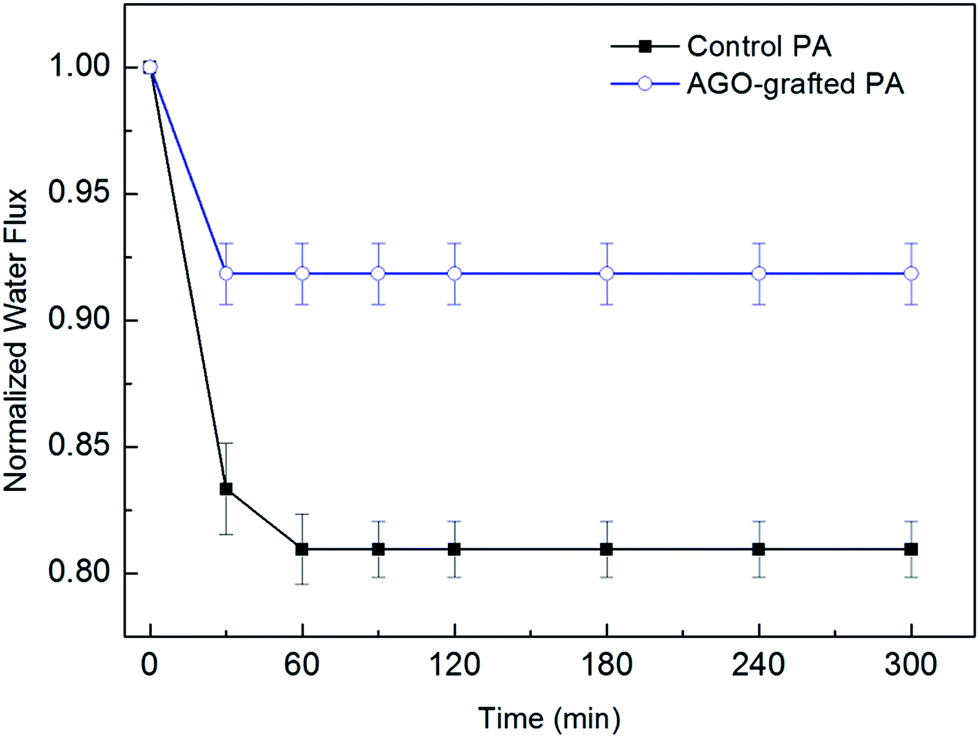
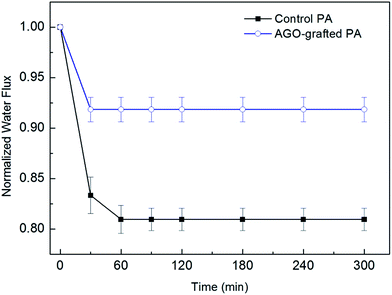
The effects of tannic acid fouling on the water flux of the control PA membrane and PA membrane functionalized with 0.15% AGO dipping concentration were shown in Fig. 11. Fouling of both control PA membrane and AGO-grafted membrane took place during the first one hour and did not further deteriorate after one hour. Similar phenomenon was also observed by Zhao et al. and Dong et al.19,31 Moreover, the water flux of the control PA membrane decreased by 19.1% in the presence of 100 ppm tannic acid after 300 minute test. On the contrary, the AGO-grafted membrane showed a small water flux decrease of 8.2%. The fouling resulted from the hydrophobic–hydrophobic affinity between tannic acid and PA membrane surface,19 which have similar aromatic rings structure. Therefore, the significant enhancement of antifouling performance after surface functionalization was attributed to the remarkably improved surface hydrophilicity.32
 |
| | Fig. 11 Variation in normalized water flux of control PA membrane and PA membrane functionalized with 0.15% AGO dipping concentration after tannic acid fouling. | |
3.6 Durability of PA membrane functionalized with AGO nanosheets
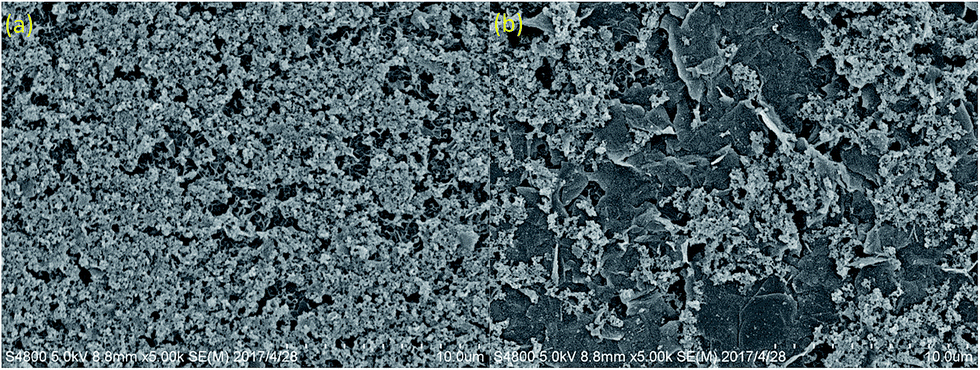
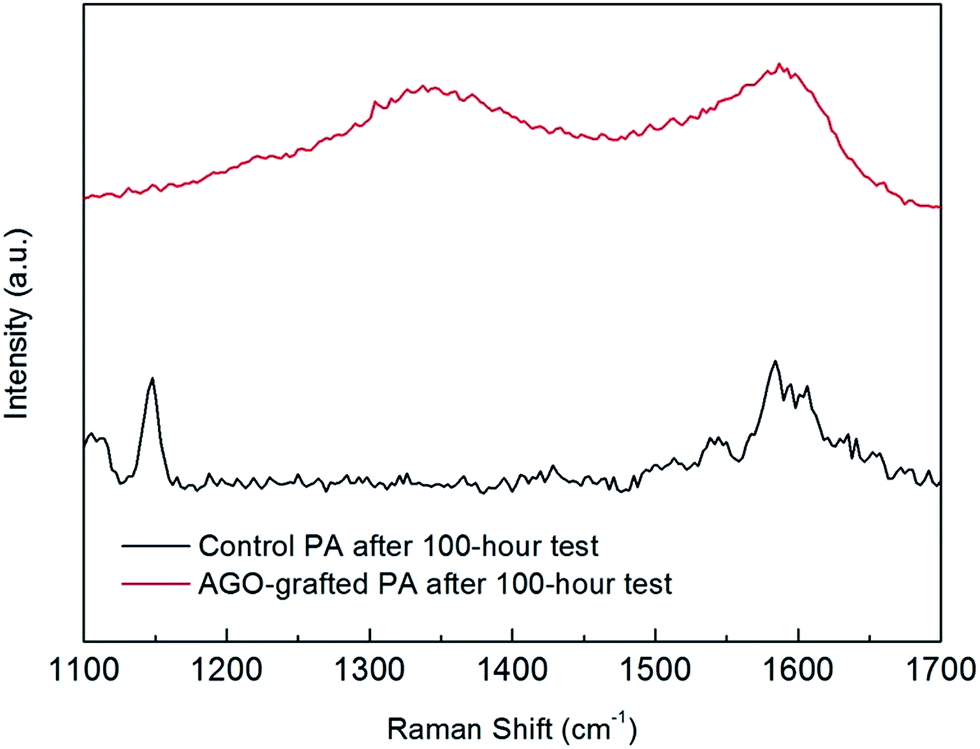
The stability of the covalent bond by the facile functionalization approach was demonstrated by FESEM and Raman spectroscopy within a 100 hour test under brackish water desalination conditions. As presented in Fig. 12b, GO nanosheets could be clearly visualized as wrinkled materials covering the PA membrane functionalized with AGO nanosheets. Furthermore, as shown in Fig. 13, the Raman spectrum of AGO-grafted PA membrane after the 100 hour test still showed the D band (1350 cm−1) and G band (1590 cm−1) of GO nanosheets. Both the SEM images and Raman spectra after the 100 hour test demonstrated the excellent stability of covalent binding by the facile functionalization approach.
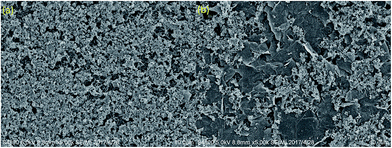 |
| | Fig. 12 SEM images for surface morphologies of (a) control PA membrane and (b) PA membrane functionalized with 0.15% AGO dipping concentration after 100 hour test. | |
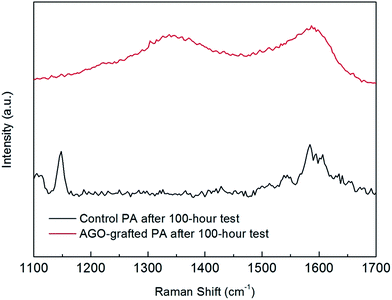 |
| | Fig. 13 Raman spectra for control PA membrane and PA membrane functionalized with 0.15% AGO nanosheets dipping concentration after 100 hour test. | |
4 Conclusions
The covalent binding of GO nanosheets to PA RO membrane was successfully fabricated by a facile and viable approach. The approach required only 30 s AGO dipping time at ambient conditions, and without the conversion of the carboxyl groups on the PA layer. The membrane surface hydrophilicity was improved significantly by AGO nanosheets functionalization. Moreover, the surface functionalization with AGO nanosheets resulted in the less negative surface charge. With 0.15 wt% AGO nanosheets dipping concentration, the resulting surface functionalized membrane showed a water flux of 5.62 L per m2 per h per bar and a salt rejection of 97.9%, which outperformed the control PA membrane with 45.2% increase in water flux. In addition, PA membrane functionalized with GO nanosheets showed better antifouling performance compared to control PA membrane.
Conflicts of interest
There are no conflicts to declare.
Acknowledgements
The authors thank the reviewers for their valuable comments. The authors thank Hongyun Ren for TEM and SEM measurements. The authors thank Olusegun K. Abass for English revision. We acknowledge the National Natural Science Foundation of China (Grant No. 51408581), Natural Science Foundation of Fujian Province (Grant No. 2016J05143), Bureau of International Cooperation, CAS (132C35KYSB20160018) and Bureau of Frontier Sciences & Education, CAS (QYZDB-SSW-DQC044) for the financial support of this work.
References
- M. Elimelech and W. A. Phillip, Science, 2011, 333, 712–717 CrossRef CAS PubMed.
- D. Li, Y. Yan and H. Wang, Prog. Polym. Sci., 2016, 61, 104–155 CrossRef CAS.
- R. Zhang, Y. Liu, M. He, Y. Su, X. Zhao, M. Elimelech and Z. Jiang, Chem. Soc. Rev., 2016, 45, 5888–5924 RSC.
- W. J. Lau, S. Gray, T. Matsuura, D. Emadzadeh, J. P. Chen and A. F. Ismail, Water Res., 2015, 80, 306–324 CrossRef CAS PubMed.
- M. Hu and B. Mi, Environ. Sci. Technol., 2013, 47, 3715–3723 CrossRef CAS PubMed.
- D. A. Dikin, S. Stankovich, E. J. Zimney, R. D. Piner, G. H. B. Dommett, G. Evmenenko, S. T. Nguyen and R. S. Ruoff, Nature, 2007, 448(7152), 457–460 CrossRef CAS PubMed.
- H.-R. Chae, C.-H. Lee, P.-K. Park, I.-C. Kim and J.-H. Kim, J. Membr. Sci., 2017, 525, 99–106 CrossRef CAS.
- M. E. A. Ali, L. Wang, X. Wang and X. Feng, Desalination, 2016, 386, 67–76 CrossRef CAS.
- H.-R. Chae, J. Lee, C.-H. Lee, I.-C. Kim and P.-K. Park, J. Membr. Sci., 2015, 483, 128–135 CrossRef CAS.
- J. Yin, G. Zhu and B. Deng, Desalination, 2016, 379, 93–101 CrossRef CAS.
- F. Shao, L. Dong, H. Dong, Q. Zhang, M. Zhao, L. Yu, B. Pang and Y. Chen, J. Membr. Sci., 2017, 525, 9–17 CrossRef CAS.
- W. Choi, J. Choi, J. Bang and J.-H. Lee, ACS Appl. Mater. Interfaces, 2013, 5, 12510–12519 CAS.
- X. Huang, K. L. Marsh, B. T. McVerry, E. M. V. Hoek and R. B. Kaner, ACS Appl. Mater. Interfaces, 2016, 8, 14334–14338 Search PubMed.
- F. Perreault, M. E. Tousley and M. Elimelech, Environ. Sci. Technol. Lett., 2014, 1, 71–76 CrossRef CAS.
- D. J. Miller, D. R. Dreyer, C. W. Bielawski, D. R. Paul and B. D. Freeman, Angew. Chem., Int. Ed., 2017, 56, 4662–4711 CrossRef CAS PubMed.
- D. Rana and T. Matsuura, Chem. Rev., 2010, 110, 2448–2471 CrossRef CAS PubMed.
- D. W. Lee, T. K. Hong, D. Kang, J. Lee, M. Heo, J. Y. Kim, B. S. Kim and H. S. Shin, J. Mater. Chem., 2011, 21, 3438–3442 RSC.
- S. W. Lee, B.-S. Kim, S. Chen, Y. Shao-Horn and P. T. Hammond, J. Am. Chem. Soc., 2009, 131, 671–679 CrossRef CAS PubMed.
- L. Zhao, P. C.-Y. Chang, C. Yen and W. S. W. Ho, J. Membr. Sci., 2013, 425–426, 1–10 CAS.
- L. Zhao, P. C.-Y. Chang and W. S. W. Ho, Desalination, 2013, 308, 225–232 CrossRef CAS.
- L. Zhao and W. S. W. Ho, J. Membr. Sci., 2014, 455, 44–54 CrossRef CAS.
- F. Perreault, H. Jaramillo, M. Xie, M. Ude, L. D. Nghiem and M. Elimelech, Environ.
Sci. Technol., 2016, 50, 5840–5848 CrossRef CAS PubMed.
- A. F. Faria, C. Liu, M. Xie, F. Perreault, L. D. Nghiem, J. Ma and M. Elimelech, J. Membr. Sci., 2017, 525, 146–156 CrossRef CAS.
- X. Lu, S. R.-V. Castrillón, D. L. Shaffer, J. Ma and M. Elimelech, Environ. Sci. Technol., 2013, 47, 12219–12228 CrossRef CAS PubMed.
- A. Sotto, A. Boromand, S. Balta, J. Kim and B. V. D. Bruggen, J. Mater. Chem., 2011, 21, 10311–10320 RSC.
- H. J. Kim, M. Y. Lim, K. H. Jung, D. G. Kim and J. C. Lee, J. Mater. Chem. A, 2015, 3, 6798–6809 CAS.
- H. D. Lee, H. W. Kim, Y. H. Cho and H. B. Park, Small, 2014, 10, 2653–2660 CrossRef CAS PubMed.
- J. Duan, Y. Pan, F. Pacheco, E. Litwiller, Z. Lai and I. Pinnau, J. Membr. Sci., 2015, 476, 303–310 CrossRef CAS.
- H. M. Park, K. Y. Jee and Y. T. Lee, J. Membr. Sci., 2017, 541, 510–518 CrossRef CAS.
- T. H. Lee, M. Y. Lee, H. D. Lee, J. S. Roh, H. W. Kim and H. B. Park, J. Membr. Sci., 2017, 539, 441–450 CrossRef CAS.
- H. Dong, L. Wu, L. Zhang, H. Chen and C. Gao, J. Membr. Sci., 2015, 494, 92–103 CrossRef CAS.
- A. Tiraferri, Y. Kang, E. P. Giannelis and M. Elimelech, Environ. Sci. Technol., 2012, 46, 11135–11144 CrossRef CAS PubMed.
Footnote |
| † Electronic supplementary information (ESI) available. See DOI: 10.1039/c7ra11358g |
|
| This journal is © The Royal Society of Chemistry 2017 |
Click here to see how this site uses Cookies. View our privacy policy here. 
 Open Access Article
 This Open Access Article is licensed under a
  and
Kaisong Zhang*
and
Kaisong Zhang*