
 Open Access Article
 This Open Access Article is licensed under a
 Creative Commons Attribution 3.0 Unported Licence
Denitrification of groundwater using a biodegradable polymer as a carbon source: long-term performance and microbial diversity
Libing Chua and
Jianlong Wang *ab
*ab
aCollaborative Innovation Center for Advanced Nuclear Energy Technology, INET, Tsinghua University, Energy Science Building, Beijing 100084, P. R. China. E-mail: wangjl@tsinghua.edu.cn; Fax: +86 10 62771150; Tel: +86 10 62784843
bBeijing Key Laboratory of Radioactive Waste Treatment, Tsinghua University, Beijing 100084, P. R. China
First published on 21st November 2017
Abstract
Nitrate pollution in groundwater is a worldwide problem. This paper reports on the denitrifying performance of using the biodegradable polymer polybutylene succinate (PBS) as a biofilm medium and carbon source to remove nitrate from groundwater via a packed bed bioreactor which was operated continuously for nearly 2 years. Results showed that the effluent nitrate concentration reached 3.3–8.8 mg L−1 and 88–97% of nitrate removal was achieved. The denitrification rate range was 0.25–0.35 g N per L per d at 20–29 °C and decreased to 0.12 g N per L per d at 10–18 °C. According to microelectrode analysis, the nitrate consumption rate (1069 ± 103 μmol cm−1 h−1) was much higher than the ammonium production rate (74 ± 7 μmol cm−1 h−1), which proved that denitrification plays the major role in the system. A low level of DOC (1.7 ± 0.6 mg L−1) and ammonium (0.5 ± 0.3 mg L−1) was observed in the effluent, which was beneficial for practical application. The consumption rate of PBS was 2.75 ± 0.72 g PBS/g NO3–Nremoved. In the attached biofilm, Proteobacteria, Betaproteobacteria, Burkholderiales and Comamonadaceae were the major phyla (75.6%), classes (59.8%), orders (42.3%) and families (42.2%) in each level. In the top 20 genera accounting for 25% of total sequences, 9 genera including Simplicispira, Comamonadaceae, Hydrogenophaga and Rhodocyclaceae were affiliated with denitrifying groups with an abundance of 16%, whereas the bacteria belonging to the other 11 genera including Veillonellaceae, Propionivibrio and Bdellovibrio were reported to have the function of degradation and acidification of organic substance and might serve for degrading PBS in the system. The PBS solid-phase denitrification is promising for removing nitrate from groundwater.
Introduction
Nitrate is naturally present in the environment as part of the nitrogen cycle. However, anthropogenic inputs, such as the agricultural application of nitrogenous fertilizers and wastewater emission, have greatly increased the nitrate loads in receiving waters, leading to potential risks to the shallow and deep groundwater aquifers.1–3 Drinking nitrate-contaminated groundwater has the risks of methaemoglobinaemia for infants and stomach cancer.4 The maximum permissible level of nitrate in drinking water was set as 10 mg N per L by the U.S. Environmental Protection Agency5 and in the standard for drinking water quality of China (GB 5749-2006) to reduce the risks to human health.Compared to the methods commonly used for nitrate removal such as ion-exchange, distillation, reverse osmosis and electrodialysis, heterotrophic biological denitrification is a cost-effective and practical on large-scale technology.6 The denitrifying microbes utilize organic substrates such as methanol, glucose and acetic acid that serve as electron donor and energy source, and convert nitrate into nitrogen gas under anoxic conditions.7,8
In recent years, solid-phase denitrification, which uses water insoluble solid materials as carbon substrates for denitrification and biofilm media, has been developed to eliminate nitrate from groundwater in situ or ex situ,9–11 aquaculture effluent,12,13 and biologically treated effluent.14 There exist two kinds of solid carbon source: the natural plant materials such as woodchips, straws and reeds15,16 and the synthetic biodegradable polymers such as polycaprolactone (PCL), polybutylene succinate (PBS), polylactic acid and polyhydroxyalkanoate.17–22
Healy et al.11 investigated nitrate removal from groundwater by solid-phase denitrification using woodchips, pine needles, barley straw and cardboard, respectively as carbon source and media. The nitrate removal efficiency reached 67–89% at steady-state operation and the bioreactor filled with woodchips demonstrated less adverse effects such as dissolved organic carbon (DOC) release. Gibert et al.23 built a permeable reactive barrier filled with softwood for in situ groundwater remediation. More than 98% of nitrate removal was obtained with the denitrification rate of 0.067 mg N per L per d per gsubstrate. Wu et al.24 reported that the nitrate removal reached 95% in a solid-phase denitrification system using PBS as carbon source to treat drinking water at 25 °C. Boley et al.25 studied the treatment of wastewater from a recirculating aquaculture system with eels by a fluidized bed reactor filled with PCL for denitrification carbon source. The effluent nitrate concentration remained at low levels of 3–10 mg N per L, whereas a nitrate accumulation of 200 mg N per L was observed in the control system without denitrification treatment.
Solid-phase denitrification using biopolymers as carbon source is especially attractive in groundwater treatment due to the good and stable denitrifying performance and effluent quality such as low levels of DOC and color release.26 The high production cost of the biopolymers is the major factor to limit its application. Among the biopolymers available, PBS denitrification is drawing increasingly attention owing to the good biodegradability and economics.24,27 In addition, most studies related to biopolymer solid-phase denitrification are operated in batch mode or continuously for a short time (3–8 months). For commercial application, the denitrifying performance and degradation properties of biopolymers during a long-term run should be studied.
In the present study, a PBS-packed bioreactor was established to eliminate nitrate in groundwater. The long-term performance of the bioreactor for nearly 2 years was evaluated in terms of nitrate removal, denitrification rate, and the quality of the treated groundwater. The characteristics of PBS degradation and the biofilm attached as well as the bacterial community were analyzed. The results of this study could enrich our understanding on solid-phase denitrification and provide a reference for its practical application in the management of groundwater nitrate pollution.
Materials and methods
PBS media
The granules of PBS used are cylindrical with an average diameter of 3.0 mm. The density and specific surface are 1.24 kg L−1 and 0.826 m2 g−1, respectively. The chemical structure of PBS is as follows: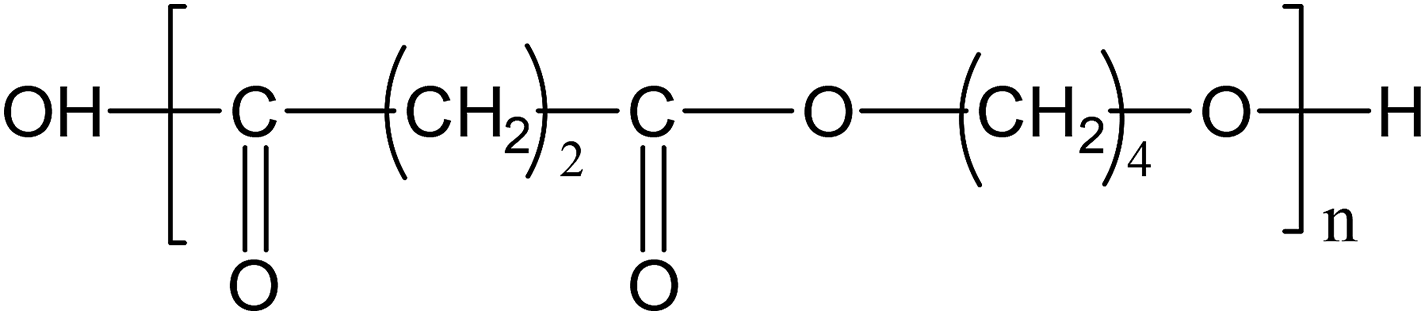
Experimental set-up and procedures
A packed bed reactor consisting of a cylindrical Plexiglas vessel (working volume 3.0 L) was established (Fig. 1). The packing ratio of PBS granules was 56.3% (v/v). A sieve was inserted into the reactor to prevent washout of PBS granules. Influent was continuously pumped into the bottom of reactor and effluent was discharged from overflow. The denitrification reactor was seeded with anoxic sludge collected from a municipal wastewater treatment plant with the concentration of 1500 mg total suspended solids (TSS) per L. The initial hydraulic retention time (HRT) was 41 h and temperature was 20 °C. During the long-term operation of nearly 2 years, the temperature fluctuated in the range of 29–10 °C with the seasons (Fig. 2). The HRT was decreased gradually to 4.5 h and then varied in 5.6–13 h, depending on the performance of the reactor at different temperatures. Samples were periodically taken throughout the experiment to evaluate NO3–N, NO2–N and NH4–N and DOC content in the effluent. Biofilm samples were taken at about 500 days to do DNA extraction, PCR amplification and pyrosequencing.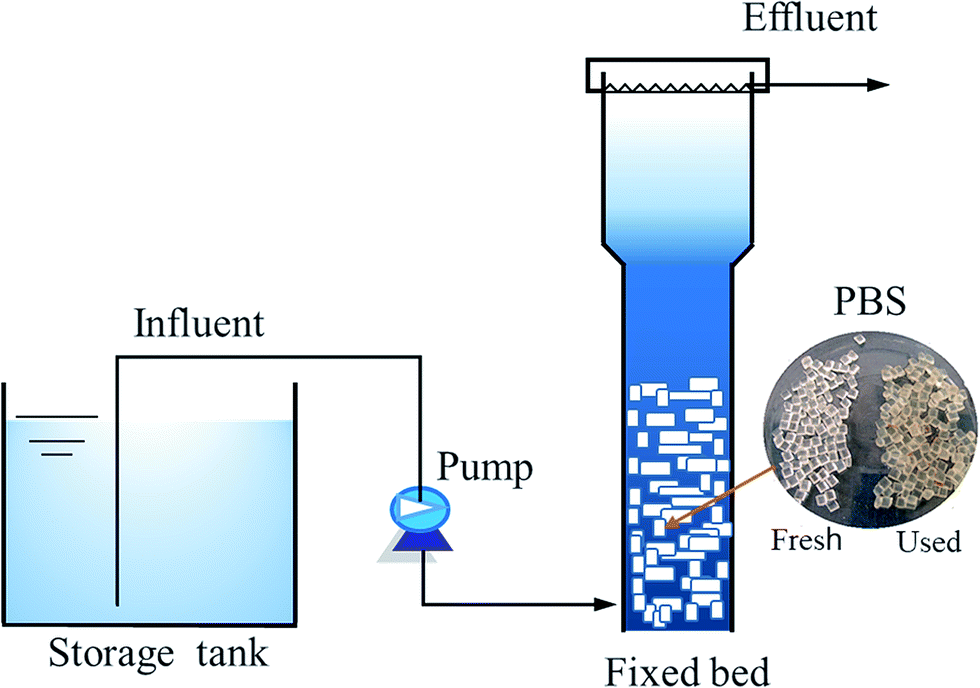 | ||
| Fig. 1 The schematic diagram of the experimental set-up. | ||
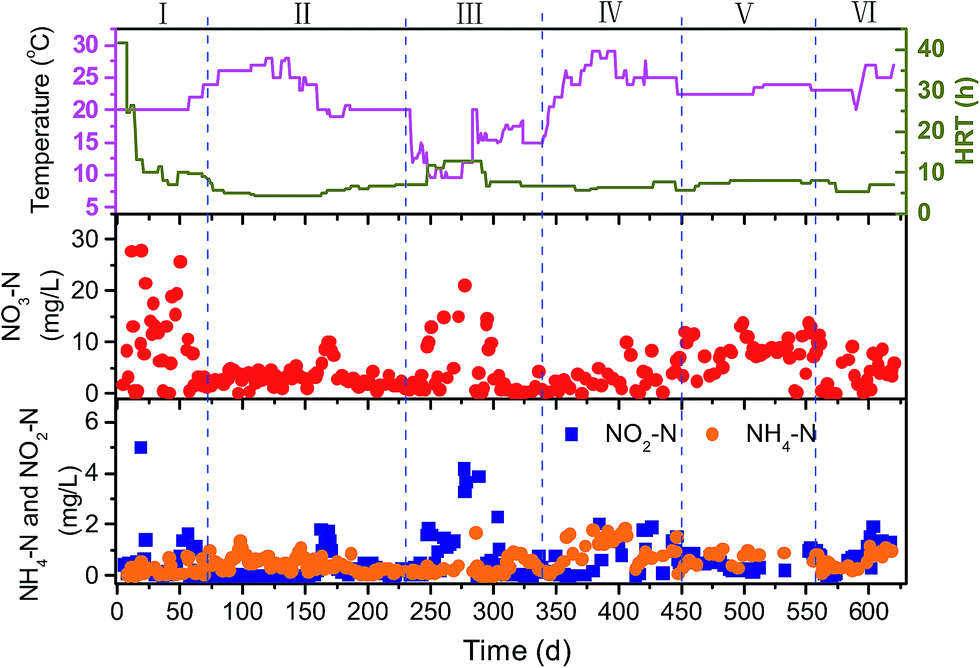 | ||
| Fig. 2 Variation of temperature, HRT and effluent nitrogen concentrations with time. | ||
Influent characteristics
The groundwater was exploited from Changping district, Beijing. The content of NO3–N, NO2–N and NH4–N and DOC were 10–13 mg L−1, less than 0.09 mg L−1, 0.17 mg L−1 and 0.3 mg L−1, respectively. The following metal ions (mg L−1) were detected: Ca2+, 69; Mg2+, 41; Na+, 13; K+, 2.1; Mn2+, 0.2. The groundwater was fed into the PBS bioreactor by spiking with NaNO3 and kH2PO4 to reach the influent NO3–N concentration of 68 ± 2 mg L−1 and TP levels of 1.1 ± 0.2 mg L−1, respectively. The pH value of the influent was 7.8 ± 0.1.Batch assays
After a certain period (1–2 months), batch tests were conducted to determine the specific denitrification rate (SDNR) of the biofilm attached to PBS media as described in previous studies.28 The temperature was kept at 28.5 °C. The SDNR was determined using linear regressions fitted to plots of decreasing nitrate concentration vs. time divided by the initial volatile suspended solid (VSS) content (mg N/g VSS per d). The changes in the weight per piece of PBS granule and the biofilm concentration (g VSS per L) were also evaluated.Analytic methods
NH4–N, NO2–N and NO3–N were measured according to Chinese SEPA Standard Methods.29 DOC was determined by a multi N/C 2100 model TOC/TN analyzer (Analytic Jena, Germany). Three-dimensional excitation-emission matrix (3D-EEM) fluorescence spectroscopy was applied to analyze the characterization of dissolved organic matter in the effluent using a spectrometry (F-7000 fluorescence spectrophotometer, Hitachi Japan).The molecular weight (MW) distribution of organic matters in the effluent was evaluated by a HPLC system (LC-20A, Shimadzu, Japan) equipped with a UV detector and an SEC column (TSK-GEL G3000PWXL). Sodium polystyrene sulphonate (3–30 kDa) and acetone (58 Da) were used as the standard solutions for MW calibration curve construction.
The functional groups of PBS granules were characterized using one NTS FT-IR spectrometer (PerkinElmer Spectrum). The structure of the PBS granules and biofilm attached was observed by a JSM- 6700F scanning electron microscopy (SEM, JEOL, Japan).
Biofilm adhered to the PBS granules was collected by ultrasonic (40 kHz, 5 min). The content of TSS and VSS of the biofilm samples were evaluated using gravimetric method.29 The extracellular polymer substances (EPS) were analyzed by the formaldehyde-NaOH extraction method.30 The content of carbon, oxygen, nitrogen and hydrogen element was quantified by an Vario EL element analyzer (Elementar, Germany).
For analysis of bacterial communities in the biofilm samples, after DNA extraction and purification, PCR amplification, amplicon quantitation and pooling, the pyrosequencing was conducted using a 454 Life Sciences Genome Sequencer FLX instrument (Roche, NJ, USA) by Majorbio Bio-pharm Biotechnology Company (Shanghai, China). Analysis of sequencing data were performed using Mothur software.
The liquid-membrane microelectrodes sensitive to nitrate anions and ammonium ions were prepared, respectively to detect the profiles of nitrate and ammonium within biofilm. Briefly, the nitrate and ammonium microelectrodes with a tip diameter of 5 μm and 15 μm, respectively were moved from the surface to the inner part of biofilm by a motor-driven micromanipulator. The output signals were transformed and recorded by computer using SensorTtrace Pro 2.0 software (Unisense, Denmark). The nitrate consumption rate and ammonium production rate were calculated using Fick's second law of diffusion.31 The applied molecular diffusion coefficients of nitrate and ammonium were 1.1 × 10⁻⁵ and 1.38 × 10⁻⁵ cm2 s−1, respectively.32
Results and discussion
Performance of PBS-packed bed bioreactor
Fig. 2 shows the variation of operational parameters and the overall performance of the PBS-packed bed reactor with respect to the concentrations of effluent NO3–N, NH4–N and NO2–N during the long-term operation of 620 d. The operational conditions and denitrification rate in the different phases were summarized in Table 1.| Phase 1 | Phase 2 | Phase 3 | Phase 4 | Phase 5 | Phase 6 | |
|---|---|---|---|---|---|---|
| Conditions | ||||||
| Time (d) | 0–70 | 71–231 | 232–335 | 336–449 | 450–560 | 561–620 |
| Temperature (oC) | 20–22 | 20–28 | 10–18 | 20–29 | 23–24 | 23–27 |
| HRT (h) | 41–10 | 5–7 | 12–13 | 6–8 | 6–8 | 6–8 |
![[thin space (1/6-em)]](https://www.rsc.org/images/entities/char_2009.gif) |
||||||
| Effluent | ||||||
| NO3–N (mg L−1) | 10.7 ± 9.1 | 3.0 ± 1.5 | 8.8 ± 6.9 | 2.2 ± 1.9 | 8.4 ± 3.2 | 3.6 ± 2.8 |
| NO2–N (mg L−1) | 1.3 ± 2.2 | 0.1 ± 0.1 | 1.8 ± 1.2 | 0.5 ± 0.5 | 0.57 ± 0.27 | 0.79 ± 0.61 |
| NH4–N (mg L−1) | 0.3 ± 0.3 | 0.5 ± 0.3 | 0.2 ± 0.1 | 0.8 ± 0.3 | 0.72 ± 0.23 | 0.62 ± 0.33 |
| Nitrate removal (%) | 89.4 ± 8.6 | 96.1 ± 2.6 | 87.7 ± 11.5 | 96.9 ± 2.8 | 86.5 ± 5.0 | 94.2 ± 4.2 |
| Denitrification rate (g N per L per d) | 0.16 ± 0.02 | 0.35 ± 0.03 | 0.12 ± 0.02 | 0.25 ± 0.04 | 0.17 ± 0.03 | 0.22 ± 0.04 |
The effluent NO3–N concentration decreased on the third day from start-up and then HRT was reduced gradually. After 2 months of operation (Phase 1), the reactor was started up successfully and NO3–N removal reached 90%. Thereafter, the reactor was operated at temperatures of 20–28 °C and HRT of 5–7 h (Phase 2), the effluent nitrate maintained at low levels of around 3.0 mg L−1 with NO3–N removal efficiency of higher than 95%. The denitrification rate reached the highest level of 0.35 g N per L per d. As the operation temperature dropped to 10–18 °C (Phase 3), the nitrate removal efficiency decreased to 87.7% even extending HRT to 12–13 h. A nitrite accumulation was also found. The denitrification rate decreased by 65% compared to that in phase 2. When the temperature of the reactor rose to more than 20 °C (Phase 4), the nitrate removal efficiency and denitrification rate recovered to more than 95% and 0.25 g N per L per d, respectively. After 1.5 years of experiment (Phase 5), the concentration of effluent NO3–N increased remarkably, which might be attributed to the great degradation of PBS carbon source and the increased biofilm density which limited the mass transfer of both nitrate and substrate. Therefore, 200 g of fresh PBS granules, which equals to 15% of the initial amount, was replenished to the reactor (Phase 6). The effluent nitrate decreased rapidly and 94% of nitrate removal was obtained after PBS addition. It is obvious that renewal of the fresh carbon source after some period of time is necessary for the continuous operation.
Only a small increase in effluent DOC of 1.7 ± 0.6 mg L−1 was observed during the long-term operation, which is much lower than that using PCL of 1.7–5.2 mg L−1 (ref. 9) and poly-3-hydroxybutyrate-co-hyroxyvelate (PHBV) of 14.9 ± 5.5 mg L−1 (ref. 22) as carbon source for denitrification in treating the similar groundwater. This is promising for practical applications because the burden of post treatment to polish the effluent is reduced. The MW distributions of the DOC in the effluent revealed four fractions, 3.31, 2.32, 1.27 and dominant 0.83 kDa. The calculated Mw and Mn were 1.55 and 1.14 kDa, respectively. The effluent mainly contained soluble microbial products-like substances from 3D-EEM spectrum (spectrum not shown). The pH values and TP concentration in the effluent were 8.0 ± 0.1 and 0.5 ± 0.2 mg L−1, respectively.
It is reported that temperature is one of the important factors controlling solid-phase denitrification, in addition to HRT, influent nitrate concentration and pH, dissolved oxygen (DO), etc.26,33 The DO concentration detected in the influent was around 1.5 mg L−1, which was consumed quickly though PBS-packed bioreactor, leading to low DO levels in the effluent (less than 0.3 mg L−1) that was appropriate for denitrification. The denitrification rate in the PBS-packed reactor was lower by 52–66% at temperatures of 10–18 °C than that at 20–29 °C. The solid carbon source could not be utilized directly by denitrifying bacteria but needs to be hydrolyzed into soluble and micro-molecular substrates. Both the hydrolysis efficiency of PBS and the activities of the denitrifying microbes declined with decreasing temperature,34 leading to a reduction in denitrification rate. Our previous studies showed that the denitrification rate decreased by around 50% with a 5 °C reduction in PCL-packed denitrification reactor.9 Cameron and Schipper35 documented that the NO3–N removal rate was raised by 1.7 times when temperature was increased by 10 °C using the softwoods-packed denitrification bed.
Nitrite is an intermediate of denitrification process. As shown in Fig. 2 and Table 1, NO2–N accumulation was observed in the effluent during the initial stage (Phase 1, around 1.3 mg L−1) and the operation at the lower temperatures (Phase 3, around 1.8 mg L−1) owing to the incomplete denitrification. In the most period, the NO2–N concentration in the effluent were less than 0.9 mg L−1. The concentration of leached ammonium in the effluent was at low levels (0.5 ± 0.3 mg L−1) throughout the total operation. This indicates that heterotrophic denitrification of reducing nitrate to nitrogen gas was predominant in the system using PBS as carbon source. It is known that there is another pathway, dissimilatory nitrate reduction to ammonium (DNRA), which competes with denitrification for nitrate.36 Microelectrode data indicated that ammonium production was detected at the biofilm–media interface and NH4–N concentration decreased toward the bulk surface, while NO3–N concentration decreased gradually from the biofilm–bulk interface toward the biofilm bottom (Fig. 3). The calculated nitrate consumption rate (1069 ± 103 μmol cm−1 h−1) was much higher than the ammonium production rate (74 ± 7 μmol cm−1 h−1), which proved that denitrification plays the major role in the system.
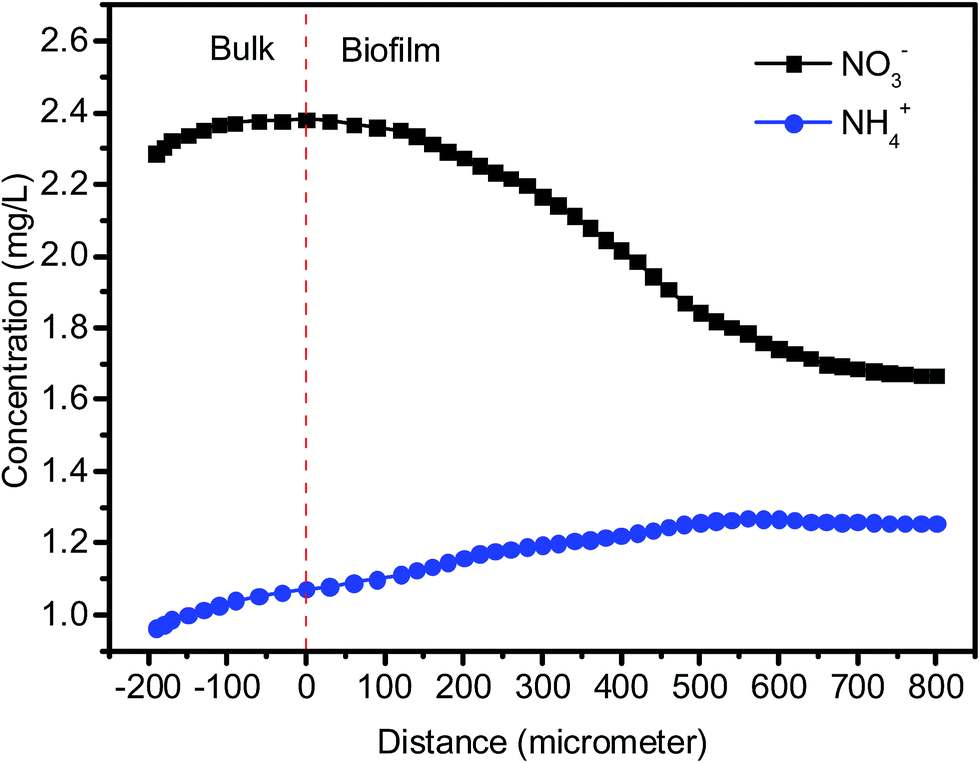 | ||
| Fig. 3 Micro-profiles of nitrate and ammonium concentrations. | ||
Characterization of PBS degradation and biofilm attachment
From batch test, the weight of each piece of PBS granule declined almost linearly over the course of time (Fig. 4). The degradation rate of PBS was around 0.04 mg d−1. If the useful life of the solid carbon source is 50% of its initial weight, the PBS granules (with the initial weight of around 0.0289 g per piece) would last around 1 year, after that period refreshing some carbon source seems to be needed.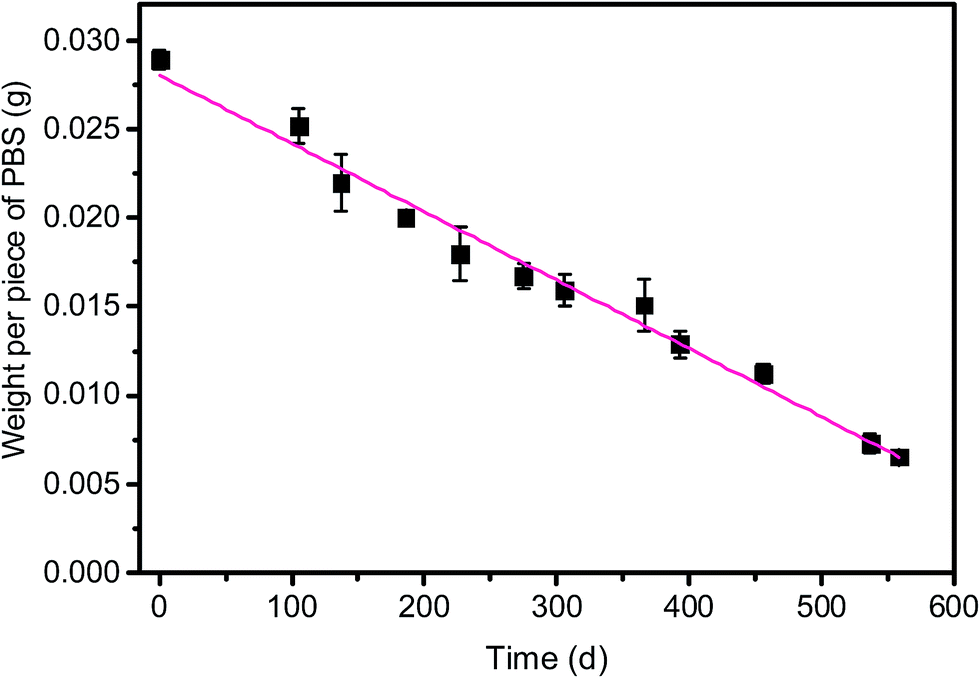 | ||
| Fig. 4 Changes in weight per piece of PBS with operation time. | ||
From SEM observation, the fresh PBS granule has relatively smooth surface with some protuberances (Fig. 5a), while the used PBS has concave cavities induced by microbial corrosion (Fig. 5b). According to FT-IR spectra (Fig. 6), PBS exhibits the characteristic adsorption at 2961 cm−1, 2944 cm−1 and 2850 cm−1 due to CH2 stretching vibration, 1713 cm−1 assigned to carbonyl group, 1174 cm−1 and 955 cm−1 due to C–O stretching vibration and 1044 cm−1 assigned to O[CH2]4O group. After PBS was used as carbon source, a broad peak in 3000–3750 cm−1 region assigned to hydroxyl group has become obviously, indicating that there existed small fragments from PBS hydrolysis. The shape and position of the characteristic adsorption of the used PBS were similar to that of the fresh PBS, whereas the peak intensities declined greatly due to biodegradation.
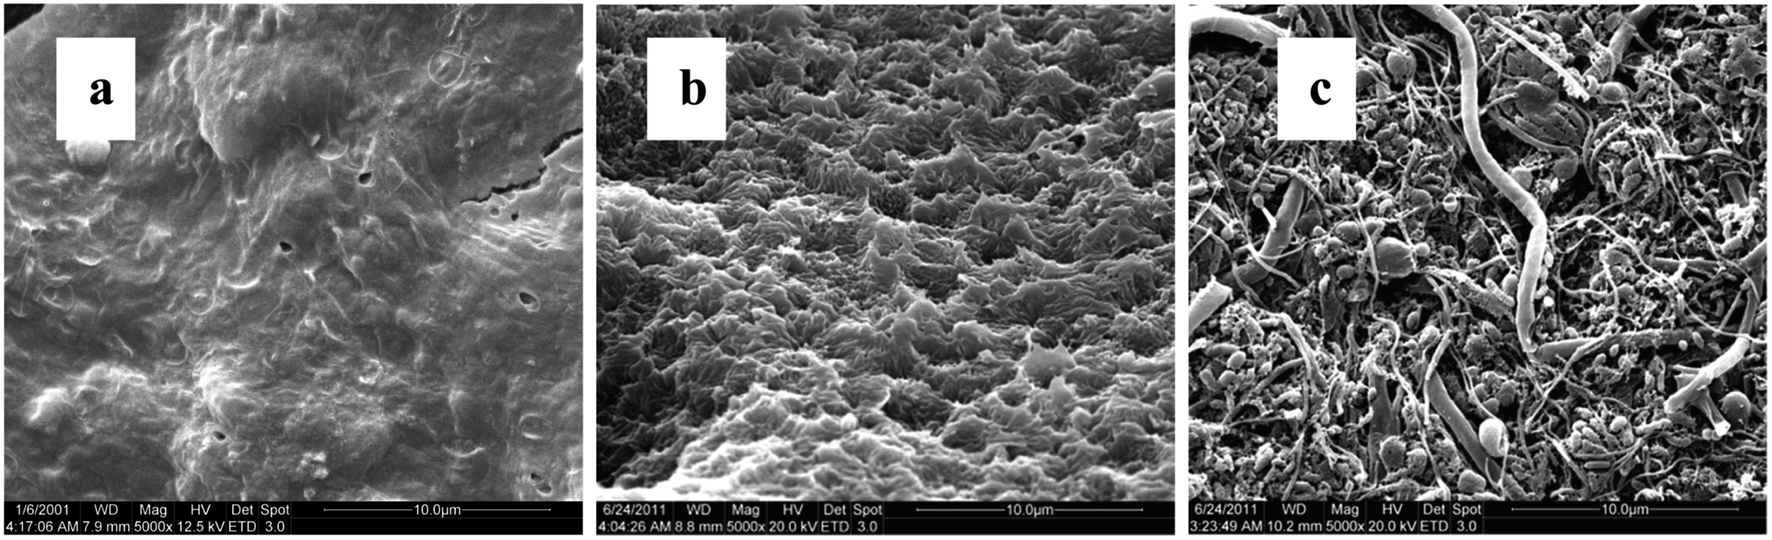 | ||
| Fig. 5 SEM images of PBS granule, fresh (a) and used (b) and biofilm attached (c). | ||
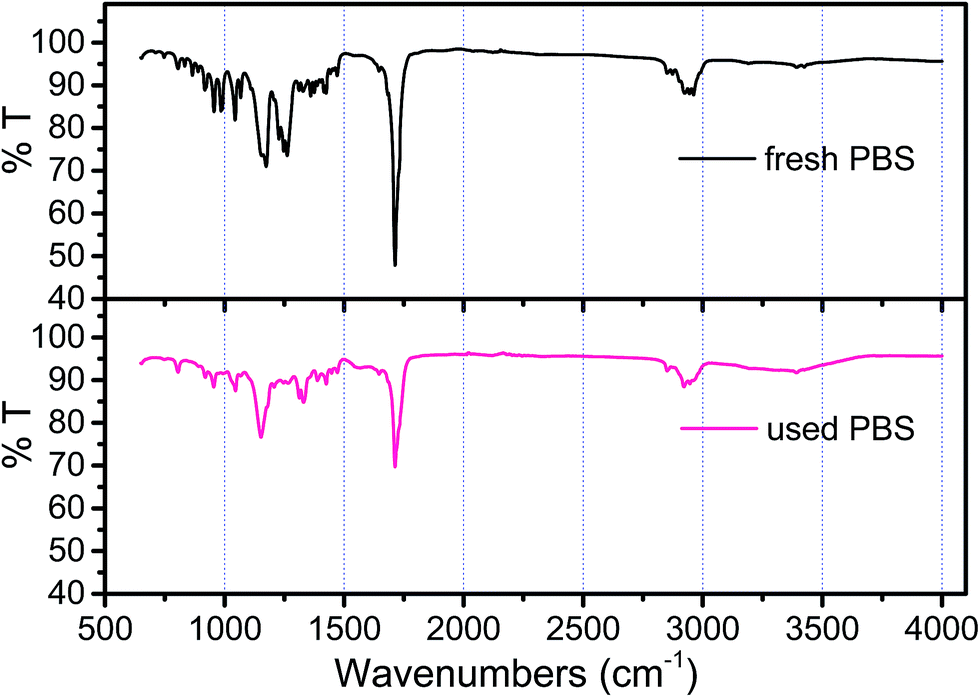 | ||
| Fig. 6 FT-IR spectrum of the fresh and used PBS. | ||
When acting as carriers, PBS favors the attachment of biofilm which was composed of cocci and rod shape bacteria with some filamentous bacteria (Fig. 5c). The amount of biofilm attached to PBS media increased gradually with the prolonged operating time and reached around 16 g VSS per L after 1 year of operation. With the increase in the biofilm density the mass transfer of both nitrate and substrate might be limited. Consequently, the SDNR of biofilm attached initially decreased remarkably and then stabilized at around 0.03 mg N/g VSS per d (Fig. 7). It is noted that the VSS/TSS ratio of biofilm reached more than 90%, indicating the high activity of biofilm attached to the biodegradable media. Similar results were found in a denitrification reactor using PCL as carbon source.9 In the EPS composition, the content of protein (129 ± 12 mg per g VSS) was much higher than that of polysaccharides (41 ± 5 mg per g VSS), which might be owing to the excretion of cytosolic proteins or cell lysis.37
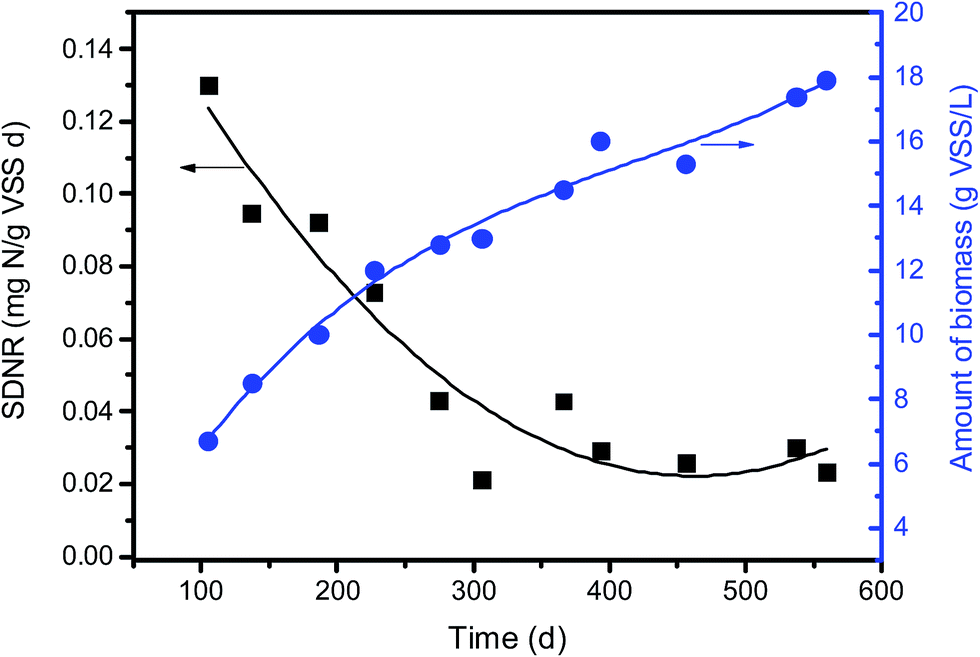 | ||
| Fig. 7 Changes in SDNR and the amount of attached biomass with time. | ||
When PBS was utilized as carbon source for denitrification, the reaction of PBS monomer with nitrate leads to the production of carbon dioxide, nitrogen gas and biomass. The elemental composition of biomass was C3.87H6.86N0.67O2.14 from the elemental analysis of biofilm. Assuming a yield 0.45 g biomass/g PBS,38 the equation of denitrification reaction can be given as:
| 4.857NO3− + C8O4H12 + 4.587H+ → 0.724C3.87H6.86N0.67O2.14 + 2.05N2 + 5.2 CO2 + 5.81H2O |
The theoretical amount of PBS consumed in removing a gram of NO3–N was 2.68 g PBS/g NO3–N. The practical PBS consumption rate (2.75 ± 0.72 g PBS/g NO3–N) was slightly higher than the theoretical value. Similar results were also found by other researchers who utilized PCL and poly-3-hydroxybutyric acid (PHB) as denitrifying carbon source.13,25 This difference might be due to the residual oxygen consumption on carbon source. In the presence of dissolved oxygen, a portion of carbon source was consumed by aerobic respiration instead of denitrification.25
The unit price of the domestic PBS products in China ranges 18–25 CNY/kg. The calculated denitrification cost using PBS as carbon source was 49–68 CNY/kg NO3–N, which are higher than using methanol.22 If the economic PBS polymers were available with the development of bioplastic industry, PBS solid-phase denitrification might be competitive in practical application.
Microbial community analysis
The numbers of effective sequence tags obtained from pyrosequencing were 13950. Fig. 8 shows the bacterial community and abundance identified at the phylum, class, order and family levels in biofilm attached. At the phylum level, Proteobacteria was predominant with relative abundance of 75.6%, followed by Bacteroidetes (5.62%), Firmicutes (4.32%), Chlorobi (4.14%) and Spirochaetes (0.8%). Betaproteobacteria, Burkholderiales and Comamonadaceae were the major classes (59.8%), orders (42.3%) and families (42.2%) in each level, respectively. Hiraishi and Khan38 have documented that most of the PHA-degrading denitrifying bacteria were affiliated to Betaproteobacteria and family Comamonadaceae. Khan et al.39 have isolated 23 strains of PHBV-degrading denitrifying bacteria from different activated sludge. 16S ribosomal DNA sequence analysis demonstrated that 20 of the strains belonged to the family Comamonadaceae.
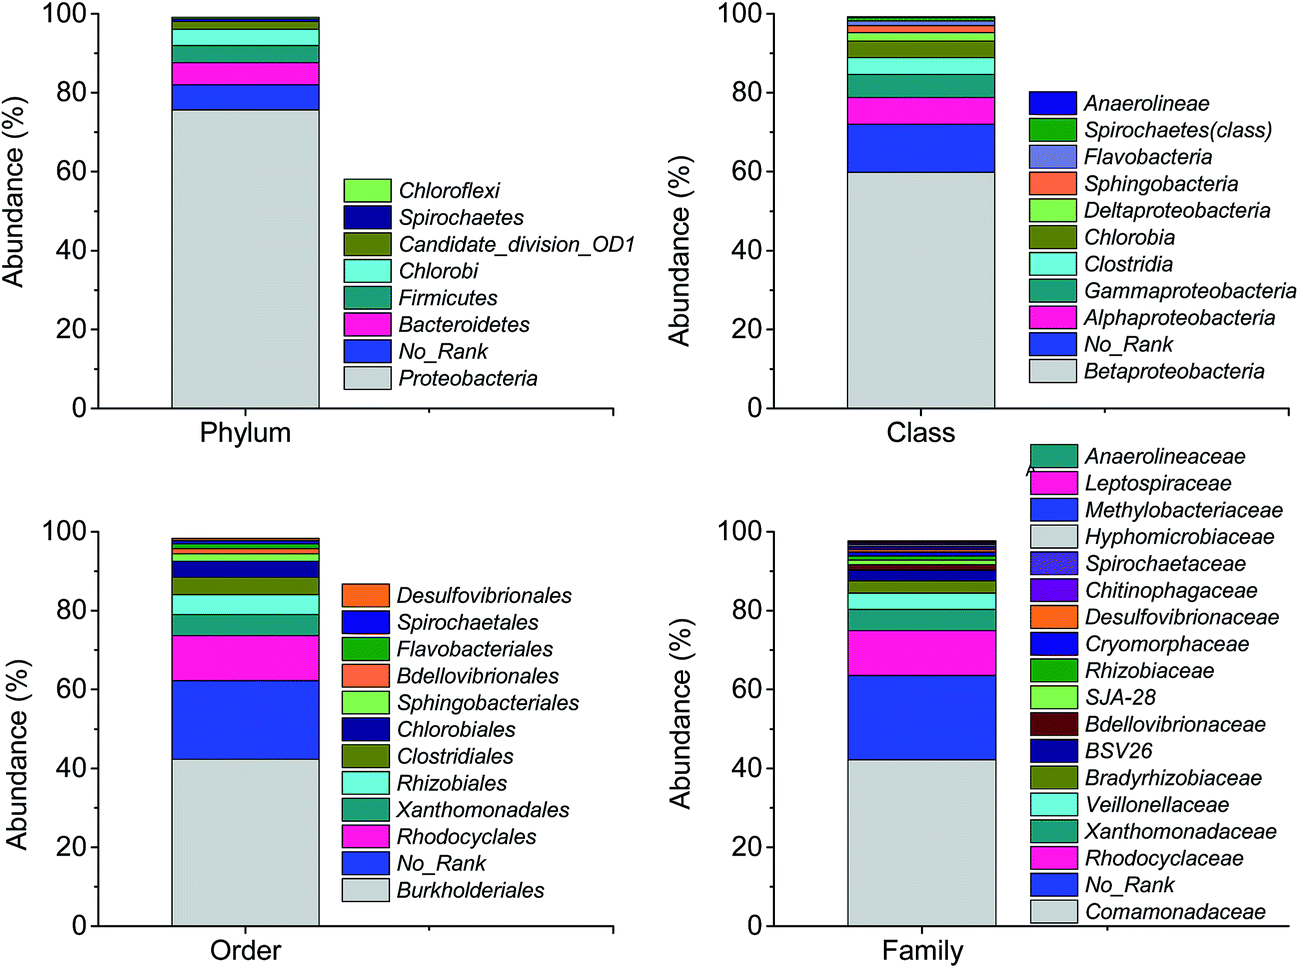 | ||
| Fig. 8 The bacterial community and abundance at phylum, class, order and family levels in biofilm attached. | ||
At the genus level, the identified bacteria of the major OTUs, the relative abundance and function reported were shown in Table 2. It is worthwhile to note that there were 71% of sequences unclassified in the biofilm samples. In the top 20 OTUs accounting for 25% of the total sequence, 9 OTUs involving Simplicispira, Comamonadaceae, Hydrogenophaga and Rhodocyclaceae belonged to denitrifying groups with an abundance of 16%. All the genera of identified denitrifiers affiliated with phylum Proteobacteria. The abundance of genus Simplicispira was the highest. It was reported bacteria belonging to Simplicispira are able to reduce nitrate to nitrite and have been isolated from activated sludge in treating wastewater for inorganic nutrient removal.40 Ruan et al.41 also reported that the denitrifiers Azoarcus and Simplicispira were dominant in a recirculating aquaculture system filled with PBS as the biofilm carrier and carbon source for simultaneous removal of ammonium and nitrate. In addition, genus Desulfovibrio was found in the pyrosequencing analysis (0.6%), which was reported to be able to reduce nitrate to ammonium.42 This is the reason why ammonium was detected in the effluent.
| OTU | Abundance (%) | Genus | Phylum/family | Function | Ref. |
|---|---|---|---|---|---|
| a The bacteria with ★ represent denitrifiers. | |||||
| 1 | 5.48 | Simplicispira★ | Proteobacteria/Comamonadaceae | Reduce nitrate to nitrite | 40 |
| 2 | 4.14 | Veillonellaceae uncultured | Firmicutes/Veillonellaceae | Fermentation of sugars, carboxylic acids and alcohols | 49 |
| 3 | 3.86 | Comamonadaceae uncultured★ | Proteobacteria/Comamonadaceae | Denitrification | 39 |
| 4 | 2.95 | Hydrogenophaga★ | Proteobacteria/Comamonadaceae | PHBV/PBS-degrading denitrifiers | 24 and 39 |
| 5 | 1.88 | Propionivibrio | Proteobacteria/Rhodocyclaceae | Fermentative acidogenic bacteria | 50 |
| 6 | 1.25 | Rhodocyclaceae uncultured★ | Proteobacteria/Rhodocyclaceae | Reduce nitrate to nitrogen gas | 51 |
| 7 | 1.08 | Bdellovibrio | Proteobacteria/Bdellovibrionaceae | Degrade macromolecules of their prey | 52 |
| 8 | 0.95 | Rhizobium★ | Proteobacteria/Rhizobiaceae | Anaerobic denitrification | 53 |
| 9 | 0.75 | Owenweeksia | Bacteroidetes/Cryomorphaceae | Aerobic oxidation metabolism | 54 |
| 10 | 0.59 | Desulfovibrio★ | Proteobacteria/Desulfovibrionaceae | Reduce nitrate to ammonium | 42 |
| 11 | 0.39 | Azospira★ | Proteobacteria/Rhodocyclaceae | Denitrifier isolated from activated sludge | 55 |
| 13 | 0.36 | Meganema | Proteobacteria/Methylobacteriaceae | Filamentous bacteria isolated from bulking activated sludge | 56 |
| 14 | 0.35 | Spirochaetaceae uncultured | Spirochaetes/Spirochaetaceae | Chemo-organotrophic, utilize carbohydrates or amino acids as carbon and energy sources | 57 |
| 15 | 0.29 | Blastochloris | Proteobacteria/Hyphomicrobiaceae | Phototrophs and nitrogen-fixers | 58 |
| 16 | 0.26 | Ideonella | Proteobacteria/Comamonadaceae | Enable to grow anaerobically by reducing chlorate to chloride | 59 |
| 17 | 0.24 | Anaerolineaceae uncultured | Chloroflexi/Anaerolineaceae | Degrade carbohydrate | 60 |
| 18 | 0.22 | Leptospiraceae uncultured | Spirochaete/Leptospiraceae | Free-living saprophyte found in fresh water | 61 |
| 19 | 0.12 | Diaphorobacter★ | Proteobacteria/Comamonadaceae | PHB-degrading denitrifying | 62 |
| 20 | 0.1 | Thiothrix★ | Proteobacteria/Thiotrichaceae | Reduce nitrate to nitrite and/or further to N2O | 63 |
The denitrifiers using the solid carbon source were found to be different from that using the soluble carbon substrate. The denitrifying bacteria in the genera Diaphorobacter, Simplicispira and Comamonas which were found in the present study and Acidovorax belonging to family Comamonadaceae were commonly dominant in the solid-phase denitrification system.12,43,44 The genera Pseudomonas, Paracoccus, Alcaligenes and Bacillus are the important groups of denitrifiers in the traditional denitrification system using soluble carbon source such as methanol and ethanol.45–47
As shown in Table 2, the bacteria including Veillonellaceae, Propionivibrio and Bdellovibrio, belonging to other 11 genera with an abundance of 9% were reported to have the function of degradation and acidification of organics. In the present study, they might serve for degrading PBS. The denitrifying microbes are not capable of utilizing the macromolecular PBS directly. In the solid-phase denitrification system there are microbes which secrete some hydrolases such as protease and lipases to decompose PBS to small soluble monomers.17,26 The degraded products were then utilized by denitrifying bacteria to achieve biological denitrification. It should be noted that some species of genus Diaphorobacter which was detected in the PBS solid-phase denitrification system, were reported to be characterized with both degrading PHBV and denitrification.48 In addition, no methanogen microbes were observed in the current work. It is reported that in the solid-phase denitrification process, the organic solid substances might be degraded by anaerobic digestion, leading to the production of CO2 and CH4.26 In such cases, the methanogens might develop in the inner part of the carriers, which compete with denitrifies for carbon source.
Conclusions
The long-term performance of a PBS-packed bed bioreactor for nearly 2 years demonstrated that the system is promising to remove nitrate from groundwater. The effluent nitrate concentration reached 3.3–8.8 mg L−1 and 88–97% of nitrate removal was achieved. The denitrification rate at temperatures of 10–18 °C decreased by 52–66% compared to that at 20–29 °C. Only a small increase of DOC (1.7 ± 0.6 mg L−1) and ammonium (0.5 ± 0.3 mg L−1) was observed in effluent which reduce the burden of post treatment. The practical PBS consumption rate (2.75 ± 0.72 g PBS/g NO3–N) was slightly higher than the theoretical value. Renewal of the fresh carbon source after certain period was necessary for the continuous operation. Bacteria belonging to genera Simplicispira, Veillonellaceae uncultured, Comamonadaceae uncultured and Hydrogenophaga were highly enriched in PBS biofilm. In the top 20 OTUs accounting for 25% of the total sequence, 9 OTUs belonged to denitrifying groups with an abundance of 16%. Some members belonging to other 11 genera were reported to be capable of degradation and acidification of the organic substances.Conflicts of interest
There are no conflicts to declare.Acknowledgements
We thank the support of the project of the National Natural Science Foundation of China (51338005) and the Program for Changjiang Scholars and Innovative Research Team in University (IRT-13026).References
- M. N. Gonzalez-Alcaraz, H. Miguel Conesa and J. Alvarez-Rogel, J. Environ. Manage., 2013, 128, 964–972 CrossRef CAS PubMed.
- K. M. Hiscock, J. W. Lloyd and D. N. Lerner, Water Res., 1991, 25, 1099–1111 CrossRef CAS.
- J. Górski, K. Dragon and P. M. J. Kaczmarek, Environ. Sci. Pollut. Res., 2017 DOI:10.1007/s11356-017-9798-3.
- V. Matiju, S. Cizinska, J. Krejci and T. Janoch, Enzyme Microb. Technol., 1992, 14, 170–183 CrossRef.
- P. Loganathan, S. Vigneswaran and J. Kandasamy, J. Environ. Manage., 2013, 131, 363–374 CrossRef CAS PubMed.
- L. A. Schipper, W. D. Robertson, A. J. Gold, D. B. Jaynes and S. C. Cameron, Ecol. Eng., 2010, 36, 1532–1543 CrossRef.
- K. A. Bill, C. B. Bott and S. N. Murthy, Water Sci. Technol., 2009, 60, 2647–2657 CrossRef CAS PubMed.
- O. Modin, K. Fukushi and K. Yamamoto, Water Res., 2007, 41, 2726–2738 CrossRef CAS PubMed.
- L. Chu and J. Wang, Chemosphere, 2013, 91, 1310–1316 CrossRef CAS PubMed.
- C. Della Rocca, V. Belgiorno and S. Meric, Desalination, 2007, 204, 46–62 CrossRef CAS.
- M. G. Healy, T. G. Ibrahim, G. J. Lanigan, A. J. Serrenho and O. Fenton, Ecol. Eng., 2012, 40, 198–209 CrossRef.
- S.-M. Zhu, Y.-L. Deng, Y.-J. Ruan, X.-S. Guo, M.-M. Shi and J.-Z. Shen, Bioresour. Technol., 2015, 192, 603–610 CrossRef CAS PubMed.
- M. T. Gutierrez-Wing, R. F. Malone and K. A. Rusch, Aquacult. Eng., 2012, 51, 36–43 CrossRef.
- P. Li, J. Zuo, Y. Wang, J. Zhao, L. Tang and Z. Li, Water Res., 2016, 93, 74–83 CrossRef CAS PubMed.
- S. Aslan and A. Turkman, Water Sci. Technol., 2003, 48, 489–495 CAS.
- B. Ovez, Process Biochem., 2006, 41, 1289–1295 CrossRef CAS.
- Y. Honda and Z. Osawa, Polym. Degrad. Stab., 2002, 76, 321–327 CrossRef CAS.
- Z. Shen and J. Wang, Bioresour. Technol., 2011, 102, 8835–8838 CrossRef CAS PubMed.
- E. Walters, A. Hille, M. He, C. Ochmann and H. Horn, Water Res., 2009, 43, 4461–4468 CrossRef CAS PubMed.
- X. Zhao, X. Meng and J. Wang, Int. J. Environ. Pollut., 2009, 38, 328–338 CrossRef CAS.
- Q. Zhang, F. Ji and X. Xu, Chem. Eng. J., 2016, 283, 604–613 CrossRef CAS.
- L. Chu and J. Wang, Chemosphere, 2016, 155, 463–470 CrossRef CAS PubMed.
- O. Gibert, S. Pomierny, I. Rowe and R. M. Kalin, Bioresour. Technol., 2008, 99, 7587–7596 CrossRef CAS PubMed.
- W. Wu, L. Yang and J. Wang, Environ. Sci. Pollut. Res., 2013, 20, 333–339 CrossRef CAS PubMed.
- A. Boley and W. R. Muller, Water Sci. Technol., 2005, 52, 495–502 CAS.
- J. Wang and L. Chu, Biotechnol. Adv., 2016, 34, 1103–1112 CrossRef CAS PubMed.
- H. Zhou, X. Zhao and J. Wang, Int. J. Environ. Pollut., 2009, 38, 339–348 CrossRef CAS.
- L. Chu and J. Wang, Chem. Eng. J., 2011, 170, 220–225 CrossRef CAS.
- SEPA, Water and Wastewater Monitoring Methods, Chinese Environmental Science Publishing House, Beijing, 4th edn, 2002 Search PubMed.
- H. Liu and H. H. P. Fang, J. Biotechnol., 2002, 95, 249–256 CrossRef CAS PubMed.
- J. Lorenzen, L. H. Larsen, T. Kjaer and N. P. Revsbech, Appl. Environ. Microbiol., 1998, 64, 3264–3269 CAS.
- H. Satoh, S. Okabe, N. Norimatsu and Y. Watanabe, Water Sci. Technol., 2000, 41, 317–321 CAS.
- K. A. Karanasios, I. A. Vasiliadou, S. Pavlou and D. V. Vayenas, J. Hazard. Mater., 2010, 180, 20–37 CrossRef CAS PubMed.
- R. Canziani, R. Vismara, D. Basilico and L. Zinni, Water Sci. Technol., 1999, 40, 145–152 CAS.
- S. G. Cameron and L. A. Schipper, Ecol. Eng., 2010, 36, 1588–1595 CrossRef.
- C. Huilinir, S. Hernandez, E. Aspe and M. Roeckel, J. Environ. Manage., 2012, 101, 82–91 CrossRef CAS PubMed.
- Z. Ying and G. Ping, Sep. Purif. Technol., 2006, 52, 154–160 CrossRef CAS.
- A. Hiraishi and S. T. Khan, Appl. Microbiol. Biotechnol., 2003, 61, 103–109 CrossRef CAS PubMed.
- S. T. Khan, Y. Horiba, M. Yamamoto and A. Hiraishi, Appl. Environ. Microbiol., 2002, 68, 3206–3214 CrossRef CAS PubMed.
- S. P. Lu, S. H. Ryu, B. S. Chung, Y. R. Chung, W. Park and C. O. Jeon, Int. J. Syst. Evol. Microbiol., 2007, 57, 31–34 CrossRef CAS PubMed.
- Y. J. Ruan, Y. L. Deng, X. S. Guo, M. B. Timmons, H. F. Lu, Z. Y. Han, Z. Y. Ye, M. M. Shi and S. M. Zhu, Bioresour. Technol., 2016, 216, 1004 CrossRef CAS PubMed.
- S. Dannenberg, M. Kroder, W. Dilling and H. Cypionka, Arch. Microbiol., 1992, 158, 93–99 CrossRef CAS.
- S. T. Khan, Y. Horiba, N. Takahashi and A. Hiraishi, Microbes Environ., 2007, 22, 20–31 CrossRef.
- Z. Shen, Y. Zhou, J. Hu and J. Wang, J. Hazard. Mater., 2013, 250–251, 431–438 CrossRef CAS PubMed.
- M. Blaszczyk, Acta Microbiol. Pol., 1982, 32, 65–71 Search PubMed.
- N. M. Lee and T. Welander, J. Ferment. Bioeng., 1996, 82, 277–285 CrossRef CAS.
- A. Neef, A. Zaglauer, H. Meier, R. Amann, H. Lemmer and K. H. Schleifer, Appl. Environ. Microbiol., 1996, 62, 4329–4339 CAS.
- S. T. Khan and A. Hiraishi, J. Gen. Appl. Microbiol., 2002, 48, 299–308 CrossRef CAS PubMed.
- S. J. Andersen, P. Candry, T. Basadre, W. C. Khor, H. Roume, E. Hernandez-Sanabria, M. Coma and K. Rabaey, Biotechnol. Biofuels, 2015, 8, 1–14 CrossRef PubMed.
- Z. Zhou, W. Qiao, C. Xing, X. Shen, D. Hu and L. Wang, Bioresour. Technol., 2014, 173, 452–456 CrossRef CAS PubMed.
- T. Satoh, Y. Hoshino and H. Kitamura, Arch. Microbiol., 1976, 108, 265–269 CrossRef CAS PubMed.
- D. L. Diedrich, C. A. Portnoy and S. F. Conti, Curr. Microbiol., 1983, 8, 51–56 CrossRef CAS.
- G. W. O'Hara and R. M. Daniel, Soil Biol. Biochem., 1985, 17, 1–9 CrossRef.
- K. W. K. Lau, C. Y. M. Ng, J. Ren, S. C. L. Lau, P.-Y. Qian, P.-K. Wong, T. C. Lau and M. Wu, Int. J. Syst. Evol. Microbiol., 2005, 55, 1051–1057 CrossRef CAS PubMed.
- K. Heylen, B. Vanparys, L. Wittebolle, W. Verstraete, N. Boon and P. De Vos, Appl. Environ. Microbiol., 2006, 72, 2637–2643 CrossRef CAS PubMed.
- T. R. Thomsen, L. L. Blackall, M. A. de Muro, J. L. Nielsen and P. H. Nielsen, Int. J. Syst. Evol. Microbial., 2006, 56, 1865–1868 CrossRef CAS PubMed.
- R. S. Gupta, S. Mahmood and M. Adeolu, Front. Microbiol., 2013, 4, 1–18 Search PubMed.
- G. J. Hoogewerf, D. O. Jung and M. T. Madigan, FEMS Microbiol. Lett., 2003, 218, 359–364 CrossRef CAS PubMed.
- J. D. Noar and D. H. Buckley, Int. J. Syst. Evol. Microbiol., 2009, 59, 1941–1946 CrossRef PubMed.
- T. Narihiro, T. Terada, A. Ohashi, Y. Kamagata, K. Nakamura and Y. Sekiguchi, Water Res., 2012, 46, 2167–2175 CrossRef CAS PubMed.
- P. N. Levett, Curr. Top. Microbiol. Immunol., 2015, 387, 11–20 CAS.
- S. Tabrez Khan and A. Hiraishi, J. Gen. Appl. Microbiol., 2002, 48, 299–308 CrossRef.
- I. V. Trubitsyn, E. V. Belousova, M. N. Tutukina, A. Y. Merkel, G. A. Dubinina and M. Y. Grabovich, FEMS Microbiol. Lett., 2014, 358, 72–80 CrossRef CAS PubMed.
| This journal is © The Royal Society of Chemistry 2017 |