 Open Access Article
Creative Commons Attribution 3.0 Unported Licence
Nanostructured spinel manganese cobalt ferrite for high-performance supercapacitors
Ayman E. Elkholy ac,
F. El-Taib Heakal
 b and
Nageh K. Allam
 *c
*c
aDepartment of Analysis and Evaluation, Egyptian Petroleum Research Institute, 11727 Cairo, Egypt
bChemistry Department, Faculty of Science, Cairo University, 12613 Giza, Egypt
cEnergy Materials Laboratory, School of Sciences and Engineering, The American University in Cairo, 11835 New Cairo, Egypt. E-mail: nageh.allam@aucegypt.edu
First published on 8th November 2017
Abstract
We report on the synthesis of manganese cobalt ferrite (MnCoFeO4) nanoparticles via a simple one-pot co-precipitation method and their characterization through energy-dispersive spectroscopy (EDS), X-ray diffraction (XRD), high-resolution transmission electron microscopy (HR-TEM), Fourier transform infrared (FT-IR) spectroscopy and N2 adsorption/desorption techniques. The MnCoFeO4 supercapacitor showed the maximum specific capacitance of 675 F g−1 at a scan rate of 1 mV s−1. Its energy and power densities were 18.85 W h kg−1 and 337.50 W kg−1, respectively, at a current density of 1.5 A g−1. The cyclic stability was scrutinized via galvanostatic charging/discharging (GCD) and electrochemical impedance spectroscopy (EIS). The degradation of the supercapacitive performance was only 7.14% after 1000 GCD cycles, indicating an excellent long-term stability. The equivalent series resistance (ESR) remained nearly constant even after 1000 GCD cycles.
1. Introduction
Nowadays, the worldwide community suffers from serious environmental problems arising from an excessive combustion of fossil fuels.1 Consequently, many researchers have paid great attention to manipulate the clean and sustainable energy sources as well as efficient energy conversion and storage technologies.2 Batteries and supercapacitors are the typical devices used for the storage of electrical energy. Both of these store electricity through electrochemical processes.3 Compared to the batteries, the supercapacitors are characterized by higher power density, rapid charge/discharge, and long-life service. Despite the advantages of high power density and high cycle life of supercapacitors, their intrinsically low energy density (i.e. the amount of energy stored per unit weight) has limited them from widespread commercial applications in comparison to batteries. To this end, increasing their energy density requires an extensive research and development,4,5 including the merge of batteries and supercapacitors.6According to their active materials, supercapacitors (SCs) are classified into two main types: electrochemical double layer capacitors (DCs) and electrochemical pseudocapacitors (PCs).7,8 The active material in the DCs is composed of carbonaceous (carbon-based) materials, such as activated carbon, graphite, and graphene. Energy is stored physically within a DC via charge accumulation across the electrode/electrolyte interface.8,9 As for PCs, the active material is primarily composed of a transition metal (TM) oxide, a TM nitride or a conducting polymer. Energy is stored electrochemically within a PC via the reversible interfacial redox reactions in TMs or via ion intercalation throughout the electrode in conducting polymers.5,10,11 Due to the intrinsic low specific capacitance (Csp) and low energy density stored in the current SCs, it is vital to explore new materials that simultaneously exhibit high Csp as well as high conductivity.4 TMs are characterized by being cost-effective and displaying multiple oxidation states7 in addition to their fast and reversible faradaic redox reactions.12 Therefore, TMs are engrossed as the electrode materials for supercapacitor applications because of their outstanding electrochemical performance.13 In addition, TM oxides can provide a higher theoretical Csp than that of the conventional carbon-based materials and a better electrochemical stability than that of the polymeric materials.7 Among them, RuO2 has been widely investigated as a promising candidate because of its better conductivity and high Csp; however, it is limited by its high cost, rarity,13,14 and toxicity.15 Alternative inorganic electrode materials such as MnO2,16 Co3O4,17 NiO,18 V2O5/VO4,19 WO3,20 and Fe2O3![[thin space (1/6-em)]](https://www.rsc.org/images/entities/char_2009.gif) 21 have been intensively investigated in SC applications owing to their wide availability, chemical stability, mechanical strength, safety, and eco-friendliness.15 Recently, ferrites as SC materials have been explored by researchers due to their various redox states, electrochemical stability as well as remarkable magnetic, catalytic, optical, and electrical properties.22 Ferrite-based materials have been synthesized in diverse nanostructured forms, including nanoparticles,23 nanotubes,24 nanofibers,20 nanowires,25,26 nanorods,10 nanoflakes,17,27 nanomesh arrays,14 nanosheets,17 and hollow structures.28 Ferrites can be synthesized via various synthesis techniques including sol–gel method,12 co-precipitation method,29 template method,24 solvothermal method,30 microwave-assisted method,10,13 electrodeposition method,27 chemical spray method,15 spray-pyrolysis method15 and hydrothermal method.14 Among these techniques, the co-precipitation method provides a simple route for the one-pot synthesis and the reaction conditions are mild and simple.13
21 have been intensively investigated in SC applications owing to their wide availability, chemical stability, mechanical strength, safety, and eco-friendliness.15 Recently, ferrites as SC materials have been explored by researchers due to their various redox states, electrochemical stability as well as remarkable magnetic, catalytic, optical, and electrical properties.22 Ferrite-based materials have been synthesized in diverse nanostructured forms, including nanoparticles,23 nanotubes,24 nanofibers,20 nanowires,25,26 nanorods,10 nanoflakes,17,27 nanomesh arrays,14 nanosheets,17 and hollow structures.28 Ferrites can be synthesized via various synthesis techniques including sol–gel method,12 co-precipitation method,29 template method,24 solvothermal method,30 microwave-assisted method,10,13 electrodeposition method,27 chemical spray method,15 spray-pyrolysis method15 and hydrothermal method.14 Among these techniques, the co-precipitation method provides a simple route for the one-pot synthesis and the reaction conditions are mild and simple.13
Usually, the general formula for a spinel is AB2O4, where A refers to a divalent metal ion (M2+) and B refers to a trivalent metal ion (M3+). In a normal spinel structure, the A ions occupy the tetrahedral sites and the B ions occupy the octahedral sites.31 Spinel ferrites, MFe2O4 or MM′FeO4 (where M or M′= Mn, Co, Ni, Zn, Cu, etc.), are fascinating materials owing to their impressive magnetic, electrical, and optical properties in addition to their ability to exhibit different redox states and electrochemical stability. In spinel ferrites, the divalent metal ion (M2+) occupies the tetrahedral site and the trivalent metal ion (M′3+ or Fe3+) occupies the octahedral position.12 According to Bernard et al.32 and Kulkarni,33 Mn atoms in MnCoFeO4 prefer to occupy the tetrahedral positions, while Co atoms prefer to occupy the octahedral sites. Besides, the valence states of Mn, Co, and Fe are majorly (+II), (+III), and (+III), respectively. In contrast, Martens34 has studied the magneto-optical properties of MnxCoFe2−xO4 (where x = 0, 0.5, and 1.0) prepared using a conventional ceramic technology with a final sinter treatment in oxygen for 24 h at 1200–1300 °C and found that Mn has the oxidation state (+III) and occupied the octahedral sites, while Co, in the form of Co2+, could occupy both octahedral and tetrahedral positions with the latter being more favorable. These observations were confirmed by two later studies based on submicron MnxCoFe2−xO4 spinel ferrites by Chassaing et al.35 and Laarj and Kacim.36 In both studies, MnxCoFe2−xO4 spinels were prepared from the oxalic precursors and subjected to annealing treatment between 600 °C and 700 °C.
Numerous binary TM ferrites have been investigated for supercapacitor applications such as ZnFe2O4,17,30 CoFe2O4,14 MnFe2O4,37 CuFe2O4,26 and SnFe2O4.10 However, few research studies were carried out on ternary TM ferrites as the electrodes for supercapacitor applications as listed in Table 1.
Herein, MnCoFeO4 was synthesized in the form of nanoparticles via the co-precipitation method and characterized by EDS, XRD, TEM, FT-IR analyses, and N2 adsorption/desorption. Its supercapacitive performance in 6 M KOH was investigated via cyclic voltammetry (CV) and galvanostatic charging/discharging (GCD). The cyclic stability was studied via GCD and electrochemical impedance spectroscopy (EIS). The materials showed an exceptional Csp as compared to the Csp of those reported in the literature.
2. Experimental methods
2.1. Preparation of MnCoFeO4
To obtain MnCoFeO4, 0.005 mole of MnCl2·4H2O was dissolved in 50 ml deionized water, 0.005 mole of CoCl2·6H2O was dissolved in 50 ml deionized water, and 0.01 mole of anhydrous FeCl3 was dissolved in 250 ml deionized water. The three solutions were mixed together with continuous stirring and kept at 65 °C until thermal equilibrium was achieved. Then, 100 ml of 0.8 M NaOH solution was added dropwise to the mixed solution with continuous stirring and a black precipitate was formed. The formed precipitate was separated from the liquid phase and washed several times with deionized water via centrifugation until neutrality. The neutrality of the decanted aliquot was checked using phenolphthalein indicator. Finally, the washed precipitate was dried at 100 °C.2.2. Characterization of MnCoFeO4
Elemental composition was identified by means of energy-dispersive spectroscopy (EDS) using an Oxford EDS detector. The structural characteristics of the prepared material were investigated via X-ray diffraction (XRD) using a PANalytical X'pert PRO diffractometer with a Cu Kα radiation. The particle morphology of the prepared material was studied via high-resolution transmission electron microscopy (HR-TEM) using a JEOL JEM-2100 (Japan) electron microscope, operating at an accelerated voltage of 200 keV. Prior to the analysis, the sample was dispersed in ethanol using a probe sonicator and then a drop of the much-diluted sample solution was deposited on a carbon-coated copper grid and allowed to be evaporated at room temperature. Fourier transform infrared (FT-IR) spectroscopy was performed in the range of 400–4000 cm−1 to determine the metal oxide peaks using a PerkinElmer Spectrum One spectrophotometer. The adsorption capability of the prepared material and its specific surface area were investigated by N2 gas adsorption/desorption (at 77 K) and Brunauer–Emmett–Teller (BET) analysis, respectively, using a Quantachrome NOVA Station A (version 11.03).2.3. Electrochemical measurements
A working electrode was prepared using a homogenous slurry of MnCoFeO4 with carbon black acting as a conductive additive and poly(vinylidene difluoride) acting as a binder in a DMF solvent with a weight ratio of 70![[thin space (1/6-em)]](https://www.rsc.org/images/entities/char_2009.gif) :
:![[thin space (1/6-em)]](https://www.rsc.org/images/entities/char_2009.gif) 20
20![[thin space (1/6-em)]](https://www.rsc.org/images/entities/char_2009.gif) :
:![[thin space (1/6-em)]](https://www.rsc.org/images/entities/char_2009.gif) 10. The prepared slurry was stirred for about 48 h at room temperature, then coated onto a part of a 1 cm × 2 cm chip of nickel foam (as a supporter and current collector) and dried at 60 °C. The supercapacitive performance of the prepared MnCoFeO4 electrode was investigated using a three-electrode cell containing the working electrode (the prepared electrode under study), a counter electrode (a Pt coil) and a reference electrode (a saturated calomel electrode, SCE) in a 6 M KOH solution at room temperature. The electrochemical measurements involved cyclic voltammetry (CV), galvanostatic charging/discharging (GCD), and electrochemical impedance spectroscopy (EIS) using the electrochemical workstation (CHI 760D, CH Instruments, U.S.A.). CV measurements were performed within the potential window of 0–0.45 V at different scan rates (from 1 to 100 mV s−1). GCD measurements were carried out at different current densities (1.5–10 A g−1) within the same potential window. The EIS measurements were performed in the frequency range of 100 kHz to 0.1 Hz at the steady-state open circuit potential (0.261 V vs. SCE) with a sinusoidal perturbation amplitude of 10 mV. EIS parameters were derived using EC-Lab V10.40 software.
10. The prepared slurry was stirred for about 48 h at room temperature, then coated onto a part of a 1 cm × 2 cm chip of nickel foam (as a supporter and current collector) and dried at 60 °C. The supercapacitive performance of the prepared MnCoFeO4 electrode was investigated using a three-electrode cell containing the working electrode (the prepared electrode under study), a counter electrode (a Pt coil) and a reference electrode (a saturated calomel electrode, SCE) in a 6 M KOH solution at room temperature. The electrochemical measurements involved cyclic voltammetry (CV), galvanostatic charging/discharging (GCD), and electrochemical impedance spectroscopy (EIS) using the electrochemical workstation (CHI 760D, CH Instruments, U.S.A.). CV measurements were performed within the potential window of 0–0.45 V at different scan rates (from 1 to 100 mV s−1). GCD measurements were carried out at different current densities (1.5–10 A g−1) within the same potential window. The EIS measurements were performed in the frequency range of 100 kHz to 0.1 Hz at the steady-state open circuit potential (0.261 V vs. SCE) with a sinusoidal perturbation amplitude of 10 mV. EIS parameters were derived using EC-Lab V10.40 software.
The specific capacitance (Csp, F g−1) was then calculated from data obtained from CV and GCD measurements according to eqn (1)10,22 and (2)14,17,38 respectively.
 | (1) |
 | (2) |
 | (3) |
 | (4) |
eqn (4) can be reformed as follows:
 | (5) |
 | (6) |
3. Results and discussion
3.1. Material characterization
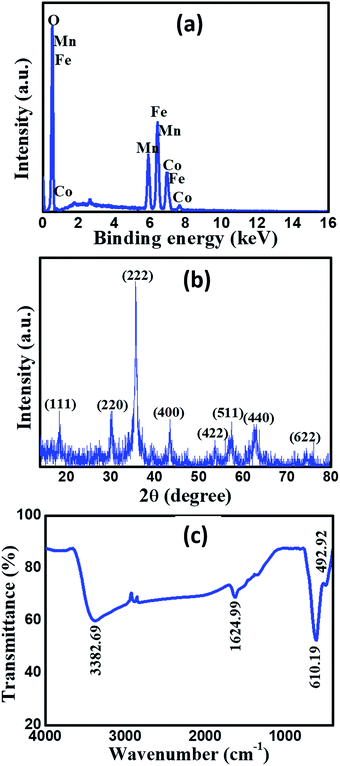
Fig. 1a demonstrates the EDS spectrum of the prepared MnCoFeO4, showing the peaks of Mn, Co, Fe, and O elements. The presence of these elements in the formed precipitate confirmed that Mn, Co, and Fe have co-precipitated simultaneously in the oxide form. The elemental composition obtained from EDS analysis reveals that the atomic percentages of Mn, Co, Fe, and O are 10.14%, 9.81%, 18.75%, and 61.30%, respectively. As a result, their atomic ratio is approximately 1![[thin space (1/6-em)]](https://www.rsc.org/images/entities/char_2009.gif) :
:![[thin space (1/6-em)]](https://www.rsc.org/images/entities/char_2009.gif) 1
1![[thin space (1/6-em)]](https://www.rsc.org/images/entities/char_2009.gif) :
:![[thin space (1/6-em)]](https://www.rsc.org/images/entities/char_2009.gif) 2
2![[thin space (1/6-em)]](https://www.rsc.org/images/entities/char_2009.gif) :
:![[thin space (1/6-em)]](https://www.rsc.org/images/entities/char_2009.gif) 6. Fig. 1b shows the XRD pattern of the prepared material. All diffraction peaks are coincident to the Miller indices (111), (220), (222), (400), (422), (511), (440) and (622) of the standard data for MnCoFeO4 (cubic, space group: Fd
6. Fig. 1b shows the XRD pattern of the prepared material. All diffraction peaks are coincident to the Miller indices (111), (220), (222), (400), (422), (511), (440) and (622) of the standard data for MnCoFeO4 (cubic, space group: Fd![[3 with combining macron]](https://www.rsc.org/images/entities/char_0033_0304.gif) m, ICDD card number: 04-010-1895), which confirms the formation of MnCoFeO4 with the spinel structure. Fig. 1c displays the FT-IR spectrum of MnCoFeO4 recorded in the frequency range 4000–400 cm−1. The lower-frequency band (493 cm−1) is assigned to the octahedral groups ([Fe3+–O2−] and [Mn3+–O2−]), while the higher-frequency band (610 cm−1) is assigned to the stretching of the tetrahedral groups ([Co2+–O2−]) present in the spinel ferrite.12 The FT-IR absorption bands appearing at 3383 cm−1 and 1625 cm−1 are referred to adsorbed water molecules.41
m, ICDD card number: 04-010-1895), which confirms the formation of MnCoFeO4 with the spinel structure. Fig. 1c displays the FT-IR spectrum of MnCoFeO4 recorded in the frequency range 4000–400 cm−1. The lower-frequency band (493 cm−1) is assigned to the octahedral groups ([Fe3+–O2−] and [Mn3+–O2−]), while the higher-frequency band (610 cm−1) is assigned to the stretching of the tetrahedral groups ([Co2+–O2−]) present in the spinel ferrite.12 The FT-IR absorption bands appearing at 3383 cm−1 and 1625 cm−1 are referred to adsorbed water molecules.41
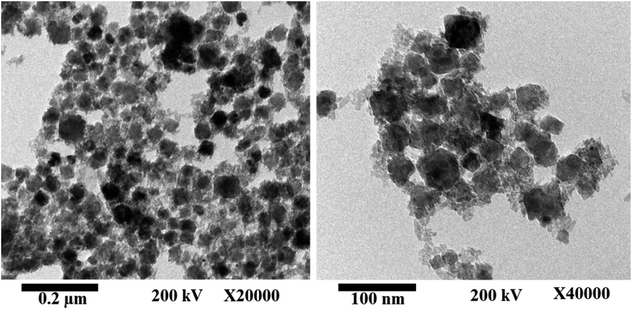
Fig. 2 shows the HR-TEM images of the as-fabricated MnCoFeO4, indicating the formation of nanoparticles with sizes ranging ca. 30–40 nm. Fig. 3a shows the N2 adsorption/desorption isotherm for the as-synthesized MnCoFeO4. According to the IUPAC classification of gas adsorption/desorption isotherms,43 the obtained N2 adsorption/desorption isotherm is of type IV, which is characteristic to the mesoporous materials. The characteristic feature of this isotherm is its hysteresis loop, which arises when the adsorption and desorption curves do not coincide and is associated with the capillary condensation taking place in the mesopores. Moreover, the initial part, where adsorption/desorption curves are coincident, is attributed to the monolayer-multilayer adsorption. These features confirm the mesoporous structure of the prepared MnCoFeO4. It is worth mentioning that porous materials are generally classified according to their pore diameter (d) into three categories: macroporous (d > 50 nm), mesoporous (d = 2–50 nm), and microporous materials (d < 2 nm).5 Fig. 3b shows the pore diameter distribution curve obtained by the Barrett–Joyner–Halenda (BJH) method using the desorption branch of the nitrogen isotherm.17 It reveals an average pore diameter of 10.036 nm. The BET method likely yields a value of actual surface area if the isotherm is either of type II or type IV.43 Hence, the surface area obtained from multipoint BET is noted to be 104.963 m2 g−1.
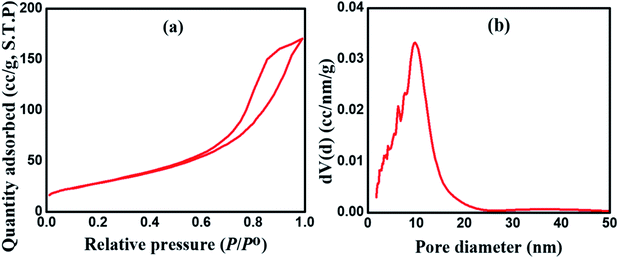 | ||
| Fig. 3 (a) N2 adsorption/desorption isotherm and (b) BJH pore size distribution for the as-prepared MnCoFeO4. | ||
3.2. Electrochemical characterization
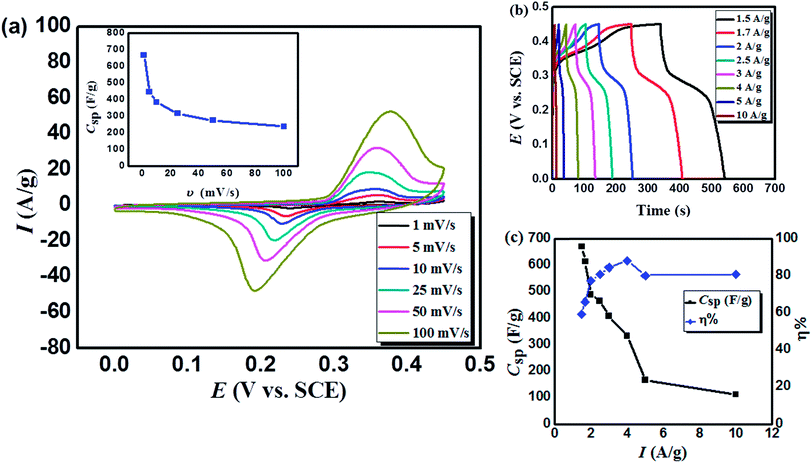
Moreover, Fig. 4a demonstrates the pairs of distinct and broad redox peaks corresponding to the redox transitions of Co3+/Co2+ and Mn3+/Mn2+. The redox peaks of Co3+/Co2+ and Mn3+/Mn2+ seem to be merging together because their standard electrode potentials are comparable (1.92 and 1.50 VNHE, respectively45). The probable processes associated with the capacitive behavior of MnCoFeO4 can be related to the presence of two redox systems. The redox reactions related to both systems could proceed according to eqn (7)46 and (8)42, respectively.
| Co2+/Co3+ system: CoFe2O4 + OH− + H2O ↔ 2FeOOH + CoOOH + e | (7) |
| Mn2+/Mn3+ system: MnFe2O4 + OH− + H2O ↔ 2FeOOH + MnOOH + e | (8) |
The CV profiles (at different scan rates) demonstrate the same behavior, revealing the reversibility of the redox reactions. In addition, with the increase in the scan rate, both oxidation and reduction peaks shift towards more anodic and cathodic directions, respectively. For example, upon increasing the scan rate from 1 to 100 mV s−1, the anodic peak potential (Ep,a) increased from 0.358 to 0.378 VSCE, while the anodic peak current (Ip,a) increased from 2.063 to 52.494 (A g−1). This effect results from the unavoidable overpotential due to the increase in the internal diffusion resistance and Ip increases with υ due to the fast interfacial kinetics.14
Galvanostatic charge/discharge (GCD) measurement is an accurate technique for determining the electrochemical performance of supercapacitors particularly for those based on pseudo-capacitance.40 Fig. 4b displays the GCD curves recorded for MnCoFeO4 in 6 M KOH. Unlike the GCD curves of carbon-based materials exhibiting a semi-triangular shape, where their capacitances are mainly attributed to a pure electric double layer capacitance, the GCD curves of MnCoFeO4 show deviations from linearity due to its pseudocapacitive nature.22,47 Clearly, the MnCoFeO4 electrode demonstrates higher charging and discharging times as the current density decreases, resulting in higher values of specific capacitance (Fig. 4c). For example, on decreasing the current density from 10 A g−1 to 1.5 A g−1, Csp increases from 112 to 670 F g−1. Furthermore, the columbic efficiency (η%) increases with the current density up to 89% at 4 A g−1, after which it becomes constant (∼81%).
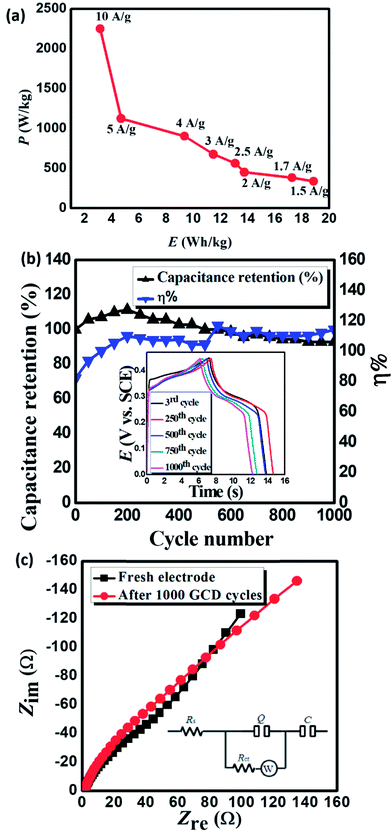
Power density (PD) and energy density (ED) are two important parameters for the evaluation of the electrochemical performance of supercapacitors and electrode materials.40 Fig. 5a displays the Ragone plot of MnCoFeO4 obtained from GCD measurements48 with the current densities ranging from 1.5 to 10 A g−1. Fig. 5a demonstrates that the ED stored in MnCoFeO4 and its corresponding PD (at a current density of 1.5 A g−1) are 18.85 W h kg−1 and 337.50 W kg−1, respectively. On the other hand, at a current density of 10 A g−1, ED and PD values are 3.15 W h kg−1 and 2250.00 W kg−1, respectively. Table 1 depicts the supercapacitive performance parameters, including Csp, PD, and ED for MnCoFeO4 and some ternary and quaternary TM ferrites. It should be noted that MnCoFeO4 has an excellent Csp and PD in comparison to those of the previously investigated materials.
EIS is a powerful tool used to investigate the features of an electrode/electrolyte interface as supercapacitors by evaluating the frequency behavior and equivalent series resistance (ESR).37 EIS offers information about the internal resistance of the electrode material and the resistance between the electrode and the electrolyte.40 EIS spectra (Fig. 5c) display a depressed semicircle in the high-frequency region linked to an inclined straight line in the low-frequency region. The slope of the inclined line is decreased after 1000 GCD cycles. The equivalent circuit used to analyze EIS spectra is depicted in the inset of Fig. 5c.48
The time constant (QRctW) represents the depressed semicircle in the high-frequency region, where Rct is the charge-transfer resistance caused by the faradaic process and Q is a constant phase element representing the non-ideal double-layer capacitance. Table 2 reveals that Rs, representing the ESR, remains nearly constant even after 1000 GCD cycles. The ESR includes electrolyte resistance, internal resistance of the electrode and contact resistance between the electrode and the current collector.5 Rct suffers a slight increase from 53.37 Ω to 78.74 Ω, indicating that the amount of charge stored in this material is slightly decreased. The linear part of the curve is inclined by ∼45°, indicating Warburg impedance (W) that is related to the frequency-dependent diffusion resistance of electrolyte ions.15,17,47 The value of W increases from 59.67 Ω s−0.5 to 101.90 Ω s−0.5, indicating a slowdown in the diffusion rate due to a somewhat difficult penetration of electrolyte ions through the electrode mesopores with long-term use.
| Fresh electrode | After 1000 cycles | |
|---|---|---|
| Rs (Ω) | 1.74 | 1.76 |
| Q (mF) | 2.68 | 2.57 |
| n | 0.86 | 0.87 |
| Rct (Ω) | 53.37 | 78.74 |
| W (Ω s−0.5) | 59.67 | 101.90 |
| C (mF) | 35.10 | 84.90 |
4. Conclusions
Mesoporous MnCoFeO4 nanoparticles, with diameters in the range 30–40 nm, were successfully synthesized via a one-pot simple co-precipitation method without annealing as confirmed by the TEM analysis. The XRD results confirmed the spinel structure of the fabricated MnCoFeO4 nanoparticles. The BJH average pore diameter was found to be 10.036 nm and the BET surface area was 104.963 m2 g−1. The as-prepared MnCoFeO4 material was evaluated as a supercapacitor electrode in 6 M KOH using CV and GCD measurements. The maximum Csp calculated from CV measurement was 675 F g−1 at a scan rate of 1 mV s−1 and that calculated from GCD measurement was 670 F g−1 at a current density of 1.5 A g−1. The energy and power densities of the MnCoFeO4 supercapacitor were 18.85 Wh kg−1 and 337.50 W kg−1, respectively at a current density of 1.5 A g−1. The cyclic stability was scrutinized via GCD and EIS. The capacitance retention (%) was 111.43% and 92.86% after 200 and 1000 GCD cycles, respectively, indicating an excellent long-term stability. The equivalent series resistance (ESR) remained nearly the same even after 1000 GCD cycles.Conflicts of interest
There are no conflicts to declare.Acknowledgements
All facilities provided by the American University in Cairo, Egyptian Petroleum Research Institute and Cairo University are greatly appreciated.Notes and references
- E. M. Gabr, S. M. Mohamed, S. A. El-Temtamy and T. S. Gendy, Egypt. J. Pet., 2016, 25, 65–74 CrossRef.
- L. Hao, X. Li and L. Zhi, Adv. Mater., 2013, 25, 3899–3904 CrossRef CAS PubMed.
- C. Liu, F. Li, L. P. Ma and H. M. Cheng, Adv. Mater., 2010, 22, E28–E62 CrossRef CAS PubMed.
- N. Choudhary, C. Li, J. Moore, N. Nagaiah, L. Zhai, Y. Jung and J. Thomas, Adv. Mater., 2017, 29, 1605336 CrossRef PubMed.
- A. Yu, V. Chabot and J. Zhang, Electrochemical supercapacitors for energy storage and delivery: fundamentals and applications, CRC Press, New York, 2013 Search PubMed.
- F. Béguin, V. Presser, A. Balducci and E. Frackowiak, Adv. Mater., 2014, 26, 2219–2251 CrossRef PubMed.
- D. Chen, Q. Wang, R. Wang and G. Shen, J. Mater. Chem. A, 2015, 3, 10158–10173 CAS.
- D. M. El-Gendy, N. A. A. Ghany, E. F. El Sherbini and N. K. Allam, Sci. Rep., 2017, 7 DOI:10.1038/srep43104.
- S. Faraji and F. N. Ani, Renewable Sustainable Energy Rev., 2015, 42, 823–834 CrossRef CAS.
- K. Bindu, K. Sridharan, K. M. Ajith, H. N. Lim and H. S. Nagaraja, Electrochim. Acta, 2016, 217, 139–149 CrossRef CAS.
- D. Ham, J. Chang, S. H. Pathan, W. Y. Kim, R. S. Mane, B. N. Pawar, O.-S. Joo, H. Chung, M.-Y. Yoon and S.-H. Han, Curr. Appl. Phys., 2009, 9, S98–S100 CrossRef.
- B. Bhujun, M. T. T. Tan and A. S. Shanmugam, Results Phys., 2017, 7, 345–353 CrossRef.
- Y. Zhang, L. Li, H. Su, W. Huang and X. Dong, J. Mater. Chem. A, 2015, 3, 43–59 CAS.
- L. Liu, H. Zhang, Y. Mu, Y. Bai and Y. Wang, J. Power Sources, 2016, 327, 599–609 CrossRef CAS.
- M. K. Zate, S. M. F. Shaikh, V. V. Jadhav, K. K. Tehare, S. S. Kolekar, R. S. Mane, M. Naushad, B. N. Pawar and K. N. Hui, J. Anal. Appl. Pyrolysis, 2015, 116, 177–182 CrossRef CAS.
- Y. Zhang, Q.-q. Yao, H.-l. Gao, L.-s. Zhang, L.-z. Wang, A.-q. Zhang, Y.-h. Song and L.-x. Wang, J. Anal. Appl. Pyrolysis, 2015, 111, 233–237 CrossRef CAS.
- M. M. Vadiyar, S. S. Kolekar, J.-Y. Chang, A. A. Kashale and A. V. Ghule, Electrochim. Acta, 2016, 222, 1604–1615 CrossRef CAS.
- S. Navale, V. Mali, S. Pawar, R. Mane, M. Naushad, F. Stadler and V. Patil, RSC Adv., 2015, 5, 51961–51965 RSC.
- H. Wu and K. Lian, J. Power Sources, 2014, 271, 534–537 CrossRef CAS.
- J. Xu, T. Ding, J. Wang, J. Zhang, S. Wang, C. Chen, Y. Fang, Z. Wu, K. Huo and J. Dai, Electrochim. Acta, 2015, 174, 728–734 CrossRef CAS.
- B. Lokhande, R. Ambare and S. Bharadwaj, Measurement, 2014, 47, 427–432 CrossRef.
- P. Xiong, H. Huang and X. Wang, J. Power Sources, 2014, 245, 937–946 CrossRef CAS.
- A. Shanmugavani, D. Kalpana and R. K. Selvan, Mater. Res. Bull., 2015, 71, 133–141 CrossRef CAS.
- Y. Xu, J. Wei, J. Yao, J. Fu and D. Xue, Mater. Lett., 2008, 62, 1403–1405 CrossRef CAS.
- Y. Asano, K. Nakaoka, K. Murashiro, T. Komatsu and K. Hoshino, Mater. Lett., 2012, 81, 162–164 CrossRef CAS.
- S. Giri, D. Ghosh, A. P. Kharitonov and C. K. Das, Funct. Mater. Lett., 2012, 05, 1250046 CrossRef.
- V. V. Jadhav, M. K. Zate, S. Liu, M. Naushad, R. S. Mane, K. N. Hui and S.-H. Han, Appl. Nanosci., 2016, 6, 511–519 CrossRef CAS.
- M. Li, W. Xu, W. Wang, Y. Liu, B. Cui and X. Guo, J. Power Sources, 2014, 248, 465–473 CrossRef CAS.
- X.-q. Bao, J. Zhu, X.-x. Gao, Y. Qiao and S.-z. Zhou, J. Magn. Magn. Mater., 2009, 321, 1832–1837 CrossRef CAS.
- M. Zhu, X. Zhang, Y. Zhou, C. Zhuo, J. Huang and S. Li, RSC Adv., 2015, 5, 39270–39277 RSC.
- P. R. Graves, C. Johnston and J. J. Campaniello, Mater. Res. Bull., 1988, 23, 1651–1660 CrossRef CAS.
- J.-L. Bernard, N. Baffier and M. Huber, J. Solid State Chem., 1973, 8, 50–56 CrossRef CAS.
- D. Kulkarni, Curr. Sci., 1974, 43, 374–375 CAS.
- J. Martens, J. Appl. Phys., 1986, 59, 3820–3823 CrossRef CAS.
- I. Chassaing, L. Presmanes, P. Tailhades and A. Rousset, Solid State Ionics, 1992, 58, 261–267 CrossRef CAS.
- M. Laarj, S. Kacim and B. Gillot, J. Solid State Chem., 1996, 125, 67–74 CrossRef CAS.
- P. Guo, Z. Li, S. Liu, J. Xue, G. Wu, H. Li and X. S. Zhao, J. Mater. Sci., 2017, 52, 5359–5365 CrossRef CAS.
- Z. Wang, W. Jia, M. Jiang, C. Chen and Y. Li, Nano Res., 2016, 9, 2026–2033 CrossRef CAS.
- A. Rai, A. L. Sharma and A. K. Thakur, Solid State Ionics, 2014, 262, 230–233 CrossRef CAS.
- W. Wang, Q. Hao, W. Lei, X. Xia and X. Wang, J. Power Sources, 2014, 269, 250–259 CrossRef CAS.
- M. A. Mousa, M. Khairy and M. Shehab, J. Solid State Electrochem., 2017, 21, 995–1005 CrossRef CAS.
- P. Xiong, C. Hu, Y. Fan, W. Zhang, J. Zhu and X. Wang, J. Power Sources, 2014, 266, 384–392 CrossRef CAS.
- K. S. Sing, Pure Appl. Chem., 1985, 57, 603–619 CrossRef CAS.
- D. K. Pawar, S. M. Pawar, P. S. Patil and S. S. Kolekar, J. Alloys Compd., 2011, 509, 3587–3591 CrossRef CAS.
- M. D. Arning and S. D. Minteer, in Handbook of Electrochemistry, Elsevier, 2007 Search PubMed.
- J. Hao, W. Yang, Z. Zhang, B. Lu, B. Zhang and J. Tang, Electrochim. Acta, 2015, 152, 13–18 CrossRef CAS.
- H. Che, A. Liu, J. Mu, C. Wu and X. Zhang, Ceram. Int., 2016, 42, 2416–2424 CrossRef CAS.
- S. G. Mohamed, S. Y. Attia and N. K. Allam, Mater. Today Energ., 2017, 4, 97–104 CrossRef.
- B. Bhujun, M. T. T. Tan and A. S. Shanmugam, Ceram. Int., 2016, 42, 6457–6466 CrossRef CAS.
| This journal is © The Royal Society of Chemistry 2017 |

