
 Open Access Article
 This Open Access Article is licensed under a
 Creative Commons Attribution 3.0 Unported Licence
Sodium-alginate biopolymer as a template for the synthesis of nontoxic red emitting Mn2+-doped CdS nanoparticles†
M. Kuzmanović ab,
D. K. Božanić*bc,
D. Milivojevićc,
D. Mitić Ćulafićd,
S. Stankovićd,
C. Ballesterose and
J. Gonzalez-Benito*b
ab,
D. K. Božanić*bc,
D. Milivojevićc,
D. Mitić Ćulafićd,
S. Stankovićd,
C. Ballesterose and
J. Gonzalez-Benito*b
aDepartment of Material Science and Engineering, Faculty of Engineering and Architecture, Ghent University, Technologiepark 915, 9052 Zwijnaarde, Belgium
bDepartment of Materials Science and Engineering and Chemical Engineering, IQMAAB, Universidad Carlos III de Madrid, Avenida de la Universidad 30, 28911 Leganés (Madrid), Spain. E-mail: javid@ing.uc3m.es; Fax: +34 916249430; Tel: +34 916248870
cUniversity of Belgrade, Vinča Institute of Nuclear Sciences, P.O. Box 522, 11001 Belgrade, Serbia. E-mail: bozanic@vinca.rs
dUniversity of Belgrade, Faculty of Biology, Center for Genotoxicology and Ecogenotoxicology, Studentski trg 16, 11001 Belgrade, Serbia
eDepartment of Physics, Universidad Carlos III de Madrid, Avenida de la Universidad 30, 28911 Leganés (Madrid), Spain
First published on 21st November 2017
Abstract
Manganese-doped cadmium sulfide (CdS:Mn) nanoparticles were prepared by chemical synthesis using sodium-alginate as template. The preparation of the nanocomposites involved ionic crosslinking of the biopolymer by dimerization of its α-L-guluronic monomers with Cd2+ and subsequent formation of the semiconductor nanoparticles upon addition of sulfide ions in the presence of Mn2+. The crystalline phase of CdS in the material was confirmed by XRD. The surface morphology of the nanocomposites was investigated by SEM. The observation by TEM showed that the CdS:Mn particles were spherical in shape with diameters of approximately 4 nm. EPR measurements of the CdS:Mn-alginate nanocomposite showed that the Mn2+ ions were incorporated in cationic sites of CdS with lower symmetry. Due to a distorted crystal field induced by the Mn2+ ions, photoluminescence spectra of the CdS:Mn-alginate showed red fluorescence between 650 nm and 750 nm falling into the optical window for bioimaging in which the light has its maximum tissue penetration depth. It was demonstrated that the interaction between the nanoparticles and the matrix prevents release of CdS into the environment, leading to low acute toxicity of the nanocomposites.
1. Introduction
An important part of modern nanoscience and nanotechnology is the investigation of new materials composed of a polymer matrix filled with semiconductor nanoparticles.1,2 These types of nanocomposites combine characteristic optical, electrical, magnetic or catalytic properties of semiconductors with the chemical stability and processability of polymers. Apart from representing good host matrices, polymers can also act as templates to control semiconductor nanoparticle growth and surface properties. These specific features have inspired investigations directed towards disclosure of possible applications of semiconductor-polymer nanocomposites.3–5 An ongoing endeavor of fabrication of semiconductor nanostructures for biomedical applications has led to the development of procedures that employ polysaccharides, such as starch, cellulose, chitosan, alginate etc., as matrices for encapsulation of semiconductor nanoparticles.6–14 In addition to being highly abundant, biocompatible and biodegradable, these biopolymers have specific macromolecular structure that presents a good environment for the controlled growth of metallic and semiconductor nanoparticles.Alginic acid or alginate, a macromolecule extracted from brown marine algae, is a block-copolymer of (1,4)-linked β-D-mannuronic and α-L-guluronic (G) acids.15 The key property of alginate regarding its application as a template for the controlled growth and stabilization of nanostructures is its affinity for divalent metals.16 The interaction of alginate with divalent cations takes place via carboxylate groups of α-L-guluronic monomers that results in dimerization of α-L-guluronic block sequences and ordered, e.g. “egg-box”, conformation of the biopolymer. Due to this ionic cross-linking the diffusion of cations throughout the matrix is limited that, in the case of nanoparticle formation during in situ chemical syntheses, results in narrow size distribution of the resulting nanostructures and good dispersion of the inorganic phase in the matrix. Besides, as a consequence of the change in conformation of alginate high concentrations of the nanoparticles relative to the polymer can be achieved. Moreover, due to its amphiphilic nature, alginate can be employed to obtain biocompatible and water-soluble quantum dots via phase transfer, as it was previously shown by Wang et al. in the case of CdSe/ZnS nanoparticles.17 This polysaccharide was already used as an environment for controlled growth of II–VI semiconductors,18 Co, Ni, and CoNi nanoparticles,19 iron oxide nanostructures20 as well as antimicrobial ZnO nanoparticles21,22 and hybrid ZnO/Ag nanocubes.23 However, to the best of our knowledge, alginates were not used for the preparation of diluted magnetic semiconductor nanoparticles such as the CdS:Mn described in the present work. In this study, we used an in situ chemical synthesis for the preparation of CdS:Mn-alginate nanocomposites in which the nanoparticles were formed directly within the biopolymer matrix.
Cadmium sulfide is an n-type II–VI semiconductor with a direct band gap of ∼2.4 eV and an exciton Bohr radius, ab, of ∼2.8 nm.24 Furthermore, due to size-dependent luminescence in the visible range, CdS nanostructures have found application in optoelectronics and photoconductive devices3,4 or as a core component in core–shell quantum dots for biomedical imaging.5 Photoluminescent properties of CdS nanoparticles, as well as quantum dots in general, are very sensitive to their environment, as well as to surface characteristics of the nanoparticle, because of the presence of surface defects such as sulfur vacancies or sulfur dangling bonds.25 Efficient modification of optical properties of CdS nanomaterials can be achieved by doping of the semiconductor with transition metal ions (Cu2+, Fe2+, Mn2+ etc.). This way, discrete energy states, formed by splitting of the ionic levels under the influence of the crystal field of the host's lattice, are being introduced into the band gap of the semiconductor.26 The excitation/emission processes from these atomic-like states are usually very efficient and the photoluminescence of the dopant usually dominates the exciton photoemission from the host.27,28 Furthermore, a complete suppression of the emission from surface states of CdS upon doping with Mn2+ ions was reported.27 For bioimaging applications in particular, the photoemission from atomic-like states of doped quantum dots provide additional advantages in comparison to exciton luminescence such as negligible self-quenching, substantial Stokes shift and large photoluminescence lifetime.29
In the case of Mn2+ doped wide band gap II–VI semiconductors, the emission originates from localized 3d states that are strongly affected by the crystal field of the lattice site occupied by the ion.30,31 For Mn2+ positioned in sites with tetrahedral coordination, spin-sextet 6S ground state and spin-quartet 4G, 4P, 4D, and 4F excited states of free ion split into 6A1 (6S), 4T1 (4G), 4T2 (4G), 4E (4G), 4A1 (4G), 4E (4D), and 4T2 (4D) energy levels under the influence of the crystal field.26,32 The transitions between the energy levels in free Mn2+ ions are spin forbidden and inefficient. On the other hand, upon light absorption, electrons from the 6A1 (6S) state are being transferred to 4E (4G) and 4A1 (4G) energy states and, subsequently recombine the first excited 4T1 (4G) state by nonradiative transitions.33 Finally, transitions between the 4T1 (4G) state and the lowest 6A1 (6S) state take place resulting in a typical 2.12 eV (585 nm) yellow emission of Mn2+ in the semiconductor host.27 Contrary to II–VI semiconductor nanostructures, the photoluminescence of Mn2+ is not affected significantly by the change in size of the particles and it does not depend significantly on the composition of the nanostructured host.34,35 However, it does depend on the crystal field strength since, in the case of tetrahedral coordination, the increased splitting of the triplet 4T1 (4G) state would lead to decrease in the energy difference between 4T1 (4G) and 6A1 (6S) state and, consequently, to the red shift of the emission.36,37 The effect of the crystal field strength, however, on the position of the photoluminescence band of Mn-doped semiconductor nanostructures is very small,30 whereas the energy of emitted photons is affected to a greater extent by the changes in the crystal field symmetry. Sarma and co-authors35 showed that luminescence of Mn2+ doped ZnS–CdS alloy nanocrystals can be tuned in the wide range between 1.9 eV and 2.4 eV, as a consequence of the availability of different lattice sites with different crystal fields that Mn2+ ions can occupy.
In this article, we report on structural and optical characteristics of manganese doped cadmium sulfide nanoparticles prepared in aqueous solution by an in situ chemical synthesis using biocompatible Na-alginate biopolymer as a template. It will be studied how the distorted crystal field surrounding the Mn2+ ions affects the CdS:Mn-alginate nanocomposites photoluminescence regarding their potential use in bioimaging, since particular photoluminescent characteristics of the nanocomposites coupled with the biocompatibility of alginate open up a possibility of application of the prepared materials as fluorescent substrates for tissue imaging in the NIR domain.38
2. Experimental
2.1. Materials
The following materials were purchased from Sigma-Aldrich Chemical Co. and used as received: alginic acid sodium salt from brown algae (Na-alginate), cadmium acetate (Cd(CH3COO)2), thioacetamide (C2H5NS), and manganese(II) nitrate tetrahydrate (Mn(NO3)2). High purity water was used as a solvent in all synthesis steps.2.2. Preparation of the CdS-alginate and CdS:Mn-alginate nanocomposites
Batch aqueous solutions of Na-alginate (1 wt/vol%), Cd(CH3COO)2 (0.1 M), C2H5NS (0.1 M), and Mn(NO3)2 (0.1 M) were prepared shortly before the synthesis of the nanocomposites. To remove the residual oxygen the solutions were purged by nitrogen for 30 min prior to the synthesis of the nanocomposites.To prepare CdS-alginate and CdS:Mn-alginate nanocomposites, 25 mL of the Na-alginate solution was added drop by drop to 50 mL of 0.1 M of Cd(CH3COO)2 solution mixed previously with 0 mL, 0.5 mL, 1 mL, or 2 mL of 0.1 M Mn(NO3)2 solution subjected to a continuous flow of nitrogen. Due to the presence of Cd2+ ions, the biopolymer underwent the process of ionic cross-linking, which was manifested by the formation of a white solid precipitate in the reactor flask. The cross-linked polymer was collected and purified by 3 times centrifugation (3000 rpm for 5 minutes) and subsequent re-dispersion. After that, the purified cadmium cross-linked alginate (Cd-alginate) biopolymer was mixed with 50 mL of water and heated to 80 °C under constant stirring. While heating, 50 mL of the C2H5NS was added drop by drop to the dispersion. The cross-linked polymer pellets changed their color to yellow upon the addition of the sulfide source indicating the formation of the CdS:Mn nanoparticles. The reaction was carried out for 1 h under the same conditions, after which the dispersion was cooled to room temperature and centrifuged 3 times (3000 rpm, 15 min) in water and ethanol to separate the precipitate and remove residual chemicals. Finally, the nanocomposites were dried at ambient conditions and pulverized using a mortar. The estimated composition of the nanoparticles with respect to the biopolymer was 10 wt% CdS:Mn.
2.3. Characterization of the CdS-alginate and CdS:Mn-alginate nanocomposites
The X-ray diffraction (XRD) measurements were performed on a Philips X-PERT instrument using the Kα1/2 doublet lines of copper (wavelength λ = 0.154 nm).The surface morphology of the CdS-alginate and CdS:Mn-alginate nanocomposites was investigated by scanning electron microscopy (SEM) using a FEG SEM Jeol JSM-7600F instrument. Due to the poor conductivity of the materials, the samples were previously coated with gold using a Baltec SCD005 sputter coater.
The morphology of the CdS and CdS:Mn nanoparticles, as well as their dispersion within the alginate matrix were investigated by transmission electron microscopy (TEM) using a Philips Tecnai 20F FEG analytical microscope operating at 200 kV. High resolution TEM (HREM) images were acquired for studying the local crystalline quality. For these analyses the materials were grinded and mixed with ethanol, then a single drop of the resulting suspension was deposited on carbon-coated copper grids. TEM images were analyzed using Fiji software.39
The electron paramagnetic resonance (EPR) experiments were performed on an X-band MagnetTech MS300 spectrometer operating at a nominal frequency of 9.5 GHz. The used microwave power was 1 mW (microwave attenuation 20 dB), with a modulation amplitude of 0.2 mT.
The UV-vis diffuse reflectance spectroscopy measurements (DR) of the nanocomposites were carried out on a Thermo Evolution 600 spectrophotometer equipped with an integrating sphere diffuse reflectance accessory in the wavelength range from 200 nm to 900 nm. The UV-vis absorption function (F(R)) of the materials was estimated from the reflectance spectra using the Kubelka–Munk equation40
 | (1) |
| (F(R)hν)2 = const.(hν − Eg) | (2) |
The photoluminescence emission and excitation spectra of the CdS-alginate and CdS:Mn-alginate nanocomposites were recorded on a Edinburg, Analytical Instruments CD900 fluorescence spectrophotometer. The spectra were acquired using 10 μm slits and 1000 ms of integration time.
The analytical measurements of the amount of Cd2+ released from the CdS-alginate and CdS:Mn-alginate nanocomposites were performed by atomic absorption spectrometry (AAS) using Perkin Elmer AAnalyst 300 instrument. To perform these measurements, 10 mg of each nanocomposite was placed into clean glass vials containing 10 mL of sterile saline solution (0.9% NaCl). Subsequently, the vials were placed into an oven preheated to 37 °C and incubated for either one or two hours. Upon incubation, 1 mL of the solution obtained for each sample was diluted with 9 mL of saline. Thus obtained solutions were filtered using 0.45 μm filter, adjusted to pH = 2 using HNO3, and investigated by AAS. It is worth to mention that as a consequence of ionic crosslinking, the nanocomposites were not soluble in saline solution and the nanocomposite powders remained as precipitate at the bottom of the containers. Therefore, only Cd2+ ions released from the material into the saline solution were considered.
The Fourier transform infrared (FTIR) spectroscopy (Model Perkin Elmer Spectrum GX) was employed to study the specific interactions between the semiconductor nanoparticles and the alginate biopolymer in the nanocomposites. The measurements were carried out at room temperature in the 4000–400 cm−1 spectral range with a resolution of 4 cm−1. For these analyses, the nanocomposites were dried in vacuum and 2 mg of the material was mixed with 100 mg of KBr and pressed into pellets.
The thermogravimetric analysis (TGA) of the materials was performed on a Perkin Elmer STA 6000 device in the temperature interval from 50° to 800 °C with a heating rate of β = 20 °C min−1 and 20 mL min−1 flow of either nitrogen gas or air.
2.4. Cell toxicity studies of the CdS-alginate and CdS:Mn-alginate nanocomposites
Human fetal lung fibroblasts MRC-5 (ECACC no. 84101801) cell line was used in this study. The human cells were grown in Dulbecco's modified Eagle's (DMEM) medium containing 4.5% glucose and 2 mM of L-glutamine, supplemented with heat inactivated 10% fetal bovine serum, penicillin G (100 U mL−1) and streptomycin (100 μg mL−1), at 37 ○C with 5% CO2 and 100% humidity. Cell line grows attached to the surface and a single cell suspension was obtained using 0.1% trypsin. All media, enzymes and supplements for cell cultures were purchased from PAA Laboratories GmbH, Austria.The CdS-alginate and CdS:Mn-alginate nanocomposites were suspended in DMEM medium (in concentrations 0.5 and 1 mg mL−1) to allow elution of the material. The samples of each material were used after 1 h, 2 h and 24 h of elution. The eluates were sterilized by filtration through 0.22 μm filters (Sartorius, Germany) and subsequently used for the cytotoxicity testing. The pH values of the eluates (1 h, 2 h, and 24 h post-elution) were measured on a calibrated Sartorius PB-11 pH meter. The eluates of all tested materials were alkaline (pH = 8) for the duration of the experiment and there were no changes in the pH value over time.
The cytotoxicity of the nanocomposites was determined with the MTT (3-(4,5-dimethylthiazol-2-yl)-2,5-diphenyltetrazolium bromide) reduction assay. MRC-5 cells were seeded onto 96-well plates at a density of 3 × 10⁴ cells per well and incubated for 24 h at 37 °C to attach. The DMEM medium was then replaced with 200 μL of the eluates of each material (6 wells per group). Cells without added material served as a positive control. The cells were incubated for another 24 h at 37 °C and 5% CO2. Subsequently, the MTT (final concentration 0.5 mg mL−1) was added and the plates and they were incubated for additional 3 h. At the end of the incubation with MTT, the medium was removed, and the formazan crystals were dissolved in the DMSO. The optical density (OD) of the DMSO solution was measured at 570 nm (reference filter 690 nm) using a Thermo Scientific Multiscan FC microplate reading spectrophotometer. Cell viability was determined by comparing the OD of the wells containing cells treated with the eluates from the nanocomposites to the untreated cells. Six individual wells were measured per treatment point in two independent experiments.
The one-way analysis of variance of the results of the cytotoxic assay (non-parametric ANOVA, Mann–Whitney U test) was performed using Statistica software (StatSoft Statistica Ver. 6.0, USA).
The obtained results were compared to the MTT cytotoxicity test of a bulk CdS powder (99.99% pure powder, Sigma-Aldrich).
3. Results and discussion
3.1. Characterization of the nanocomposites
The preparation of CdS-alginate and CdS:Mn-alginate nanocomposites involved transformation of the biopolymer solution into cross-linked network by complexation of divalent cations with α-L-guluronic monomers and subsequent formation of the semiconducting nanoparticles within the cross-linked matrix by interaction of sulfide and cadmium ions at elevated temperature. FTIR analyses of the starting biopolymer, Cd2+ cross-linked alginate and CdS-alginate nanocomposite confirmed the interaction between the nanoparticles and the biopolymer (ESI, Fig. S1†). As it was shown by the TGA, the formation of the nanoparticles caused partial elimination of the interactions between the Cd2+ and COO− ions as suggests a lower thermal stability of the CdS-alginate nanocomposite in comparison to Cd-alginate both in inert and oxidative atmosphere (ESI, Fig. S2†).Structural analysis of synthesized biopolymer nanocomposites was carried out by XRD technique, and the results are presented in Fig. 1. The representative diffraction patterns of CdS-alginate and CdS:Mn (4 mol%)-alginate samples show maxima at 2θ angles 26.8°, 44.3° and 52.3° that correspond to (1 1 1), (2 2 0), and (3 1 1) crystallographic planes of a cubic F![[4 with combining macron]](https://www.rsc.org/images/entities/char_0034_0304.gif) 3m (sphalerite) CdS lattice (lattice parameter a = 0.5811 nm), respectively.42 The small contributions at ∼38° and 39.5° originate from the substrate. The XRD results suggested that the described synthesis procedure lead to the formation of the crystalline CdS phase in the material. The XRD peaks were very broad indicating small crystallite sizes. Using the Scherrer's equation, the average crystallite size of both CdS and CdS:Mn (4 mol%) particles was estimated to 3 nm from the half width of the diffraction peak corresponding to planes (1 1 1). The XRD patterns of CdS:Mn (1 mol%)- and CdS:Mn (2 mol%)-alginate showed similar features as the diffractogram of the nanocomposite with the highest concentration of manganese. It is important to mention that CdS, as well as Cd1−xMnxS, crystals can also adopt hexagonal (wurtzite) crystalline lattices.42,43 In the study on mercaptoethanol capped CdS nanoparticles, the authors showed that both phases coexist in equal proportions in the system.44 However, we were unable to estimate the relative contributions of the two phases due to the substantial width of the XRD peaks in the diffraction pattern of the nanocomposite.
3m (sphalerite) CdS lattice (lattice parameter a = 0.5811 nm), respectively.42 The small contributions at ∼38° and 39.5° originate from the substrate. The XRD results suggested that the described synthesis procedure lead to the formation of the crystalline CdS phase in the material. The XRD peaks were very broad indicating small crystallite sizes. Using the Scherrer's equation, the average crystallite size of both CdS and CdS:Mn (4 mol%) particles was estimated to 3 nm from the half width of the diffraction peak corresponding to planes (1 1 1). The XRD patterns of CdS:Mn (1 mol%)- and CdS:Mn (2 mol%)-alginate showed similar features as the diffractogram of the nanocomposite with the highest concentration of manganese. It is important to mention that CdS, as well as Cd1−xMnxS, crystals can also adopt hexagonal (wurtzite) crystalline lattices.42,43 In the study on mercaptoethanol capped CdS nanoparticles, the authors showed that both phases coexist in equal proportions in the system.44 However, we were unable to estimate the relative contributions of the two phases due to the substantial width of the XRD peaks in the diffraction pattern of the nanocomposite.
 | ||
| Fig. 1 The XRD patterns of CdS-alginate and CdS:Mn (4 mol%)-alginate nanocomposites. | ||
SEM micrographs of the grinded CdS-alginate, CdS:Mn (2 mol%)-alginate, and CdS:Mn (4 mol%)-alginate samples are presented in Fig. 2. In the case of the CdS-alginate nanocomposite (Fig. 2a), spherical formations approximately 50 nm in size can be observed on the surface of the sample. Although less pronounced, these structures were also detected in the SEM images of the CdS:Mn-alginate nanocomposites (Fig. 2b and c). We assume that these formations originate from the alginate that was cross-linked in the early stages of the process. More precisely, the formations are the regions with a high ionic cross-linking degree, since the concentration of the divalent cations at time of their creation was the highest. On the other hand, a lower occurrence of the regions with a high degree of the ionic cross-linking in the images of the CdS:Mn-alginate samples suggests that the presence of manganese interferes with the formation of chemical bonds between the Cd2+ ions and the carboxylate groups. Bearing in mind that, regardless of the composition of the biopolymer, Mn has a lower affinity for alginate than Cd,45 the observed decrease in the amount of spherical formation with an increase in Mn concentration further supports our assumption. As it will be seen in the Section 3.3, the differences in the surface morphology of CdS-alginate and CdS:Mn-alginate samples result in differences in the Cd ions release and cell toxicity of these nanocomposites.
 | ||
| Fig. 2 SEM images of (a) CdS-alginate, (b) CdS:Mn (2 mol%)-alginate, and (c) CdS:Mn (4 mol%)-alginate nanocomposite. | ||
Typical TEM images of the CdS-alginate and CdS:Mn (4 mol%)-alginate nanocomposites are presented in Fig. 3. The micrographs show spherical particles well dispersed within the alginate matrix. The images are weakly out of focus to increase the contrast. The good dispersion of the inorganic phase is a consequence of an in situ approach of the synthesis of the nanostructures, supplemented by the interaction between the Cd2+ ions and carboxylate groups of the α-L-guluronic residues of the biopolymer. In addition, the approach resulted in small particles with narrow size distribution (Fig. 3c). The average diameter of CdS nanoparticles was estimated to 3.6 ± 0.2 nm, while in the case of the CdS:Mn (4 mol%)-alginate nanocomposites the corresponding nanostructures were 3.9 ± 0.2 nm slightly longer than those estimated from the DRX results. TEM images of CdS:Mn (1 mol%)- and CdS:Mn (2 mol%)-alginate samples showed negligible differences in size and morphology of the nanoparticles in comparison to CdS:Mn (4 mol%)-alginate.
 | ||
| Fig. 3 Bright field TEM images of (a) CdS-alginate and (b) CdS:Mn (4 mol%)-alginate nanocomposites. (c) Particle size distribution histogram for CdS and CdS:Mn (4 mol%) particles. (d) HRTEM image a single CdS:Mn (2 mol%) particle, the corresponding FTP, and the HRTEM image distance profile in 3 nm × 1.5 nm particle area (the rectangle in the HRTEM image). | ||
High resolution TEM (HRTEM) analyses of an individual nanoparticle in the CdS:Mn (2 mol%)-alginate sample are presented in Fig. 3d. The image shows lattice fringes oriented in one direction along the whole surface of the nanoparticle indicating that the CdS:Mn nanostructures are composed of single crystals. This was further demonstrated by calculating the Fourier transform of the image (Fig. 3d), which was used to simulate the electron diffraction pattern. The single crystalline structure of the nanoparticle suggests that the final particles synthesized in situ are being formed by nucleation and growth processes rather than the aggregation of the neighboring cluster or particles. This formation mechanism is a consequence of Cd2+–COO− interaction (ESI, Fig. S1†) that must hinder diffusion of the CdS through the matrix. The distances between the crystallographic planes on the nanoparticle surface were calculated by averaging the interplanar separations in a 3 by 1.5 nm particle area (yellow rectangle on the HRTEM image in Fig. 3d). The average value was 0.205 ± 0.007 nm that, with the resolution achieved, corresponds to the distance between two consecutive (2 2 0) planes in sphalerite CdS. The distance profile of the HRTEM image intensity (gray value) along the direction perpendicular to the (2 2 0) planes is also presented in Fig. 3d. In addition, the profile illustrates irregularities in the periodicity of the fringes that is the consequence of the presence of defects in the crystalline structure of the nanoparticle.
The EPR spectrum of CdS:Mn (4 mol%)-alginate nanocomposite recorded at room temperature is shown in Fig. 4. It can be seen that the spectrum consists of a group of six narrow bands superimposed on a broad resonance. The broad signal originates from the smeared contribution due to non-central transitions and the magnetic dipole–dipole interaction of proximate Mn2+ ions, whereas the narrow six bands appear because of the hyperfine interaction between the electron and nuclear spin (I = 5/2) of Mn2+ ions. The sextet comes from isolated Mn2+ ions incorporated in the CdS lattice since Mn–Mn pairs or MnS do not produce the six-line spectrum that we observed. This result suggests that a much lower amount of Mn2+ than 4 mol% was incorporated in the lattice, while the residual manganese was removed in the purification steps (see Experimental). Since the hyperfine interactions strongly depend on the local environment of Mn2+ ions, the EPR spectrum can be used to provide more information on the specific location of the ions in the CdS lattice.
 | ||
| Fig. 4 (a) Experimental EPR spectrum of CdS:Mn (4 mol%)-alginate nanocomposite. (b) Simulated EPR spectrum for Mn2+ ions in the CdS lattice for A = 9.7 mT and D = 0 (red line) and the corresponding difference spectrum (green line). | ||
More specifically, a six-line pattern with a hyperfine splitting of A ∼ 6.9 mT is typical for Mn2+ located in cation sites with tetrahedral coordination and it is attributed to Mn2+ near the center of the nanocrystal.46 However, the spectrum of the sample under consideration (Fig. 4.) shows hyperfine structure with hyperfine splitting constant closer to the A ∼ 9.6 mT value that corresponds to the case when Mn2+ ions occupy sites with octahedral coordination. The high A value indicates an increase in the ionic character of the Mn2+ bonding, which is likely to be the case of cations located near the surface of the nanocrystals.47 This is somewhat expected result since for spherical CdS nanoparticles of approximately 4 nm in size, about 64% of cations are located in the surface shell one lattice constant wide (a = 0.5811 nm), while 93% of the cations are in the surface region that extends two lattice constants. Similar A values were established for Mn2+ doped CdS nanocrystals (9.6 mT),48 ZnS:Mn nanocrystals (9.5 mT),46 and in the surface layers of Mn-doped CdSe nanocrystals (8.9 mT).49
To determine contributions to the EPR spectrum of CdS:Mn-alginate nanocomposite other than that of Mn2+ ions in the octahedral coordination, we simulated a six line hyperfine spectrum with A = 9.7 mT and D = 0 (red line in Fig. 4b) and subtracted it from the experimental curve. The difference spectrum is presented by the green line in Fig. 4b. As it can be seen, it is composed of 5 equidistant peaks with positions in the middle of the corresponding simulated spectrum. Near the surface of the nanoparticle the crystal field symmetry is distorted and the axial fine structure parameter becomes relevant, leading to the relaxation of the ΔmI = 0 selection rule. Consequently, the peaks in the residual spectrum originate from 5 pairs of otherwise forbidden ΔmI = ±1 lines. The intense forbidden transitions are characteristic for polycrystalline and disordered materials,50 and reflect distortion of the crystal lattice surrounding Mn2+ ions. As it will be seen in the following section, the fact that Mn2+ ions occupy lattice sites with lower symmetry has significant implications on the photoluminescence spectra of CdS:Mn-alginate nanocomposites.
3.2. Optical properties of the nanocomposites
In Fig. 5 UV-vis diffuse reflectance spectra of CdS-alginate and CdS:Mn (4 mol%)-alginate nanocomposites are shown. Both curves show onsets at approximately 550 nm that corresponds to the optical electron transitions across the band structure of the semiconductors. Using the Tauc relation (eqn (2)) the optical bandgaps for the materials were estimated to Eg = 2.35 ± 0.08 eV (inset to Fig. 5). Previous reports28,32 also gave evidence of the negligible effect of doping by Mn2+ ions in low concentrations on the bandgap of the semiconductors. Obtained values are in agreement with the bandgap of the bulk,24 indicating absence of the exciton confinement in the nanostructures. This result is expected bearing in mind that the sizes of CdS and CdS:Mn nanoparticles exceed the value of the exciton Bohr radius of CdS. In addition, the similar values of the bandgaps found for both materials suggest that the introduction of Mn2+ ions into CdS lattice does not induce additional optically observable defects in the host, otherwise the bandgap of the CdS:Mn nanostructures would decrease. | ||
| Fig. 5 UV-vis diffuse reflectance spectra F(R) curves of CdS-alginate (red line) and CdS:Mn (4 mol%)-alginate (blue line) nanocomposites. Inset: Tauc graph corresponding to F(R) for both materials. | ||
The photoluminescence emission spectra of CdS:Mn (1 mol%)-, CdS:Mn (2 mol%)-, and CdS:Mn (4 mol%)-alginate nanocomposites obtained for 490 nm excitation are presented in Fig. 6a. The spectra of the materials show bands with maxima at approximately 570 nm (2.17 eV), as well as a broad red emission band with maxima at 650 nm (1.91 eV), 667 nm (1.86 eV), and 690 nm (1.80 eV) in the case of CdS:Mn (1 mol%)-, CdS:Mn (2 mol%)-, and CdS:Mn (4 mol%)-alginate nanocomposite, respectively. For comparison, the spectrum of CdS-alginate nanocomposite is also presented. The high energy band corresponds to exciton emission due to band to band electronic transitions in the nanostructured semiconductor, while the red photoluminescence originates from combined effects of the radiative transitions from the recombination of charge carriers via defect or surface states and the Mn2+ photoemission. The described photoluminescence of the nanocomposites was consistent with the change in the excitation wavelength between 470 nm and 500 nm (Fig. 5b).
 | ||
| Fig. 6 (a) Photoluminescence emission spectra of CdS-alginate and CdS:Mn-alginate nanocomposites (λexc = 490 nm). (b) Photoluminescence emission (PL) and excitation (PLE) spectra of CdS:Mn (4 mol%)-alginate nanocomposite. | ||
As it was mentioned previously, Mn2+ emission originates from localized 3d states that are strongly affected by the symmetry of the crystal field of the lattice site occupied by the ion. It was not possible to unambiguously resolve the yellow emission (585 nm) in the photoluminescence spectra of CdS:Mn nanocomposites that originates from the 4T1 to 6A1 transitions of Mn2+ ions positioned in sites with tetrahedral coordination. Consequently, the observed red emission of the nanocomposites, which, in addition is concentration dependent, indicates different local environments of the dopant. The red emission of Mn2+ in II–VI semiconductors was reported previously for hollow Cd1–xMnxS quantum wires,31 1-thioglycerol caped Mn2+ doped CdS nanoparticles,28,34 as well as on individual nanocrystals of ZnS–CdS alloys doped with Mn.35 In their combined experimental and ab initio theoretical study, Nag et al.34 showed that the red emission comes from the 3d-internal transition of Mn2+ ions located near the surface regions of the CdS host that are influenced by crystal fields of distorted tetrahedral symmetry. The EPR results of the present work are in accordance with that study. In addition, Chen et al.51 reported that the yellow Mn2+ emission can be red-shifted by applying pressure to ZnS:Mn2+ nanoparticles.
Therefore, due to limited diffusion of the Cd2+ and Mn2+ cations within the alginate matrix, Mn2+ ions are able to occupy only sites near the surface of CdS nanoparticles of lower than tetrahedral symmetry that leads to the observed red emission of the CdS:Mn-alginate nanocomposites. In addition, with an increase in Mn2+ concentration, the number of occupied sites with lower symmetry also increases, leading to the red shift of the red-emission band. It is worth to mention that the photoluminescence of the CdS:Mn-alginate nanocomposites falls into the near-infrared window useful for bioimaging and then opening the possibility of using this nanomaterials for tissue imaging applications.5
3.3. Cytotoxicity of CdS-alginate and CdS:Mn-alginate nanocomposites
Due to the inherent acute cytotoxicity of Cd-based quantum dots,52 CdS:Mn-alginate nanocomposites should be tested using MTT assay in order to see if they are suitable materials for the fluorescence bioimaging applications. The toxicity of CdS quantum dots is a consequence two factors. First factor is the toxicity of cadmium, which is well established and relies on an increase in oxidative stress, since this heavy metal acts as a catalyst in the formation of reactive oxygen species.53 The second factor is related to the small dimensions of quantum dots that results in their facile diffusion through tissues and their possible accumulation in the intracellular regions.54 Manganese, on the other hand, is an essential trace element required for enzymatic reactions. A recent study, however, reported that continuous exposure to this element may promote neurodegenerative damage.55 It was previously reported that coating of quantum dots by an appropriate surface layers reduces their toxicity (see for example ref. 52 and references therein). Consequently, we assume that the cytotoxicity of CdS-alginate and CdS:Mn-alginate nanocomposites would be low, since both the diffusion of the nanoparticles and the leaching of cadmium from the nanomaterial is inhibited by the interaction between the Cd2+ ions and the α-L-guluronic monomers of alginate.The amount of cadmium released from the 1.0 wt/vol% saline dispersion of CdS-alginate and CdS:Mn (4 mol%)-alginate nanocomposite, after 1 h and 2 h of leaching at 37 °C was measured by the AAS. The results are presented in Table 1. In the case of CdS-alginate sample, the detected concentration of Cd2+ did not exceed 1.5 ppm, while the amount of Cd2+ released from the CdS:Mn (4 mol%)-alginate nanocomposite was approximately 6 times higher. It is important to note that the initial concentration of Cd2+ in both samples was the same. The reason behind the difference in the leaching of cadmium between two samples arises from the different surface morphologies (Fig. 2). More specifically, in the CdS-alginate nanocomposite the Cd2+ ions are chemically bound to the α-L-guluronic monomers and form spherical structures of the biopolymer in the initial stages of the ionic cross-linking. On the other hand, in the CdS:Mn-alginate nanocomposite, due to competitive ion exchange with Mn2+ part of the Cd2+ ions might remain in the vicinity of the biopolymer surface. This assumption can be supported by noting that the majority of Cd2+ was immediately released, since the additional hour of leaching from the CdS:Mn (4 mol%)-alginate nanocomposite resulted in an increase of cadmium concentration by less than 5%.
| Time | CdS-alginate | CdS:Mn (4 mol%)-alginate |
|---|---|---|
| 1 h | 1.4 ppm | 8.5 ppm |
| 2 h | 1.5 ppm | 8.9 ppm |
The results of the toxicity of CdS-alginate and CdS:Mn (4 mol%)-alginate nanocomposites versus human fetal lung fibroblasts MRC-5 cells obtained using MTT assay are presented in Fig. 7. The tests were performed using eluates obtained after 1 h, 2 h, and 24 h of elution of the nanocomposite dispersions prepared in high concentrations (0.5 wt/vol% and 1.0 wt/vol%). It can be seen that the metabolic activity of MRC-5 cell line was not significantly affected by a 24 h of treatment with the eluates of the nanocomposites obtained after 1 h of elution. The reduction in viable cells to 87%, was measured for the eluate of the 1.0 wt/vol% CdS:Mn (4 mol%)-alginate DMEM dispersion, while 92% of the cells survived in the case of the dispersion of CdS-alginate of the same concentration. As it was shown by AAS, the higher toxicity of the material containing Mn-doped CdS nanoparticles is a consequence of a larger amount of Cd that was released from this nanocomposite.
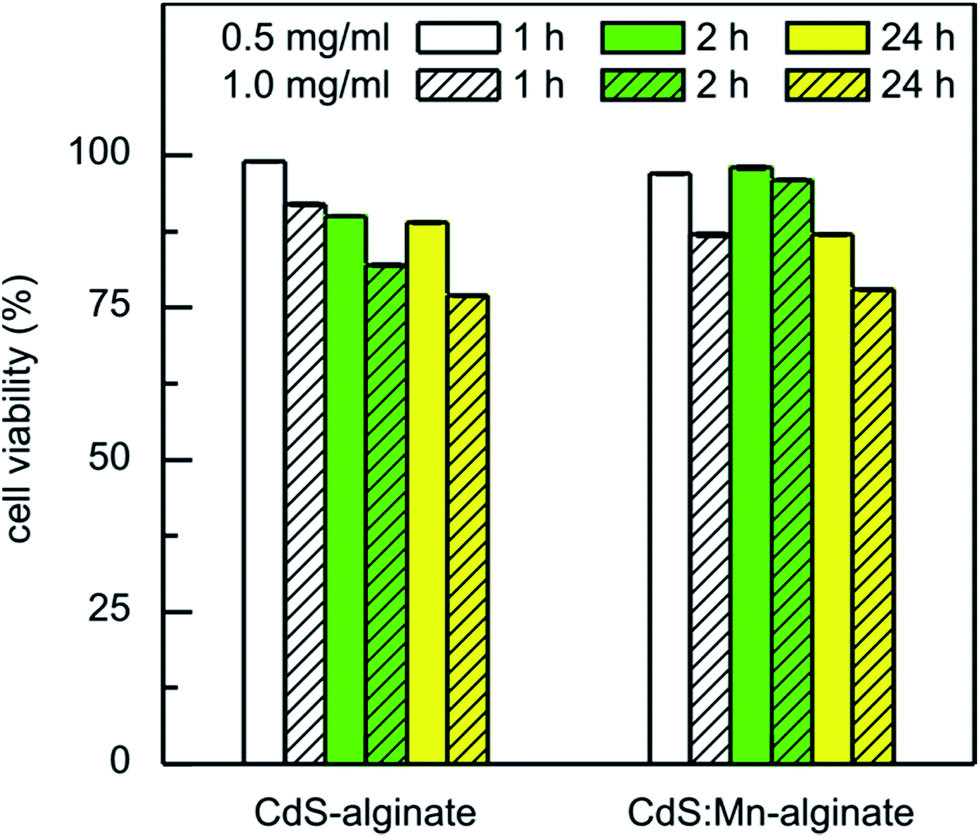 | ||
| Fig. 7 Influence of CdS-alginate and CdS:Mn (4 mol%)-alginate nanocomposites on the viability of human fetal lung fibroblasts MRC-5 cells determined by MTT assay. The cells were exposed for 24 h to the eluates of CdS-alginate and CdS:Mn (4 mol%)-alginate nanocomposite DMEM dispersion (concentrations 0.5 wt/vol% and 1.0 wt/vol%) obtained after 1 h, 2 h, and 24 h of elution. | ||
With an increase in the elution time to 2 h and 24 h, the mortality of the cells generally increased. However, the eluates of the CdS:Mn (4 mol%)-alginate dispersion obtained after 2 h of elution showed lower cytotoxicity (cell viability was 98% and 96% for the 0.5 and 1.0 wt/vol% concentration, respectively), probably due to a depletion of cadmium from the surface regions of the nanocomposite. Therefore, since cadmium induces acute cytotoxicity, upon depletion of the heavy metal from the surface of the CdS:Mn (4 mol%)-alginate nanocomposite the MRC-5 cells recuperate and recover their normal metabolic activity. The lowest percentage of cell survival for all investigated cases was 77%, measured for the eluates of the 1.0 wt/vol% CdS-alginate dispersion after 24 h of elution time.
Concentration dependent cytotoxicity of bare CdS nanoparticles, 5–7 nm in size, determined by MTT assay was reported previously.56 The study showed that the metabolic activity of CHL cells reduced from 84%, upon exposure to 2.5 ppm of the particles, to about 20% when the cells were treated with CdS quantum dots of concentrations ranging from 20 to 80 ppm. In our case, the nominal concentration of the nanoparticles in the nanocomposite was 10 wt% that leads to a total CdS concentration in the 1.0 wt/vol% nanocomposite dispersion of approximately 100 ppm. However, as a consequence of the chemical structure of the biopolymer and chemical bonding between Cd2+ and α-L-guluronic monomers, the nanoparticle diffusion from the matrix into the environment is inhibited and the amount of released cadmium is reduced significantly (Table 1). Consequently, the MRC-5 cells were exposed to CdS in a much lesser concentrations, which resulted in the low cytotoxicity of CdS-alginate and CdS:Mn-alginate nanocomposites.
4. Conclusions
In this study, we employed biocompatible Na-alginate biopolymer as a template for an in situ chemical synthesis of manganese-doped cadmium sulfide nanocrystals in aqueous solution. The results of the structural investigations showed that the dopant was distributed in octahedral sites near the surface of nanocrystal and suggested a distortion of the crystal lattice surrounding Mn2+ ions. This preferential positioning in the sites of lower symmetry resulted in the photoluminescence of the nanocomposites between 650 nm and 750 nm. Because of the chemical bonding between Cd2+ ions and alginate, the cytotoxicity of the prepared nanocomposites, was low in comparison to the data reported for bare CdS nanoparticles.Few additional remarks are worth to mention regarding the study on CdS:Mn-alginate nanocomposites. First, the presented synthesis results in high concentration of the nanoparticles with respect to the polymer and can be easily scaled to produce larger amounts of the nanocomposite. Also, the general procedure can be used for the preparation of alginate nanocomposites with a variety of transition metal doped II–VI semiconductor nanoparticles (ZnS:Mn, CdS:Cu, etc.). Furthermore, by using water soluble precursors and the biopolymer in the synthesis, we have avoided the use of toxic capping agents and organic solvents that are typically employed for the preparation of semiconductor nanoparticles. Finally, low cost red-emitting CdS:Mn-alginate nanocomposites of low toxicity could be advantageous for future fluorescence bioimaging studies.
Conflicts of interest
There are no conflicts to declare.Acknowledgements
This research was financially supported by the Ministerio de Ciencia e Innovación (grant MAT2010-16815); Ministerio de Economía y Competitividad (grant MAT2014-59116-C2); Fondos de Investigación de Fco. Javier Gonzalez Benito, política de reinversión de costes generales, Universidad Carlos III de Madrid (Ref.: 2012/00130/004); Acción Estratégica en Materiales Compuestos Poliméricos e Interfases, Universidad Carlos III de Madrid (Ref.: 2011/00287/002), and TECHNOFUSION(II)-CM (S2013/MAE-2745) Spain. M. K. acknowledges University Carlos III Madrid for the financial support via ‘Ayudas al studio de Master Universitario’. D. K. B. would like to thank the University Carlos III Madrid for the ‘Estancias postdoctorales fellowship’. TEM characterization was made at LABMET, associated to the Red de Laboratorios de la Comunidad de Madrid. D. K. B and D. M acknowledge the Ministry of Education and Science of the Republic of Serbia for the financial support (Project No. 172056 and 45020).References
- A. C. Balazs, T. Emrick and T. P. Russell, Science, 2006, 314, 1107 CrossRef CAS PubMed.
- P. K. Sudeep and T. Emrick, Polym. Rev., 2007, 47, 155 CrossRef CAS.
- W. U. Huynh, J. J. Dittmer and A. P. Alivisatos, Science, 2002, 295, 2425 CrossRef CAS PubMed.
- D. Y. Godovsky, Nanocomposites, 2000, 153, 163 CAS.
- J. M. Klostranec and W. C. W. Chan, Adv. Mater., 2006, 18, 1953 CrossRef CAS.
- I. Sondi, A. Siiman and E. Matijevic, J. Colloid Interface Sci., 2004, 275, 503 CrossRef CAS PubMed.
- Q. L. Nie, W. B. Tan and Y. Zhang, Nanotechnology, 2006, 17, 140 CrossRef CAS.
- T. Radhakrishnan, M. K. Georges, P. S. Nair, A. S. Luyt and V. Djokovic, J. Nanosci. Nanotechnol., 2007, 7, 986 CrossRef CAS PubMed.
- P. Rodriguez, N. Munoz-Aguirre, E. S. M. Martinez, G. G. de la Cruz, S. A. Tomas and O. Z. Angel, J. Cryst. Growth, 2008, 310, 160 CrossRef CAS.
- N. Vigneshwaran, S. Kumar, A. A. Kathe, P. V. Varadarajan and V. Prasad, Nanotechnology, 2006, 17, 5087 CrossRef CAS.
- D. K. Božanić, V. Djoković, J. Blanuša, P. S. Nair, M. K. Georges and T. Radhakrishnan, Eur. Phys. J. E: Soft Matter Biol. Phys., 2007, 22, 51 CrossRef PubMed.
- D. K. Božanić, V. Djoković, N. Bibić, P. S. Nair, M. K. Georges and T. Radhakrishnan, Carbohydr. Res., 2009, 344, 2383 CrossRef PubMed.
- V. Djoković, R. Krsmanović, D. K. Božanić, M. McPherson, G. Van Tendeloo, P. S. Nair, M. K. Georges and T. Radhakrishnan, Colloids Surf., B, 2009, 73, 30 CrossRef PubMed.
- W. T. Wu, M. Aiello, T. Zhou, A. Berliner, P. Banerjee and S. Q. Zhou, Biomaterials, 2010, 31, 3023 CrossRef CAS PubMed.
- S. K. Chanda, L. Hirst, E. G. V. Percival and A. G. Ross, J. Chem. Soc., 1952, 1933 Search PubMed.
- H. H. Zheng, Carbohydr. Res., 1997, 302, 97 CrossRef CAS.
- C. H. Wang, Y. S. Hsu and C. A. Peng, Biosens. Bioelectron., 2008, 24, 1012 CrossRef CAS PubMed.
- P. Sundarrajan, P. Eswaran, A. Marimuthu, L. B. Subhadra and P. Kannaiyan, Bull. Korean Chem. Soc., 2012, 33, 3218 CrossRef CAS.
- R. Brayner, M. J. Vaulay, F. Fievet and T. Coradin, Chem. Mater., 2007, 19, 1190 CrossRef CAS.
- H.-L. Ma, X.-R. Qi, Y. Maitani and T. Nagai, Int. J. Pharm., 2007, 333, 177 CrossRef CAS PubMed.
- L. V. Trandafilovic, D. K. Bozanic, S. Dimitrijevic-Brankovic, A. S. Luyt and V. Djokovic, Carbohydr. Polym., 2012, 88, 263 CrossRef CAS.
- L. V. Trandafilović, R. Krsmanović Whiffen, S. Dimitrijević-Branković, M. Stoiljković, A. S. Luyt and V. Djoković, Chem. Eng. J., 2014, 253, 341 CrossRef.
- A. M. Laera, V. Resta, E. Piscopiello, V. Miceli, M. Schioppa, A. Scalone, G. F. Di Benedetto and L. Tapfer, Nanoscale Res. Lett., 2013, 8, 382 CrossRef PubMed.
- J. Wang and M. Isshiki, Springer Handbook of Electronic and Photonic Materials, 2007 Search PubMed.
- W. S. Chae, J. H. Ko, I. W. Hwang and Y. R. Kim, Chem. Phys. Lett., 2000, 365, 49 CrossRef.
- M. Tanaka, J. Lumin., 2002, 100, 163 CrossRef CAS.
- S. M. Liu, F. Q. Liu, H. Q. Guo, Z. H. Zhang and Z. G. Wang, Solid State Commun., 2000, 115, 615 CrossRef CAS.
- A. Nag, S. Sapra, C. Nagamani, A. Sharma, N. Pradhan, S. V. Bhat and D. D. Sarma, Chem. Mater., 2007, 19, 3252 CrossRef CAS.
- P. Wu and X. P. Yan, Chem. Soc. Rev., 2013, 42, 5489 RSC.
- W. Chen, R. Sammynaiken, Y. N. Huang, J. O. Malm, R. Wallenberg, J. O. Bovin, V. Zwiller and N. A. Kotov, J. Appl. Phys., 2001, 89, 1120 CrossRef CAS.
- F. J. Brieler, M. Froba, L. M. Chen, P. J. Klar, W. Heimbrodt, H. A. K. von Nidda and A. Loidl, Chem.–Eur. J., 2002, 8, 185 CrossRef CAS.
- R. M. Krsmanović Whiffen, D. J. Jovanovic, Z. Antić, B. Bartova, D. Milivojevic, M. D. Dramicanin and M. G. Brik, J. Lumin., 2014, 146, 133 CrossRef.
- L. L. Wang, L. L. Tan, T. Hou and J. S. Shi, J. Lumin., 2013, 134, 319 CrossRef CAS.
- A. Nag, R. Cherian, P. Mahadevan, A. V. Gopal, A. Hazarika, A. Mohan, A. S. Vengurlekar and D. D. Sarma, J. Phys. Chem. C, 2010, 114, 18323 CAS.
- A. Hazarika, A. Layek, S. De, A. Nag, S. Debnath, P. Mahadevan, A. Chowdhury and D. D. Sarma, Phys. Rev. Lett., 2013, 110, 5 CrossRef PubMed.
- R. Beaulac, P. I. Archer and D. R. Gamelin, J. Solid State Chem., 2008, 181, 1582 CrossRef CAS.
- Y. R. Huang, S. He, W. P. Cao, K. Y. Cai and X. J. Liang, Nanoscale, 2012, 4, 6135 RSC.
- V. J. Pansare, S. Hejazi, W. J. Faenza and R. K. Prudhomme, Chem. Mater., 2012, 24, 812 CrossRef CAS PubMed.
- J. Schindelin, I. Arganda-Carreras, E. Frise, V. Kaynig, M. Longair, T. Pietzsch, S. Preibisch, C. Rueden, S. Saalfeld, B. Schmid, J. Y. Tinevez, D. J. White, V. Hartenstein, K. Eliceiri, P. Tomancak and A. Cardona, Nat. Methods, 2012, 9, 676 CrossRef CAS PubMed.
- P. Kubelka and F. Munk, J. Tech. Phys., 1931, 12, 593 Search PubMed.
- J. Tauc, Mater. Res. Bull., 1968, 3, 37 CrossRef CAS.
- C. Y. Yeh, Z. W. Lu, S. Froyen and A. Zunger, Phys. Rev. B, 1992, 46, 10086 CrossRef CAS.
- D. Rodic, V. Spasojevic, A. Bajorek and P. Onnerud, J. Magn. Magn. Mater., 1996, 152, 159 CrossRef CAS.
- W. Vogel, J. Urban, M. Kundu and S. K. Kulkarni, Langmuir, 1997, 13, 827 CrossRef CAS.
- A. Haug, Acta Chem. Scand., 1961, 15, 1794 CrossRef CAS.
- T. A. Kennedy, E. R. Glaser, P. B. Klein and R. N. Bhargrava, Phys. Rev. B, 1995, 52, R14356 CrossRef CAS.
- E. Simanek and K. A. Müller, J. Phys. Chem. Solids, 1970, 31, 1027 CrossRef CAS.
- G. Counio, S. Esnouf, T. Gacoin and J. P. Boilot, J. Phys. Chem., 1996, 100, 20021 CrossRef CAS.
- F. V. Mikulec, M. Kuno, M. Bennati, D. A. Hall, R. G. Griffin and M. G. Bawendi, J. Am. Chem. Soc., 2000, 122, 2532 CrossRef CAS.
- H. W. Wijn and R. F. van Balderen, J. Chem. Phys., 1967, 46, 1381 CrossRef.
- W. Chen, G. H. Li, J. O. Malm, Y. N. Huang, R. Wallenberg, H. X. Han, Z. P. Wang and J. O. Bovin, J. Lumin., 2000, 91, 139 CrossRef CAS.
- V. Kumar, A. Kumari, P. Guleria and S. K. Yadav, Rev. Environ. Contam. Toxicol., 2011, 215, 39 CAS.
- A. Navas-Acien, E. Selvin, A. R. Sharrett, E. Calderon-Aranda, E. Silbergeld and E. Guallar, Circulation, 2004, 109, 3196 CrossRef CAS PubMed.
- B. L'Azou, I. Passagne, S. Mounicou, M. Treguer-Delapierre, I. Puljalte, J. Szpunar, R. Lobinski and C. Ohayon-Courtes, Toxicol. Res., 2014, 3, 32 RSC.
- J. Crossgrove and W. Zheng, NMR Biomed., 2004, 17, 544 CrossRef CAS PubMed.
- K. G. Li, J. T. Chen, S. S. Bai, X. Wen, S. Y. Song, Q. Yu, J. Li and Y. Q. Wang, Toxicol. in Vitro, 2009, 23, 1007 CrossRef CAS PubMed.
Footnote |
| † Electronic supplementary information (ESI) available. See DOI: 10.1039/c7ra11011a |
| This journal is © The Royal Society of Chemistry 2017 |