 Open Access Article
Molecular modeling studies of quinazolinone derivatives as novel PI3Kδ selective inhibitors†
Xiu Xiu Peng,
Kai Rui Feng and
Yu Jie Ren *
*
School of Chemical and Environmental Engineering, Shanghai Institute of Technology, Shanghai 201418, China. E-mail: clab@sit.edu.cn
First published on 15th December 2017
Abstract
The forced expression of phosphoinositide 3-kinase δ (PI3Kδ) in B cells was found to be oncogenic, rendering PI3Kδ an attractive drug target for chronic lymphocytic leukaemia. This study aimed to systemically explore the interaction mechanism of novel quinazolinone scaffold-based derivatives as PI3Kδ inhibitors using 3D-QSAR, molecular docking, pharmacophore model and molecular dynamics (MD) simulations. The 3D-QSAR models CoMFA, CoMSIA and Topomer CoMFA were established to discover critical structural factors affecting PI3Kδ inhibitory activity. The models showed suitable reliabilities (q2 0.741, 0.712 and 0.711) and predictive abilities (rpred2 0.851, 0.738 and 0.828, respectively). Contour maps indicated that the bioactivity of PI3Kδ inhibitor was affected most by electrostatic and hydrophobic fields. The Surflex-Dock and pharmacophore model result showed that enhancing the H-bond interaction of the key substituents around the 2- and 4-positions of pyrimidine with Glu826, Val828 and Asp911, as well as the electrostatic interactions of substituents around the 3-position of benzene with Ser831, Asp832 and Asn836, significantly affected the improvement in the activity and stability of the inhibitor. Based on these results, 10 novel PI3Kδ inhibitors with higher predicted activity and binding affinity were designed by introducing the heterocycles pyrrolopyridine or purine. 10 ns MD simulations further study the stable docking conformation of designed compounds, which showed strong hydrogen bond interactions with key residues Ser831 and Asp832 in a propeller-like fashion. These results provided strong guidance for the discovery and optimization of novel potent PI3Kδ selective inhibitors.
Introduction
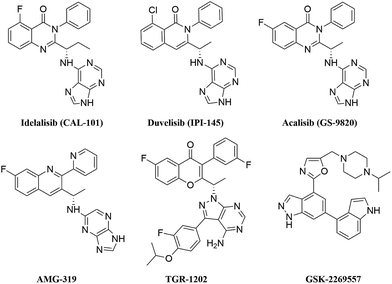
Chronic lymphocytic leukaemia (CLL), which is a common B cell chronic lymphoproliferative disorder, has a slow progress and long disease course. Patients with CLL are vulnerable to complications of infections and sepsis; mortality and morbidity are increasing each year and have aroused great attention in the field of haematology.1 Traditional chemotherapeutic drugs, which include fludarabine,2 chlorambucil3 and cyclophosphamide,4 present limited efficacy and cause severe side effects, such as anaemia and bone marrow suppression. Recently, the emerging immunotherapy of ofatumumab5 and rituximab6 has improved the clinical efficacy and survival rates of patients with CLL; however, elderly and frail patients are unable to tolerate intensive chemoimmunotherapy.7 To date, no drug can radically cure CLL; hence, exploring and optimizing novel therapeutic agents for CLL is imperative.In recent years, researchers found that the B cell receptor (BCR) signalling pathway is crucial for the evolution and progression of CLL. PI3Kδ regulates B cell maturation and function by relaying signals from the BCR to downstream cytokines and chemokines. PI3Kδ is frequently over-expressed and is hyperactive in lymphoma cells; thus, PI3Kδ has been an appealing target for B cell leukaemia disease.8 Idelalisib as the first oral selective PI3Kδ inhibitor is approved by the FDA for the treatment of CLL, which greatly promoted the development of the PI3Kδ inhibitor. However, idelalisib is only suitable for patients with relapsed CLL and has severe hepatotoxicity.9 Although several PI3Kδ inhibitors, such as AMG-319,10 GS-9820,11 TGR-1202,12 IPI-145 (ref. 13) and GSK-2269557 (ref. 14) (Fig. 1), have already entered clinical trials in haematological malignancies or inflammatory diseases, these inhibitors have some disadvantages. For example, AMG-319, GS-9820 and TGR-1202 have relatively low activity compared with idelalisib and can cause inevitable side effects of diarrhea and neutropenia. GSK-2269557 has a higher activity and the selectivity of PI3Kδ over other isoforms is more than 1000; however, it causes adverse reactions of headaches and arthralgia. Therefore, finding novel potent PI3Kδ selective inhibitors with strong applicability and fewer side effects is very significant.15 Gilead Sciences further studied quinazolinone analogues, and Patel et al. claimed a series of new quinazolinone derivatives bearing a 2,4,6-triaminopyrimidine motif.16 These compounds showed better PI3Kδ inhibitory potency and improved selectivity over other PI3K isoforms compared with idelalisib. Moreover, the compounds have enhanced metabolic stability by mitigating aldehyde oxidase-mediated metabolism and shown excellent pharmacokinetic properties suitable for drug development. The pharmacokinetic and activity test in vivo of several compounds have been done in rat models and showed good results; hence, the study of such quinazolinone derivatives can promote the development of novel PI3Kδ inhibitors. However, its structure–activity relationship and the interaction mechanism have not been systematically studied by theoretical molecular modeling method. Therefore, the structure and activity of novel quinazolinone PI3Kδ inhibitors should be systematically studied by computer-aided drug design method.
The QSAR, as a mathematical technology linking chemical structure and biological activity in a quantitative manner, have been widely applied to assist the design of new drug candidates in the pharmaceutical sciences.17 Recently, the approach has speed up the lead optimization process by studying three dimensional features of chemicals.18 3D-QSAR analysis play important role in the development of targeted inhibitors for the treatment of cancer, HIV and cardio-cerebrovascular diseases.19–21 This technology, which mainly includes CoMFA,22 CoMSIA23 and Topomer CoMFA,24 can provide beneficial information on structural modifications for designing the lead compounds with desired inhibitory activity and be used to predict the activity of newly designed inhibitors. In this study, a series of quinazolinone scaffold-based derivatives as novel PI3Kδ selective inhibitors were selected to construct 3D-QSAR models, which revealed the relationship between structural characteristics and inhibitory activity. Molecular docking and pharmacophore model were used to analyze the influence of pharmacophore groups on the activity of the compounds and investigate the binding patterns of ligands with PI3Kδ receptor proteins. Molecular dynamics simulations were applied to analyse the dynamics behavior of the ligand, and obtain more detailed ligand–protein interaction information.25–28 The stepwise description of the molecular modeling was shown in Fig. S1 (see ESI†). The above systematic research is important for obtaining novel candidate compounds as PI3Kδ inhibitors and for avoiding the blindness of drug design and ensuring more efficient drug synthesis.
Computational details
Data sets
The total set of PI3Kδ selective inhibitors used for molecular modelling study was reported by Patel et al. The structures and bioactivities of the quinazolinone derivatives were indicated in Table 1, and the IC50 values were converted into pIC50 values (−log![[thin space (1/6-em)]](https://www.rsc.org/images/entities/char_2009.gif) IC50). It was acceptable that the range of pIC50 values between the most active and the least active molecule is 4.23 log units, and the distribution of pIC50 values for the complete set was shown in Fig. S2.† All the experimental data are randomly partitioned into two subsets: a training set (30 molecules) for QSAR model generation, and a test set consisting of additional 7 molecules for model evaluation. The compounds of test set were selected in accordance with the distribution of bioactivity data and structural diversity, which is a vital factor to determine the reliability of the 3D-QSAR model. The CoMFA, CoMSIA and Topomer CoMFA models were constructed based on the same training set and test set. Furthermore, the quinazolinone derivatives as novel PI3Kδ selective inhibitors have the same structure skeleton with idelalisib, so the co-crystal structure of PI3Kδ protein with idelalisib was downloaded from the Protein Data Bank (PDB ID: 4XE0) for the molecular docking study.29
IC50). It was acceptable that the range of pIC50 values between the most active and the least active molecule is 4.23 log units, and the distribution of pIC50 values for the complete set was shown in Fig. S2.† All the experimental data are randomly partitioned into two subsets: a training set (30 molecules) for QSAR model generation, and a test set consisting of additional 7 molecules for model evaluation. The compounds of test set were selected in accordance with the distribution of bioactivity data and structural diversity, which is a vital factor to determine the reliability of the 3D-QSAR model. The CoMFA, CoMSIA and Topomer CoMFA models were constructed based on the same training set and test set. Furthermore, the quinazolinone derivatives as novel PI3Kδ selective inhibitors have the same structure skeleton with idelalisib, so the co-crystal structure of PI3Kδ protein with idelalisib was downloaded from the Protein Data Bank (PDB ID: 4XE0) for the molecular docking study.29
| No. | Structure | Actual pIC50 | Predicted pIC50 | CoMFA | CoMSIA | |||
|---|---|---|---|---|---|---|---|---|
| R1 | R2 | R3 | CoMFA | CoMSIA | Residual | Residual | ||
| a Test set molecules. | ||||||||
| 01 |  |
H | 5-Cl | 7.004 | 7.002 | 6.851 | −0.002 | −0.154 |
| 02 |  |
H | 5-Cl | 5.770 | 5.780 | 5.828 | 0.010 | 0.058 |
| 03 |  |
H | 5-Cl | 8.097 | 8.247 | 8.087 | 0.150 | −0.010 |
| 04 |  |
H | 5-Cl | 9.398 | 9.145 | 9.343 | −0.253 | −0.055 |
| 05 |  |
H | 5-Cl | 7.523 | 7.517 | 7.522 | −0.007 | −0.001 |
| 06a |  |
H | 5-Cl | 8.602 | 8.926 | 8.555 | 0.324 | −0.047 |
| 07 | –CONH2 | H | 5-Cl | 7.959 | 7.846 | 7.921 | −0.113 | −0.038 |
| 08 | –CF3 | H | 5-Cl | 8.745 | 8.674 | 8.726 | −0.071 | −0.019 |
| 09 | –CH3 | H | 5-Cl | 7.854 | 7.873 | 7.916 | 0.019 | 0.062 |
| 10a | –OCH3 | H | 5-Cl | 7.409 | 7.395 | 7.257 | −0.014 | −0.152 |
| 11 |  |
H | 5-Cl | 9.523 | 9.438 | 9.547 | −0.085 | 0.024 |
| 12 |  |
H | 5-Cl | 9.301 | 9.345 | 9.304 | 0.044 | 0.003 |
| 13 |  |
H | 5-Cl | 9.398 | 9.457 | 9.458 | 0.059 | 0.060 |
| 14 |  |
H | 5-Cl | 8.921 | 8.895 | 8.930 | −0.026 | 0.009 |
| 15 |  |
H | 5-Cl | 9.523 | 9.536 | 9.526 | 0.013 | 0.003 |
| 16 |  |
H | 5-Cl | 10.00 | 9.817 | 9.652 | −0.183 | −0.348 |
| 17 |  |
H | 5-Cl | 8.367 | 8.472 | 8.408 | 0.105 | 0.041 |
| 18 |  |
H | 5-Cl | 9.046 | 9.127 | 9.062 | 0.081 | 0.016 |
| 19 |  |
H | 5-Cl | 9.000 | 9.111 | 9.049 | 0.111 | 0.049 |
| 20a |  |
H | 5-Cl | 9.886 | 9.364 | 9.041 | −0.522 | −0.845 |
| 21 | –CN | 4-F | 5-Cl | 8.699 | 8.936 | 8.836 | 0.237 | 0.137 |
| 22a | –CN | 3-F | 5-Cl | 9.824 | 9.452 | 9.309 | −0.372 | −0.515 |
| 23 | –CN | 3-Cl | 5-Cl | 9.347 | 9.323 | 9.475 | −0.024 | 0.128 |
| 24 | –CN | 3-CN | 5-Cl | 8.721 | 8.703 | 8.765 | −0.018 | 0.044 |
| 25 | –CN | 3-OCH3 | 5-Cl | 9.046 | 9.026 | 9.005 | −0.020 | −0.041 |
| 26 | –CN | 3-CF3 | 5-Cl | 8.444 | 8.319 | 8.407 | −0.125 | −0.037 |
| 27 | –CN | 3-CH2CHF2 | 5-Cl | 8.796 | 8.761 | 8.799 | −0.035 | 0.003 |
| 28 | –CN | 3-CHF2 | 5-Cl | 9.268 | 9.485 | 9.363 | 0.217 | 0.095 |
| 29a | –CN | 3,5-2CN | 5-Cl | 6.824 | 6.158 | 7.620 | −0.666 | 0.796 |
| 30 | –CN | 3-Cl | 5-Cl | 8.824 | 8.747 | 8.830 | −0.077 | 0.006 |
| 5-CHF2 | ||||||||
| 31a | –CN | 3,5-2F | 5-Cl | 9.328 | 8.984 | 8.784 | −0.345 | −0.544 |
| 32 | –CN | 3,5-2F | 5-Cl | 8.538 | 8.493 | 8.490 | −0.045 | −0.048 |
| 6-F | ||||||||
| 33a | –CN | 3,5-2F | H | 7.824 | 8.323 | 8.452 | 0.499 | 0.628 |
| 34 | –CN | 3,5-2F | 5-F | 8.658 | 8.665 | 8.613 | 0.007 | −0.045 |
| 35 | –CN | 3,5-2F | 6-F | 8.319 | 8.352 | 8.353 | 0.033 | 0.034 |
| 36 | –CN | 3,5-2F | 8-F | 8.456 | 8.469 | 8.479 | 0.013 | 0.023 |
| 37 | –CN | 3,5-2F | 8-CN | 8.229 | 8.212 | 8.230 | −0.017 | 0.001 |
Energy minimization and molecular alignment
All three dimensional structures of quinazolinone derivatives as novel PI3Kδ selective inhibitors were sketched using Sybyl-X 2.0 molecular modeling package (Tripos Inc. St. Louis, USA). All the studied compounds have the same quinazolinone core scaffold with idelalisib, which would adopt a similar conformation to bind with PI3Kδ protein. Thus, all compounds were constructed based on the binding conformation of idelalisib. The optimizations of all structures were conducted by using the Tripos force field and Gasteiger–Hückel charge. Additionally, the energy minimizations of compounds were ended when the 10![[thin space (1/6-em)]](https://www.rsc.org/images/entities/char_2009.gif) 000 step iterations were accomplished or when the energy gradient convergence criterion of 0.005 kcal (mol−1 Å−1) was achieved.30 The minimized structures were utilized as the initial conformation for constructing 3D-QSAR models and molecular docking. Since the predictive capability and reliability of the built models are directly dependent on superimposition of molecules, the selection of template molecule is one of the important steps. Herein, CoMFA, CoMSIA and Topomer CoMFA models were constructed by ligand-based superimposition. All the compounds were superimposed to the compound 16 with highest inhibitory activity. In order to describe the structure of the molecule clearly, as shown in Fig. 2A, the whole structure was divided into region A, region B and region C. The common structure that used to align all compounds was shown in red, and the alignment results were shown in Fig. 2B.
000 step iterations were accomplished or when the energy gradient convergence criterion of 0.005 kcal (mol−1 Å−1) was achieved.30 The minimized structures were utilized as the initial conformation for constructing 3D-QSAR models and molecular docking. Since the predictive capability and reliability of the built models are directly dependent on superimposition of molecules, the selection of template molecule is one of the important steps. Herein, CoMFA, CoMSIA and Topomer CoMFA models were constructed by ligand-based superimposition. All the compounds were superimposed to the compound 16 with highest inhibitory activity. In order to describe the structure of the molecule clearly, as shown in Fig. 2A, the whole structure was divided into region A, region B and region C. The common structure that used to align all compounds was shown in red, and the alignment results were shown in Fig. 2B.
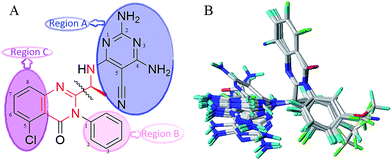 | ||
| Fig. 2 Structure of template compound 16, the common substructure (red) used in alignment (A), and the alignment of training set (B). | ||
Generation of the QSAR model
In this study, the 3D-QSAR models were constructed by the ligand-based alignment rule, which correlated inhibitory activity with interaction field descriptors calculated based on molecule superimposition. To derive the CoMFA, Topomer CoMFA and CoMSIA descriptors of different force fields, the aligned molecules were placed in a regular 3D grid box with a grid spacing of 2.0 Å. The CoMFA and Topomer CoMFA models calculated steric and electrostatic fields, utilizing a sp3 carbon atom with a van der Waals radius of 1.52 Å and charge of +1.0.31 As for the CoMSIA method, steric, electrostatic, hydrophobic, hydrogen bond donor, and hydrogen bond acceptor fields were calculated by utilizing a probe atom with charge of +1.0, hydrophobicity and hydrogen bond properties of +1.0 at each lattice. The CoMFA, Topomer CoMFA, and CoMSIA descriptors were used as independent variables while pIC50 values served as target variables.Topomer CoMFA automates the creation of models, and its alignment is extremely rapid and objective. Identifying the R-groups for the molecules in training set was the crucial step for establishing Topomer CoMFA model.32 In this study, the template molecule 16 was split into two fragments by cutting one single bond as shown in Fig. 2A, and all the other structures were divided into R1 and R2 fragments in the same way. The 3D-QSAR models were graphically represented by field contour maps, which were able to identify functional groups and physicochemical properties affecting biological activity and binding affinity.
Partial least squares analysis and validation of the QSAR models
The partial least squares (PLS) approach was employed to linearly correlate the CoMFA, Topomer CoMFA and CoMSIA descriptors to the biological activity data. In the PLS analysis, the LOO cross-validation procedure was conducted to determine the cross-validated correlation coefficient (q2) and the optimum number of components (ONC). The final model was evaluated by the non-cross-validation correlation coefficient (r2), the standard error of estimate (SEE), and the F ratio value. In general, the 3D-QSAR models were considered reliable and acceptable if the q2 values were greater than 0.50 and the r2 values were greater than 0.9.33 Additionally, the test set was used to evaluate the external validation capacity of the models. The external predict activity of QSAR models is commonly described by various validation metrics, R2 based metrics and purely error based metrics like mean absolute error (MAE). Herein, the predictive correlation coefficient expressed as rpred2 was applied, which was calculated using the following equation:
 | (1) |
Moreover, Golbraikh and Tropsha put forward another four criteria to evaluate the robustness and the predictive abilities of the established models.34 The 3D-QSAR models can be regarded as acceptable if they satisfy the following conditions:
| R2 > 0.6; 0.85 < k < 1.15; Rm2 >0.5; [(R2 − R02)/R2] < 0.1. |
The R value was calculated by the following formula:
 | (2) |
The slope k value of the regression line through the origin must close to 1, and the k value was calculated by the following formula:
 | (3) |
Rm2 value was the n-CV correlation coefficient obtained from the PLS process and defined as following equation, which was provided by Roy et al.:35
 | (4) |
R02 value was calculated as following equation:
 | (5) |
MAE value was calculated as following equation:36
 | (6) |
In the above equations, Ypred(test) and Ytest represented the predicted and experimental pIC50 value for each compound in the test set. Ȳtraining and Ȳtest were the average pIC50 values for each compound in the training set and test set, respectively.
In addition, the analysis of prediction errors plays a significant role in understanding systematic errors of QSAR models and determining the model acceptability. To check the predictions error of 3D-QSAR models, a series of parameters such as the absolute of average error (AE), average absolute error (AAE), number of positive and negative errors (NPE and NNE), mean positive error (MPE) and mean negative error (MNE) were calculated.37 Additionally, the Applicability Domain of CoMSIA model, which represents the chemical space from which a model is derived and where a prediction is considered to be reliable, was defined by the leverage approach.
Molecular docking
In drug designing process, molecular docking technique is usually used to investigate the most appropriate conformation and interactions of hit compound at the active site of protein. To reveal the binding mode of quinazolinone derivatives within the binding pocket of PI3Kδ protein and to further understand their structure–activity relationship, Surflex-Dock algorithm was used for the molecular docking study. In the course of protein preparation, all water molecules and its ligand were removed from the original 4XE0 protein complex, and polar hydrogen atoms and the essential charge were added to protein atoms. Finally, to identify the binding pocket, three types of probes (CH4, N–H, C![[double bond, length as m-dash]](https://www.rsc.org/images/entities/char_e001.gif) O) that represent potential hydrogen bonds and favorable hydrophobic interactions with protein atoms were used to construct the protomol. Each probe serves as a potential alignment point for atoms in a ligand, and is scored to represent that probe's affinity for the protein. Probes with high affinity are merged into a pocket, the protomol.38 In this study, the ligand-based docking mode was adopted to generate the protomol. In docking process, all compounds are regarded to be the flexible whereas PI3Kδ protein is considered to be rigid. Subsequently, all the compounds were docked into the active pocket with other defaulted parameters.39 To predict the binding affinity of the ligand to the target protein, the default scoring function was used. Finally, 10 conformations were obtained for each compound, and the conformation with highest docking score and similar orientation to the original ligand was chosen for binding mode and dynamics simulation study.
O) that represent potential hydrogen bonds and favorable hydrophobic interactions with protein atoms were used to construct the protomol. Each probe serves as a potential alignment point for atoms in a ligand, and is scored to represent that probe's affinity for the protein. Probes with high affinity are merged into a pocket, the protomol.38 In this study, the ligand-based docking mode was adopted to generate the protomol. In docking process, all compounds are regarded to be the flexible whereas PI3Kδ protein is considered to be rigid. Subsequently, all the compounds were docked into the active pocket with other defaulted parameters.39 To predict the binding affinity of the ligand to the target protein, the default scoring function was used. Finally, 10 conformations were obtained for each compound, and the conformation with highest docking score and similar orientation to the original ligand was chosen for binding mode and dynamics simulation study.
Pharmacophore model
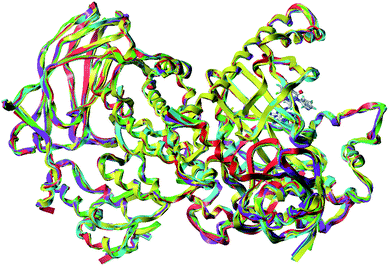
3D pharmacophore models were created using the Genetic Algorithm with Linear Assignment of Hypermolecular Alignment of Database (GALAHAD), which was the most widely used method for identification of essential structural features required for biological activity.40 The main purpose of pharmacophore generation is to establish a model which can be used to analyse the structure–activity relationships of the active compounds. The detailed statistical data of five reported PI3Kδ ligand–protein complexes used to generate the pharmacophore model was recorded in Table S1,† which were obtained from the protein structure database (PDB ID: 4XE0, 2X38,41 5I4U,16 5T8I and 5T7F42). The superimposition results of five PI3Kδ proteins with crystal structure of 4XE0 as a template were shown in Fig. 3. The RMSD values of each two composite proteins were all less than 1.5 Å. The pharmacophore hypothesis mainly includes the following two stages: the ligands are aligned to each other in internal coordinate space, and the produced conformations are aligned in Cartesian space. The functional features used to generate pharmacophore model mainly include H-bond donor atoms, H-bond acceptor atoms, hydrophobic and charged centers. The pharmacophore feature can be used to reveal the structural requirements for the inhibitory activity.Molecular dynamics simulations
In order to obtain ligand–protein structures closer to physiological conditions and to examine conformational and dynamical stability of the PI3Kδ protein with the binding ligand, MD simulations were performed using the Sybyl software package. Firstly, the docked complexes of PI3Kδ with the compound 16 and the newly designed compound, compound D04 and D06, were used as the initial structures for the MD simulations. Then, energy minimizations were performed for the complex molecules with AMBER7 FF99 force field and Gasteiger–Hückel charge using Boltzmann initial velocity. The simulations were executed using normal temperature and volume (NTV) ensemble 300 K with coupling 100 fs. Time interval between two steps was 5 fs and conformation snapshots were taken at every 1000 fs.43 The system setup for simulation included an 8 Å cutoff for non-bonded van der Waals interactions and periodic boundary conditions. The energy minimization of PI3Kδ ligand–protein complexes was performed. The coordinate trajectories were recorded every 1 ps throughout all MD runs. The 10 ns dynamics simulations were executed to obtain a stable complex conformation and compare the binding mode of the inhibitors.Results and discussion
Statistical analysis and validation
Based on the ligand alignments, CoMFA, CoMSIA and Topomer CoMFA approaches were carried out using a series of quinazolinone derivatives as novel PI3Kδ selective inhibitors. The statistical parameters summary of 3D-QSAR models were presented in Table 2. In the CoMFA model, the PLS regression analysis exhibited a q2 of 0.741 with 8 as the optimum number of components. Then, the non-cross-validated obtained an r2 value of 0.985, the F-value of 169.647 and SEE of 0.122. For this model, it is noted that the electrostatic field made higher contribution (64.9%) than that of the steric field (35.1%), which indicated that electrostatic property contributed more for binding affinity of PI3Kδ inhibitor as compared to steric property. In the CoMSIA model, the five descriptor fields are not completely independent of each other. As shown in Fig. S3,† the optimization of CoMSIA model were evaluated from the q2 values using 31 different combinations of five different descriptor fields. As five field descriptors were considered, a q2 value of 0.712 and r2 value of 0.989 were obtained. The corresponding contribution of steric, electrostatic, hydrophobic, and hydrogen bond donor and acceptor field were found to be 0.09, 0.34, 0.21, 0.19 and 0.17 respectively. Beside these data, the F-value, SEE value and ONC values were 204.012, 0.105 and 9, respectively. From the field contribution results, it was noted that the electrostatic, hydrophobic and H-bond fields of these compounds have great influences on the activities of the quinazolinone derivatives. Simultaneously, as for the Topomer CoMFA analysis, all of the molecules were investigated using the PLS, leave-one-out (LOO) method with CoMFA standard options for variable scaling. As shown in Table 2, the Topomer CoMFA analysis indicated a cross-validated q2 value of 0.698, r2 value of 0.968 with an optimized component of 6, and F-value of 116.022. Overall, the statistical results of the 3D-QSAR model were similar and within acceptable limit.| Parameters | CoMFA | CoMSIA | Topomer CoMFA | Constraints |
|---|---|---|---|---|
| q2 | 0.741 | 0.712 | 0.711 | >0.5 |
| ONC | 8 | 9 | 6 | — |
| r2 | 0.985 | 0.989 | 0.96 | >0.9 |
| SEE | 0.122 | 0.105 | 0.19 | ≪1 |
| F | 169.6 | 204 | 116 | ≫100 |
| rpred2 | 0.851 | 0.738 | 0.828 | >0.5 |
| MAEtraining | 0.073 | 0.053 | 0.120 | |
| MAEtest | 0.345 | 0.447 | 0.409 | |
| 0.1 × training set range | 0.423 | |||
| 0.15 × training set range | 0.635 | |||
| K | 1.017 | 1.015 | 1.006 | 0.85 < K < 1.15 |
| R02 | 0.983 | 0.968 | 0.996 | — |
| R2 | 0.872 | 0.833 | 0.869 | — |
| (R2 − R02)/R2 | −0.126 | −0.161 | −0.146 | <0.1 |
| Rm2 | 0.583 | 0.528 | 0.559 | >0.5 |
| Field contribution (%) | ||||
| Steric | 35.1 | 9.2 | ||
| Electrostatic | 64.9 | 33.8 | ||
| Hydrophobic | 20.6 | |||
| H-donor | 18.9 | |||
| H-acceptor | 17.5 | |||
These models were validated by a test set of 7 compounds, which displayed satisfactory rpred2 values of 0.851, 0.738 and 0.828 for CoMFA, CoMSIA and Topomer CoMFA models, respectively. Other external validation parameters of the models were also shown in Table 2. The CoMFA model was validated by the test set with a n-CV coefficient R2 value of 0.872, a Rm2 value of 0.583, a k value of 1.017, a R02 value of 0.983, and (R2 − R02/R2) value of −0.126. Similarly in CoMSIA model, the R2, R02, Rm2, k value and (R2 − R02/R2) value were found to be 0.833, 0.968, 0.528, 1.015 and −0.161, respectively. Simultaneously, the Topomer CoMFA analysis indicated R2 value of 0.869, R02 value of 0.996, the Rm2 value of 0.559, high k value of 1.006, and (R2 − R02/R2) value of −0.146. The results showed that the MAEtraining (0.073 for CoMFA, 0.053 for CoMSIA, 0.120 for Topomer CoMFA) and MAEtest (0.345 for CoMFA, 0.409 for Topomer CoMFA) values were both less than the 0.1 × training set range (0.423), indicating the good predictive ability of our model. In CoMSIA model, the MAEtest value of 0.447 was more than the 0.10 × training set range, but less than 0.15 × training set range indicating the moderate predictive ability of the model. All the external validation parameters of 3D-QSAR models were similar and in an acceptable limit. The plots showing the experimental and predicted pIC50 values for the total set in the CoMFA, CoMSIA and Topomer CoMFA approaches were represented in Fig. S4.† Most of points were uniformly distributed along the trend line, implying the predicted pIC50 values were in good agreement with the experimental pIC50 values. Moreover, the correlations of the experimental and predicted values showed a satisfactory predictive capability throughout the whole set of data.
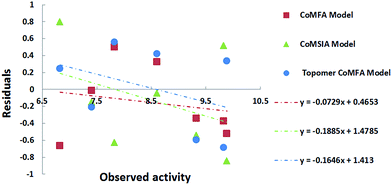
The presence of bias in prediction errors from QSAR model can be easily identified from a residual plot. As shown in Fig. 4, residual plots in the test set of 3D-QSAR models indicated that the residuals were randomly distributed around zero and did not show any pattern. In addition, the parameters of prediction errors were shown in Table 3. The NPE/NNE or NNE/NPE was less than 5, the ABS(MPE/MNE) or ABS(MNE/MPE) was less than 2, and the AAE-ABS(AE) value was more than 0.5 × AAE value. The results further proved that the 3D-QSAR models have a reliable predicted ability.
| Parameters | |AE| | AAE | MPE | |MNE| | NPE | NNE | NPE/NNE or NNE/NPE | ABS (MPE/MNE) or ABS (MNE/MPE) | AAE − ABS(AE) | 0.5 × AAE |
|---|---|---|---|---|---|---|---|---|---|---|
| CoMFA | 0.156 | 0.392 | 0.412 | 0.384 | 2 | 5 | 2.5 | 1.073 | 0.235 | 0.196 |
| CoMSIA | 0.097 | 0.504 | 0.712 | 0.421 | 2 | 5 | 2.5 | 1.692 | 0.407 | 0.252 |
| Topomer CoMFA | 0.027 | 0.436 | 0.358 | 0.539 | 4 | 3 | 1.333 | 1.508 | 0.409 | 0.218 |
Applicability domain
The predictive reliability of 3D-QSAR model can be validated by the applicability domain. A variety of approaches exist to determine application domain. Among the existing methods, the leverage approach (Williams plot) has been widely applied to recognize the outliers.44 In this study, the leverage value (h) and the standardized residuals of CoMSIA model were calculated. A simple measure of the applicability domain of the model is its leverage hi, which is defined as:| hi = xi(XXT)−1xTi (i = 1,…, n) | (7) |
3D-QSAR models contour map analysis
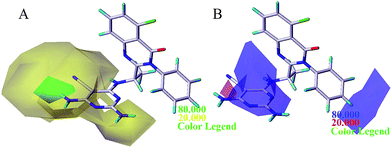
To visualize the field effects in 3D space, the contour maps (Fig. 5–8) produced by CoMFA, CoMSIA, and Topomer CoMFA were analyzed by superimposing them onto the most active molecule 16. These 3D contour maps help identify the favorable or unfavorable interaction energies and provided the key structural features required for the biological activity. Favored and disfavored levels were fixed at 80% and 20%, respectively. In the steric field contour map of CoMFA model, as shown in Fig. 5, one green contour at the 4-position of region A indicated that this position was tolerable for sterically favourable groups. According to Table 1, using bulky group such as –NH2 (molecule 1 with pIC50 = 7.00) in contrast to –H (molecule 2 with pIC50 = 5.77) at the 4-position of region A would result in increase of activity. This is also observed between molecules 4 and 3, 19 and 6, where compound 4 and 19 possessed –NH2 and –Cl substituents respectively and displayed higher inhibitory activity than compound 3 and 6. In addition, compounds 16, 20 and 6 have an order of the activities of 16 > 20 > 6, in good agreement with the order of the bulk of corresponding 4-substituent groups (–NH2 > –CH3 > –H) respectively. Another small green contour was around 2-position of region A, and this is a possible reason why molecule 16 was more potent than molecule 4 which had no substituent at this position. It can also be proved by the fact that compound 6 displayed better activity than compound 3. A big yellow contour around 3-position of region B indicated a restriction in the increasing size of the substituents. This phenomenon can be observed between molecules 16, 22, 23, 28, and 26 where increasing the bulk propriety (–H < –F < –Cl < –CHF2 < –CF3) would result in decrease of inhibitory activity (10.0 > 9.82 > 9.35 > 9.27 > 8.44), respectively.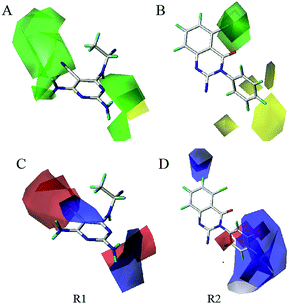 | ||
| Fig. 7 Steric (A, B) and electrostatic(C, D) contour maps of Topomer CoMFA model around R1 and R2 fragments. | ||
In the CoMFA electrostatic contour map, as displayed in Fig. 5B, two small red contours around the cyano group of pyrimidine ring indicated that an increase in the electron density will be favourable to enhance the activity. Compound 4 and compound 3 with cyano group as substituent showed better activity than corresponding compound 1 and compound 2. Moreover, this fact was also observed between molecules 8, 7, and 9 where increasing the electron density (–CF3 > –CONH2 > –CH3) would result in increase of inhibitory activities (8.67 > 8.00 > 7.85), respectively. A large blue contour around the 4-position of region A revealed the importance of positive atomic groups. It can be explained by comparing molecule 20 (having methyl group) and 19 (having chlorine group), the group with positive charge at this position would lead to the increase of pIC50 values. Simultaneously, one medium blue cubes near 3-position of region B indicated that the positively charged groups were preferable. As can be seen from Table 1, using the positively charged substituents (–OCH3 > –CH2CHF2 > –CN > –CF3) would lead to increase of pIC50 values in the molecules (25 > 27 > 24 > 26).
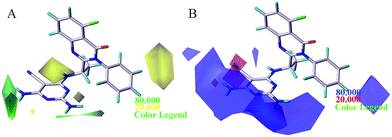
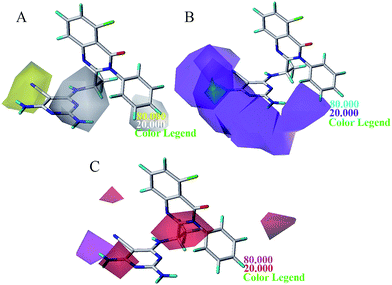
The steric and electrostatic contour maps of CoMSIA and Topomer CoMFA were described in Fig. 6 and 7. Not surprisingly, the contour maps showed good agreement with that of CoMFA model, so they were not discussed. The hydrophobic contour plot was constructed through CoMSIA model, presenting in Fig. 8A. The yellow and gray color represented favorable and unfavorable hydrophobic areas, respectively. A medium yellow cube surrounding the cyano group of pyrimidine ring indicated that hydrophobic property in this region might increase the activity. Compound 7 showed less bioactivity than compounds 4 and 8, which may be due to the fact that –CONH2 was replaced by relative hydrophobic substituent –CN and –CF3. Compounds 11, 12, 13, 14 and 15 showed better inhibitory activity, because 5-position of pyrimidine contained hydrophobic substituent alkynyl. A large grey contour surrounding the 2-position of pyrimidine ring suggested that hydrophilic group was favored at this place. The compound 17 showed lower bioactivity than compound 4 due to the introduction of chlorine increased the hydrophobic property of pyrimidine. Another gray contours around the 3-position of benzene ring was found to be hydrophobic unfavorable. And when this criterion was applied to compounds 16, 23, 26 and 28, the activity was found in the order of 16 > 23 > 28 > 26.
The results of statistical analysis revealed that H-bond donor field had significant contribution on the PI3Kδ inhibitory activity. As shown in Fig. 8B, the cyan and purple contours display the favorable and unfavorable H-bond donor region respectively. Two small cyan contours near 4-position of region A suggested that hydrogen bond donor atoms were favorable in these regions. It can be demonstrated by the fact that compound 1, 4 and 16 where using –NH2 substituent at this position showed satisfactory activity. In addition, a large purple contour was around N atom of pyrimidine ring, indicating that hydrogen bond acceptor atom was conducive to the improvement of bioactivity. The nitrogen atom in this position may be beneficial to the generation of hydrogen bond between the compound and PI3Kδ protein. The H-bond acceptor contour plot of CoMSIA model containing the most active compound 16 was illustrated in Fig. 8C, and the magenta and red contours show favorable and unfavorable hydrogen bond acceptor region. A large red tetrahedron surrounding the 4-position of pyrimidine ring indicated that hydrogen bond donor group was advantaged to inhibitory activity, which was consistent with the H-bond donor contour map of CoMSIA as shown in Fig. 8B. Moreover, a magenta contour was around 5-position of pyrimidine ring (region A). For example, compound 4 and 3 which using –CN substituent at this position displayed higher activity than compound 1 and 2. Based on the information derived from CoMFA, Topomer CoMFA and CoMSIA can be utilized strategically in the design of novel quinazolinone derivatives with better PI3Kδ inhibitory activity.
Molecular docking study
Molecular docking was widely used to investigate the binding modes between the ligand and receptor protein, which aided in understanding the quantitative structure–activity relationship revealed by 3D-QSAR models. Firstly, re-docking simulation was applied to validate the accuracy of molecular docking. The original ligand extracted from the 4XE0 protein crystal structure was re-docked into the ATP site of the p110δ catalytic subunit, as shown in Fig. S6,† which indicated that the conformation of re-docked ligand (cyan) was same to that of original ligand (red). According to the docking result, the quinazolinone ring adopted a perpendicular conformation to the purine hinge binder, and the benzene ring was perpendicular to the quinazolinone group. The purine hinge binder formed hydrogen bonding interaction with Val828, and the H-bond distances was observed to be 1.93 Å (C![[double bond, length as m-dash]](https://www.rsc.org/images/entities/char_e001.gif) N⋯H–Val828). Overall, the Surflex-Dock program can successfully reproduce the original docking conformation of PI3Kδ protein.
N⋯H–Val828). Overall, the Surflex-Dock program can successfully reproduce the original docking conformation of PI3Kδ protein.
Subsequently, all the 37 compounds were docked into PI3Kδ ligand-binding pocket to explore the binding mode of compounds in this study. As shown in Fig. S8,† most of the quinazolinone derivatives bind in the active pocket in the similar propeller-like conformation with the original ligand. Moreover, H-bond interactions were found between the quinazolinone derivatives and several key residues, such as Glu826, Val828, Thr833, Asn836, Met752 and Asp911. In addition, the binding conformation and key interactions of the most active molecule 16 with receptor was shown in Fig. 9A. It formed four hydrogen bonds with the residues Glu826, Val828 and Asp911. The existing interaction, including hydrogen bond, electrostatic, van der Waals and hydrophobic interaction was shown in Fig. 9B. The 2-NH2 group of pyrimidine formed one hydrogen bond interaction with the amino acid Val828 at distance of 2.16 Å, and nitrogen atom at 3-position of the pyrimidine was hydrogen bonded to residue Val828 (2.09 Å). Additionally, the 5-CN of pyrimidine ring formed a hydrogen bond with Asp911 at distance of 2.80 Å, and the 4-NH2 group was hydrogen bonded to residue Glu826 (1.92 Å). It was consistent with the H-bond donor contour map of CoMSIA as shown in Fig. 8B, where 2, 4-position of the region A was found favorable as hydrogen bond donor groups. And the quinazolinone ring formed hydrophobic interactions with amino acids Met752, Trp760 and Ile777, indicated that the hydrophobic group at quinazolinone was favorable for the binding affinity. Hydrophilic amino acids Asp832, Thr833 and Asn836 were found near 3-position of the region B, indicated that the hydrophilic group at the region was favorable. As shown in Fig. 5B, negatively charged amino acids like Glu826 and Asp911 were found surrounding the 2, 4-position of the region A and validated the CoMFA electrostatic contour map where the blue cube over region A indicated electropositive groups were favorable. Moreover, the other residues, such as Phe751, Thr833, Asn836, and Met900, could also stabilize ligand through electrostatic interaction (Fig. 9B).
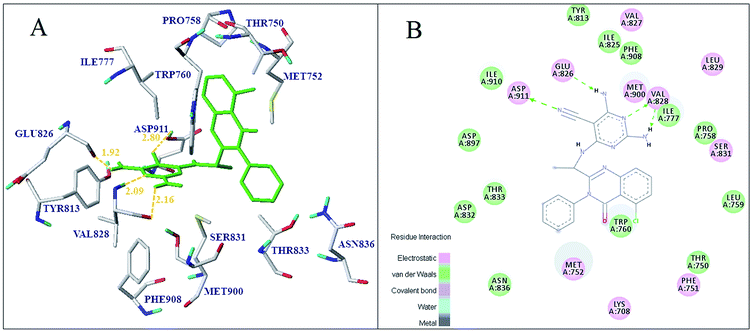 | ||
| Fig. 9 Docking result of compound 16 (A) in the protein active site, ligand (green) and 2D interaction map of compound 16 (B) with 4XE0. | ||
Meanwhile, according to the docking results of all the compounds, the compound 06 and 16 with 2-NH2 at region A formed additional H-bond interactions with Glu826, showed better inhibitory activity and higher docking score compared with compound 03 and 04, which have not H-bond donor substituents in the same position. Meanwhile, the compound 02 with 4-NH2 at region A formed additional H-bond interactions with Val828, showed higher binding affinity compared with compound 01, which indicated H-bond donor substituents in this region was favorable. It can also be proved by the fact that compound 04 and 16 displayed higher activity than compound 03 and 07. Furthermore, the docking result of the least active molecule 02 indicated that only one hydrogen bond interaction was formed with the residue Val828 at distance of 2.07 Å. These results suggested that the higher active molecules have stronger H-bond interactions with Glu826 and Val828 than less active molecules. It can be found that H-bond interactions with Glu826 and Val828 were critical to maintain the activity and stability of the PI3Kδ inhibitor. The docking analysis of compound 22 and 31 with higher activity indicated that the electrostatic interactions with residues Ser831, Asp832 and Thr833 were improved by introducing F substituent to benzene ring. Furthermore, the docking analysis showed that most studied ligands fit into a hydrophobic pocket formed by amino acids Met752, Trp760 and Ile777, and formed electrostatic interactions with Ser831, Asp832, Thr833 and Asn836. It can be concluded that enhancing hydrogen-bond interaction with Glu826, Val828 and Asp911, and hydrophobic interaction with Met752, Trp760, Ile777, Thr833 and Met900, were very significant to improve the activity and stability of the inhibitor. Moreover, the binding interaction patterns were complementary to those of CoMFA, Topomer CoMFA and CoMSIA contour maps.
To further validate the binding mode and 3D-QSAR models, the molecular computer aided design procedure (MOLCAD) was employed. MOLCAD calculate and display the cavity depth (CD), electrostatic potential (EP), lipophilic potential (LP), and hydrogen bond site (HB) of the binding pocket. Fig. S7† depicted the MOLCAD potential surfaces structure of the binding pocket of the compound 16. As shown in Fig. S7,† the substitute at the 5-position of pyrimidine was oriented to red surface, thus hydrogen bond acceptor group would be favorable; 2-NH2 and 4-NH2 at region A were oriented to blue area, which indicated that the surface of this region was functioned as H-bond acceptors. The observations from this hydrogen bonding sites were matched with the docking results and CoMSIA H-bond donor contour map. Fig. S7† indicated that the substituent at 5-position of compound 16 were closed to the hydrophobic region of the active pocket, and it also indicated that more hydrophobic group could improve the inhibitory activity. Furthermore, the major color of the quinazolinone skeleton is brown, which indicated that hydrophobic interaction in this region is favorable. Meanwhile, the docking surface of all compounds, as shown in Fig. S8,† indicated that most compounds docked to the same binding pocket in a propeller-like conformation with compound 16. These results indicated that the MOLCAD-generated surface maps of binding site were in good consistency with the 3D-QSAR contour maps and docking poses in terms of electrostatic, hydrophobic and hydrogen-bonding potential.
Pharmacophore models
The pharmacophore models were constructed based on the multi-complexes to propose structural determinants for PI3Kδ inhibition, and consider the interaction between small molecules and protein. As can be seen from Fig. 3, all five PI3Kδ protein subunits were well aligned and all small inhibitor molecules were located at the same binding site, which indicated that these small molecule inhibitors interaction with PI3Kδ protein in a similar pattern. A representative pharmacophore model with the highest SPECIFICITY value 4.587 was illustrated in Fig. 10, indicate that four H-bond (HB) acceptors (green), and four hydrophobic (light blue) features were crucial for PI3Kδ inhibition. Four hydrophobic centers represented the centers of quinazolinone ring, benzene ring and pyrimidine ring, which formed strong hydrophobic interactions with the key amino acids Met752, Trp760, Ile777, Val828 and Met900 to increase inhibitory activity. It indicated that quinazolinone ring was an essential element to retain compound potency to PI3Kδ. The two H-bond acceptor centers next to N-1 and N-3 of the pyrimidine indicated that hydrogen bond acceptor atoms in these two positions can enhance the activity. This pharmacophore model was consistent with the results of 3D-QSAR models and molecular docking analysis, which provides helpful information about a rational modification of new molecules based in quinazolinone scaffold.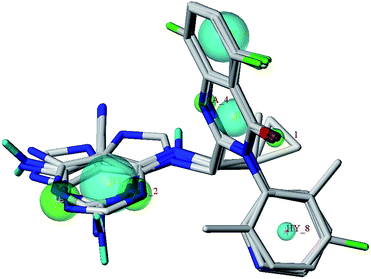 | ||
| Fig. 10 The best pharmacophore model aligned to five PI3Kδ inhibitors (hydrophobic features in cyan and H-bond acceptor atoms in green). | ||
Summary of the structure–activity relationships
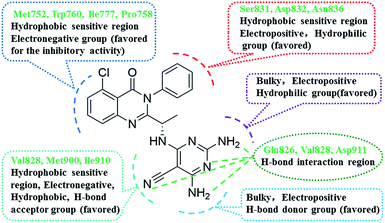
Based on the integration of 3D-QSAR models, molecular docking and pharmacophore model, the structure–activity relationships of novel quinazolinone derivatives bearing a 2,4,6-triaminopyrimidine motif has been revealed as shown in Fig. 11. These results indicated that some favourable interactions of key amino acid residues with these quinazolinone derivatives would be responsible for an improvement of the PI3Kδ activity. The main interactions involved were hydrogen bond interactions with residue Glu826, Val828 and Asp911, hydrophobic interactions of the quinazolinone skeleton with amino acids Met752, Trp760 and Ile777, and electrostatic interactions with Ser831, Asp832 and Asn836. In addition, it was observed that positively charged substituents, and bulky group at the 2-position and the 4-position of the region A; and the electronegative substituents, H-bond acceptors at 5-position of the region A are favorable for activity. Whereas the substituent on the substituent at the 3-position of the region B should be small, electropositive, hydrophilic group. Moreover, positively charged and H-bond donors at the 4-position of the region A were crucial for improving the PI3Kδ inhibitory activity.Design of novel compounds with higher inhibitory activity
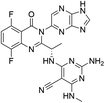
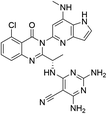
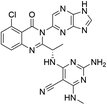
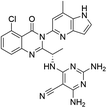
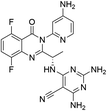
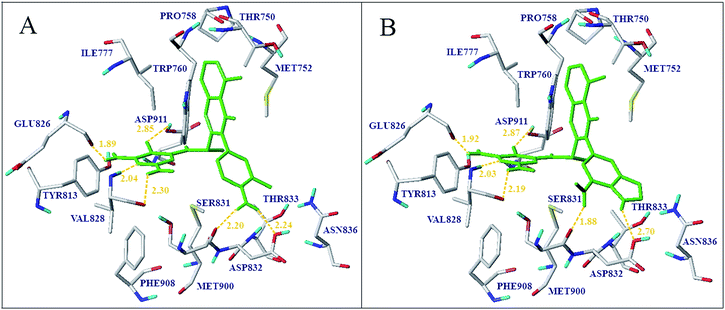
Based on the detailed contour analyses of 3D-QSAR models and molecular docking, key structural features of ligands responsible for biological activities were incorporated in the quinazolinone scaffold to design new molecules as novel PI3Kδ inhibitor. Compound 16 with the highest inhibitory activity was taken as a template molecule. A yellow contour near 3-position of region B revealed that the bulky group reduced the biological activity. Methyl and amino were introduced to the meta-position of region B to yield compounds D04, D09, and D10, respectively. Two small green contour near 4-position of pyrimidine suggested that the bulky group favored the biological activity and yielded compound D01, D02 and D07. A large blue contours observed near the benzene ring implied that this position was unsuitable for substitution with electronegative atoms. Owing to the introduction of the H-bond acceptor or donor groups into the region B was crucial to the inhibitory potency improvement. So, the benzene ring was replaced by pyridine, purine or pyrrolo-pyridine to weaken the electron density of the region B and enhance the H-bond interaction with protein. In addition, 3-position of region B is substituted by electropositive groups, such as methyl, amino and methylamino. A medium-sized white contour beside region B indicated that hydrophilic moieties were beneficial to the biological activity. And a large red contour at this position showed that H-bond donor group improved the biological activity; thus the amino is introduced to design new compounds. The CoMFA and CoMSIA models were applied to predict the activity of the designed molecules. What's more, the newly designed molecules were docked into the active site. The docking results indicated that the new designed compounds possessed higher docking score, and the orientation of the conformation is similar with that of the co-crystallized ligands. The comparison of the predicted activity of the newly designed 10 molecules between CoMFA and CoMSIA models were showed in Table 4. Compound D04 and D06 have the higher predicted activity and docking score hence considered for further molecular docking and MD simulation analysis. All of the designed molecules showed better activity than the reference molecule 16, which indicated that the 3D-QSAR model has a good predictability and could be used to design new molecules with better activity.In order to prioritize the designed compounds, docking analysis was performed to validate the binding modes of all designed compounds. They were showing similar binding pattern as that of known potent inhibitors with important hydrogen bonds interactions, most notably with the hinge residues Glu826, Val828 and Asp911. Two newly designed molecules which have a higher activity predicted by 3D-QSAR model, D04 and D06 were selected for an in-depth analysis. As shown in Fig. 12, compound D06 and D04 were both docked in the binding site via six hydrogen bonds in similar propeller-like conformation with original ligand. Five residues (Glu826, Val828, Ser831, Asp832 and Asp911) were suggested to be crucial because they can form hydrogen bonds with the designed molecules. The H-bond distances of D04 with the key residues were observed to be 1.89 Å (N–H⋯O![[double bond, length as m-dash]](https://www.rsc.org/images/entities/char_e001.gif) C–Glu826), 2.04 Å (N⋯H–N–Val828), 2.30 Å (N–H⋯O
C–Glu826), 2.04 Å (N⋯H–N–Val828), 2.30 Å (N–H⋯O![[double bond, length as m-dash]](https://www.rsc.org/images/entities/char_e001.gif) C–Val828), 2.85 Å (CN⋯H–O–Asp911) respectively. Additionally, the amino of pyridine as hydrogen bond donor group formed two strong hydrogen bond interactions with the amino acid Ser831 and Asp832 at distance of 2.20 Å and 2.24 Å, respectively. The pyrimidine ring of D04 formed hydrophobic interactions with Ile777, Val828, Met 900 and Ile910 (Fig. S9†). In addition, the quinazolinone ring sandwiched between Met752, Pro758, Trp760 and Ile777. The van der Waals interactions were observed between compound D04 and the residues, Leu759, Trp760, His830, Phe908 and Ile910, and the relative position of quinazolinone ring changed in contrast to that of compound 16. As shown in Fig. S9,† the quinazolinone ring of D04 formed strong van der Waals interaction with the residues, Pro758, Leu759 and Trp760 at a relative short distance. In addition, van der Waals interactions between pyrimidine ring and key residues Phe908 and Ile910 were observed in the binding pocket, which further improved the stability of ligand in active site. Compound D06 anchored in the binding site via six hydrogen bonds as shown in Fig. 12B. H-bond interactions of D06 were almost identical with D04, observed to be 1.92 Å (N–H⋯O
C–Val828), 2.85 Å (CN⋯H–O–Asp911) respectively. Additionally, the amino of pyridine as hydrogen bond donor group formed two strong hydrogen bond interactions with the amino acid Ser831 and Asp832 at distance of 2.20 Å and 2.24 Å, respectively. The pyrimidine ring of D04 formed hydrophobic interactions with Ile777, Val828, Met 900 and Ile910 (Fig. S9†). In addition, the quinazolinone ring sandwiched between Met752, Pro758, Trp760 and Ile777. The van der Waals interactions were observed between compound D04 and the residues, Leu759, Trp760, His830, Phe908 and Ile910, and the relative position of quinazolinone ring changed in contrast to that of compound 16. As shown in Fig. S9,† the quinazolinone ring of D04 formed strong van der Waals interaction with the residues, Pro758, Leu759 and Trp760 at a relative short distance. In addition, van der Waals interactions between pyrimidine ring and key residues Phe908 and Ile910 were observed in the binding pocket, which further improved the stability of ligand in active site. Compound D06 anchored in the binding site via six hydrogen bonds as shown in Fig. 12B. H-bond interactions of D06 were almost identical with D04, observed to be 1.92 Å (N–H⋯O![[double bond, length as m-dash]](https://www.rsc.org/images/entities/char_e001.gif) C–Glu826), 2.03 Å (N⋯H–N–Val828), 2.19 Å (N–H⋯O
C–Glu826), 2.03 Å (N⋯H–N–Val828), 2.19 Å (N–H⋯O![[double bond, length as m-dash]](https://www.rsc.org/images/entities/char_e001.gif) C–Val828), 1.88 Å (N–H⋯O
C–Val828), 1.88 Å (N–H⋯O![[double bond, length as m-dash]](https://www.rsc.org/images/entities/char_e001.gif) C–Ser831), 2.70 Å (N–H⋯O–H–Asp832) and 2.87 Å (CN⋯H–O–Asp911), respectively. Moreover, the hydrophobic and electrostatic interactions of the designed molecules were similar with the molecule 16 as shown in Fig. S9.† Moreover, the designed compounds all adopted the desired propeller-like docking conformation which was requisite to improve PI3Kδ-selective inhibitory activity. Compared to the known potent inhibitors, the number of hydrogen bonds and the key residues in the binding pocket and the binding affinities of the designed molecules obviously increased. Hence, these designed compounds were anticipated to be candidate compounds for the relevant researchers' experimental synthesis.
C–Ser831), 2.70 Å (N–H⋯O–H–Asp832) and 2.87 Å (CN⋯H–O–Asp911), respectively. Moreover, the hydrophobic and electrostatic interactions of the designed molecules were similar with the molecule 16 as shown in Fig. S9.† Moreover, the designed compounds all adopted the desired propeller-like docking conformation which was requisite to improve PI3Kδ-selective inhibitory activity. Compared to the known potent inhibitors, the number of hydrogen bonds and the key residues in the binding pocket and the binding affinities of the designed molecules obviously increased. Hence, these designed compounds were anticipated to be candidate compounds for the relevant researchers' experimental synthesis.
Molecular dynamics simulations
Molecular dynamics simulations were performed on PI3Kδ protein–ligand complexes to obtain the stable binding conformation and further validate the docking results. Herein, to compare and evaluate dynamic behavior and stability of molecule 16 and newly designed molecules D04 and D06, 10 ns MD simulations were carried out by taking the best docked conformations as the initial structures. The alignment results of molecular dynamics simulated and original docking ligand, as shown in Fig. S10,† indicated that compounds 16, D04, and D06 adopted a similar binding conformation in the active pocket of PI3Kδ with its docking results. To explore the dynamic stability of the system, root-mean-square deviations (RMSD) relative to initial structures was calculated during 10 ns of MD trajectories. The RMSD of protein–ligand backbone for each complex, as shown in Fig. 13, remained stable during the following simulation time after a 0.5 ns rapid increase, which indicated that the system reached equilibrium. In the three studied protein–ligand complex, change in total energies during the simulation period was calculated. Furthermore, the changes of protein–ligand complexes in potential energy, kinetic energy and temperature with simulation time were depicted in Fig. S11,† which revealed that PI3Kδ protein complexes were stable during MD runs. These MD results indicated that no abnormal behavior occurred in the PI3Kδ protein–ligand complexes. Analysis of protein–ligand interactions for the three MD-simulated complexes indicated that the binding patterns were similar to original ligand compound. As shown in Fig. S12,† the key interaction features of hydrogen bonds with residue Glu826, Val828 and Asp911, and hydrophobic interactions with Met752, Trp760 and Ile777, which had been validated by molecular docking, still played key roles in the binding. Moreover, it can be found that the additional hydrogen bond interactions of the newly introduced heterocycle structure with amino acids Ser831 and Asp832 were responsible for its high affinity for PI3Kδ. The molecular dynamics simulation confirmed the docking results of the PI3Kδ protein–ligand complex, and further verified the accuracy and stability of the 3D-QSAR model.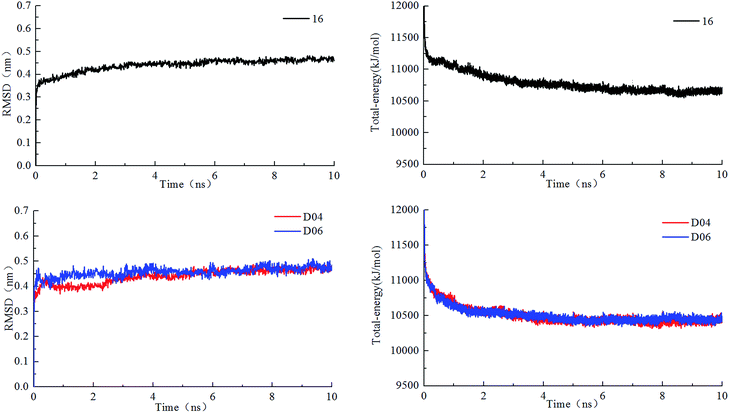 | ||
| Fig. 13 Root mean square deviations and total energy of protein–ligand complexes during 10 ns simulation time. | ||
Conclusion
In this study, the relationship of functional groups with the biological activities was investigated through 3D-QSAR, molecular docking, pharmacophore model and MD simulations. The 3D-QSAR models of maximum common substructure alignment showed that the inhibitory activities of quinazolinone derivatives were greatly influenced by the electrostatic, hydrophobic field. The contour map indicated that the 4-position of region A can be explored for positively charged and H-bond donor groups, and region B can be modified by using a ring system, which consisted of a combination of an electropositive groups, H-bond donor atoms and hydrophilic groups to increase activity, which were consistent with the experimental results of Patel et al. Molecular docking analysis of all compounds indicated that the key amino acids influencing the ligand–receptor binding affinity are Glu826, Val828, Trp760, Ile777, Met752 and Asp911, which form strong H-bond and hydrophobic interaction in the active site. Good concordance was found between 3D-QSAR models, molecular docking and MD simulations results. Moreover, the molecular surfaces via MOLCAD interface and pharmacophore model were further validated and supplemented the results of 3D-QSAR models. Favourable pharmacophore structural features were incorporated in the quinazolinone scaffold; ten analogs were designed, from which compound D04 and D06 showed better predicted activity and binding affinity with PI3Kδ. MD simulations of the two designed compounds gave a stable propeller-like conformation, which showed similar interaction with crucial residues and additional strong hydrogen bond interactions with Ser831 and Asp832. These results indicated that hydrogen bond and hydrophobic interactions have an important effect on improving the activity and stability of the inhibitor. The designed compounds can be possible virtual leads for the relevant researchers, which ensure that every drug synthesized and pharmacologically tested should be as meaningful as possible. Overall, the combination of these modeling methods may be a good lead to the research and development of novel potent PI3Kδ inhibitors for the treatment of CLL.Conflicts of interest
The authors declare that there is no financial/commercial conflict of interest.References
- C. Nabhan and S. T. Rosen, JAMA, 2014, 312, 2265–2276 CrossRef PubMed.
- T. Robak, K. Warzocha, B. K. Govind, Y. Kulyaba, K. Kuliczkowski, J. Loscertales, I. Kryachok, J. Kłoczko, G. Rekhtman, W. Homenda, J. Z. Błoński, A. McKeown, C. N. Chang, V. Bal, S. Lisby, I. V. Gupta and S. Grosicki, Leuk. Lymphoma, 2017, 58, 1598–1606 CrossRef CAS PubMed.
- L. Vidal, R. Gurion, R. Ram, P. Raanani, O. Bairey, T. Robak, A. G. Gvili and O. Shpilberg, Leuk. Lymphoma, 2016, 57, 2047–2057 CrossRef CAS PubMed.
- Y. Herishanu, N. Goldschmidt, O. Bairey, R. Ruchlemer, R. Fineman, N. Rahimi-Levene, L. Shvidel, T. Tadmor, A. Ariel, A. Braester, M. Shapiro, E. Joffe and A. Polliack, Haematologica, 2015, 100, 662–669 CrossRef CAS PubMed.
- C. Vitale, L. Falchi, H. E. Ten, H. Gao, H. Shaim, R. K. Van, G. Calin, S. O'Brien, S. Faderl, X. Wang, W. Wierda, K. Rezvani, J. M. Reuben, J. A. Burger, M. J. Keating and A. Ferrajoli, Clin. Cancer Res., 2016, 22, 2359–2367 CrossRef CAS PubMed.
- K. Shimada, A. Tomita, S. Saito and H. Kiyoi, Br. J. Haematol., 2014, 166, 455–457 CrossRef CAS PubMed.
- S. Molica, Expert Rev. Hematol., 2014, 7, 187–190 CrossRef CAS PubMed.
- M. Mita, A. Mita and E. K. Rowinsky, mTOR Inhibition for Cancer Therapy: Past, Present and Future, Springer, Paris, 2016 Search PubMed.
- B. Do, M. Mace and A. Rexwinkle, Am. J. Health-Syst. Pharm., 2016, 73, 547–555 CrossRef CAS PubMed.
- M. C. Lanasa, M. Glenn, A. R. Mato, S. D. Allgood, S. Wong, B. Amore, G. Means, E. Stevens, C. Yan, G. Friberg and A. Goy, Blood, 2013, 122, 678–679 Search PubMed.
- J. Delgado, T. Baumann, R. Santacruz and E. Montserrat, Expert Opin. Pharmacother., 2014, 15, 823–832 CrossRef CAS PubMed.
- S. L. Locatelli, G. Careddu, G. Inghirami, L. Castagna, P. Sportelli, A. Santoro and C. Carlo-Stella, Leukemia, 2016, 30, 2402–2405 CrossRef CAS PubMed.
- K. Balakrishnan, M. Peluso, M. Fu, N. Y. Rosin, J. A. Burger, W. G. Wierda, M. J. Keating, K. Faia, S. O'Brien, J. L. Kutok and V. Gandhi, Leukemia, 2015, 29, 1811–1822 CrossRef CAS PubMed.
- A. Cahn, J. N. Hamblin, M. Begg, R. Wilson, L. Dunsire, S. Sriskantharajah, M. Montembault, C. N. Leemereise, L. Galinanes-Garcia, H. Watz, A. M. Kirsten, R. Fuhr and E. M. Hessel, Pulm. Pharmacol. Ther., 2017, 46, 69–77 CrossRef CAS PubMed.
- M. Wei, X. Wang, Z. Song, M. Jiao, J. Ding, L. Meng and A. Zhang, Med. Res. Rev., 2015, 35, 720–752 CrossRef CAS PubMed.
- L. Patel, J. Chandrasekhar, J. B. Evarts, A. C. Haran, C. Ip, J. A. Kaplan, M. Kim, D. Koditek, L. Lad, E. Lepist, M. E. McGrath, N. Novikov, S. Perreault, K. D. Puri, J. R. Somoza, B. H. Steiner, K. L. Stevens, J. Therrien, J. Treiberg, A. G. Villaseñor, A. Yeung and G. Phillips, J. Med. Chem., 2016, 59, 3532–3548 CrossRef CAS PubMed.
- J. C. Dearden, International Journal on Quantitative Structure-Reactivity and Property Relationships, 2016, 1, 1–44 CrossRef.
- K. Roy, S. Kar and R. N. Das, Understanding the Basics of QSAR for Applications in Pharmaceutical Sciences and Risk Assessment, Elsevier, London, 2015 Search PubMed.
- S. P. Mandal, Mithuna, A. Garg, S. S. Sahetya, S. R. Nagendra, H. S. Sripad, M. M. Manjunath, Sitaram, M. Soni, R. N. Baig, S. V. Kumar and B. R. Prashantha Kumar, RSC Adv., 2016, 6, 58641–58653 RSC.
- S. Patel, B. Patel and H. Bhatt, J. Taiwan Inst. Chem. Eng., 2016, 59, 61–68 CrossRef CAS.
- E. Cichero, C. Brullo, O. Bruno and P. Fossa, RSC Adv., 2016, 6, 61088–61108 RSC.
- R. D. Cramer, D. E. Patterson and J. D. Bunce, J. Am. Chem. Soc., 1988, 110, 5959–5967 CrossRef CAS PubMed.
- G. Klebe, U. Abraham and T. Mietzner, J. Med. Chem., 1994, 37, 4130–4146 CrossRef CAS PubMed.
- R. D. Cramer, J. Med. Chem., 2003, 46, 374–388 CrossRef CAS PubMed.
- S. Shuaib, R. K. Saini, D. Goyal and B. Goyal, ChemistrySelect, 2017, 2, 1645–1657 CrossRef CAS.
- X. W. Liu, D. F. Shi, S. Y Zhou, H. L. Liu, H. X. Liu and X. J. Yao, Expert Opin. Drug Discovery, 2017 DOI:10.1080/17460441.2018.1403419.
- R. K. Saini, S. Shuaib and B. Goyal, J. Mol. Recognit., 2017, 30, e2656 CrossRef PubMed.
- J. Nasica-Labouze, P. H. Nguyen, F. Sterpone, O. Berthoumieu, N. V. Buchete, S. Coté, A. De Simone, A. J. Doig, P. Faller, A. Garcia, A. Laio, M. S. Li, S. Melchionna, N. Mousseau, Y. Mu, A. Paravastu, S. Pasquali, D. J. Rosenman, B. Strodel, B. Tarus, J. H. Viles, T. Zhang, C. Wang and P. Derreumaux, Chem. Rev., 2015, 115, 3518–3563 CrossRef CAS PubMed.
- J. R. Somoza, D. Koditek, A. G. Villaseñor, N. Novikov, M. H. Wong, A. Liclican, W. Xing, L. Lagpacan, R. Wang, B. E. Schultz, G. A. Papalia, D. Samuel, L. Lad and M. E. McGrath, J. Biol. Chem., 2015, 290, 8439–8446 CrossRef CAS PubMed.
- Z. Ul-Haq, N. Khan, S. K. Zafar and S. T. Moin, Eur. J. Pharm. Sci., 2016, 88, 26–36 CrossRef CAS PubMed.
- J. Romero-Parra, H. Chung, R. A. Tapia, M. Faúndez, C. Morales-Verdejo, M. Lorca, C. F. Lagos, V. D. Marzo, C. D. Pessoa-Mahana and J. Mella, Eur. J. Pharm. Sci., 2017, 101, 1–10 CrossRef CAS PubMed.
- S. Yu, J. Yuan, J. Shi, X. Ruan, T. Zhang, Y. Wang and Y. Du, Chemom. Intell. Lab. Syst., 2015, 146, 34–41 CrossRef CAS.
- P. P. Roy, J. T. Leonard and K. Roy, Chemom. Intell. Lab. Syst., 2008, 90, 31–42 CrossRef CAS.
- A. Golbraikh and A. Tropsha, J. Mol. Graphics Modell., 2002, 20, 269–276 CrossRef CAS PubMed.
- P. P. Roy and K. Roy, Mol. Inf., 2010, 27, 302–313 Search PubMed.
- K. Roy, R. N. Das, P. Ambure and R. B. Aher, Chemom. Intell. Lab. Syst., 2016, 152, 18–33 CrossRef CAS.
- K. Roy, P. Ambure and R. B. Aher, Chemom. Intell. Lab. Syst., 2017, 162, 44–54 CrossRef CAS.
- J. Ruppert, W. Welch and A. N. Jain, Protein Sci., 1997, 6, 524–533 CrossRef CAS PubMed.
- N. Singh, P. Shah, H. Dwivedi, S. Mishra, R. Tripathi, A. A. Sahasrabuddhe and M. I. Siddiqi, Mol. BioSyst., 2016, 12, 3711–3723 RSC.
- A. R. Leach, V. J. Gillet, R. A. Lewis and R. Taylor, J. Med. Chem., 2010, 53, 539–958 CrossRef CAS PubMed.
- A. Berndt, S. Miller, O. Williams, D. D. Le, B. T. Houseman, J. I. Pacold, F. Gorrec, W. Hon, P. Ren, Y. Liu, C. Rommel, P. Gaillard, T. Rückle, M. K. Schwarz, K. M. Shokat, J. P. Shaw and R. L. Williams, Nat. Chem. Biol., 2010, 6, 117–124 CrossRef CAS PubMed.
- L. Patel, J. Chandrasekhar, J. Evarts, K. Forseth, A. C. Haran, C. Ip, A. Kashishian, M. Kim, D. Koditek, S. Koppenol, L. Lad, E. Lepist, M. E. McGrath, S. Perreault, K. D. Puri, A. G. Villaseñor, J. R. Somoza, B. H. Steiner, J. Therrien, J. Treiberg and G. Phillips, J. Med. Chem., 2016, 59, 9228–9242 CrossRef CAS PubMed.
- U. Chaube, D. Chhatbar and H. Bhatt, Bioorg. Med. Chem. Lett., 2016, 26, 864–874 CrossRef CAS PubMed.
- D. Gadaleta, G. F. Mangiatordi, M. Catto, A. Carotti and O. Nicolotti, International Journal on Quantitative Structure-Reactivity and Property Relationships, 2016, 1, 45–63 CrossRef.
Footnote |
| † Electronic supplementary information (ESI) available. See DOI: 10.1039/c7ra10870b |
| This journal is © The Royal Society of Chemistry 2017 |

