 Open Access Article
Visible light-induced photocatalytic degradation of gas-phase acetaldehyde with platinum/reduced titanium oxide-loaded carbon paper†
Soonhyun Kim *a,
Minsun Kima,
Ha-Young Leeb and
Jong-Sung Yu
 *b
*b
aSmart Textile Convergence Research Group, Daegu Gyeongbuk Institute of Science and Technology (DGIST), Daegu, 42988, Republic of Korea. E-mail: sh2358@dgist.ac.kr; Fax: +82-53-785-3439; Tel: +82-53-785-3410
bDepartment Energy Science and Engineering, Daegu Gyeongbuk Institute of Science and Technology (DGIST), Daegu, 42988, Republic of Korea. E-mail: jsyu@dgist.ac.kr; Fax: +82-53-785-6409; Tel: +82-53-785-6443
First published on 1st November 2017
Abstract
Visible light-induced degradation of gas-phase acetaldehyde (CH3CHO) is investigated using O-deficient reduced TiO2−x-loaded carbon paper. The carbon paper is synthesized by the pyrolysis of a filter paper, and the reduced TiO2−x is prepared by the magnesiothermic reduction of commercial anatase TiO2. The surface areas of the non-carbonized filter paper and carbon papers obtained by carbonization at 400, 600, 800, and 1000 °C are 4.31 m2 g−1, 13.57 m2 g−1, 466.81 m2 g−1, 461.60 m2 g−1, and 26.28 m2 g−1, respectively. Although the as-prepared carbon papers possess much lower specific surface areas than that of commercial activated carbon (2200 m2 g−1), the carbon papers show better adsorption capabilities. The O-deficient reduced TiO2−x samples exhibit strong visible-light absorption, and the reduced TiO2−x-loaded carbon papers induce rapid degradation of CH3CHO and simultaneous generation of CO2 in both closed-circulation and continuous-flow modes under visible light irradiation (λ > 420 nm), attributed to the efficient adsorption of gas-phase CH3CHO by the carbon paper and the rapid and complete degradation of CH3CHO to CO2 by the active reduced TiO2−x. This strongly suggests that the reduced TiO2−x-loaded carbon paper is an efficient composite photocatalyst for the visible light-induced photocatalytic degradation of gas-phase CH3CHO.
1. Introduction
TiO2 photocatalysis has been extensively studied in applications for air and water purification.1–5 Photocatalytic reactions are initiated by the absorption of ultraviolet (UV) photons, which concurrently generate conduction-band (CB) electrons and valence-band (VB) holes in the TiO2 lattice. The VB holes are strong oxidants and react with surface –OH groups to produce ˙OH radicals. The remediation power of TiO2 photocatalysts is largely attributed to the strong oxidation potential of these ˙OH radicals. However, the wide band gap of TiO2 limits the range of solar light wavelengths that can be utilized for catalysis. Several strategies have been investigated to enhance the solar light absorption of TiO2, including metal and non-metal doping,6–8 coupling of low-band gap materials,9,10 and dye sensitization.11,12Many researchers focus on the photooxidation of gas-phase acetaldehyde (CH3CHO), a prevalent volatile organic compound that causes sick-house syndrome.13–15 The complete degradation of gas-phase CH3CHO to CO2 can be achieved with TiO2 or Au-loaded TiO2 under UV irradiation.16,17 Recently, the visible light-induced photocatalytic removal of gas-phase CH3CHO was also investigated using visible light-responsive modified photocatalysts including zeolite/WO3–Pt hybrids,18 Mn4+-doped TiO2,19 and N-doped TiO2.20
For air purification, photocatalysts immobilized on support materials are usually employed. The surface area and activity of the catalyst are often reduced by immobilization. Therefore, support materials with high surface areas are preferred for photocatalyst immobilization. The composite materials generated can show synergetic effects on adsorption and photocatalysis.21 Activated carbon is one such commonly used support material;22–24 it has a high surface area that can enhance adsorption and photocatalytic activity. Previously, we prepared TiO2-embedded carbon nanofibers (CNFs) and core–shell-structured CNF–TiO2 nanotubes for the photocatalytic oxidation of gaseous CH3CHO.25,26 CNF mats prepared by electrospinning and subsequent carbonization did not adsorb gas-phase CH3CHO, but the convenient application of CNF mats suggests that mats with improved adsorption of gas-phase CH3CHO could be widely used.
Recently, O-deficient black or reduced TiO2−x samples have attracted great attention as new photocatalysts for light-induced water splitting towards H2 production.27 The reduction of TiO2 generates many surface defects, Ti3+ species, and O vacancies, which contribute to improved light absorption.28,29 We also investigated a new approach for a defect-induced TiO2−x solar photocatalyst for H2 production from water and CO2 reduction to fuel.30,31 However, the approach has not yet been applied to the degradation of environmental pollutants.
In this study, carbon paper was synthesized by the simple pyrolysis of a filter paper, and O-deficient reduced TiO2−x was prepared by the magnesiothermic reduction of commercial anatase TiO2. Then, Pt-deposited reduced TiO2−x (Pt/rT) nanoparticles were loaded on the as-prepared carbon papers. The physicochemical properties of the Pt@reduced TiO2−x-loaded carbon paper (Pt/rT-FPC) were measured. The adsorption of gas-phase CH3CHO by the filter paper carbon (FPC) or Pt/rT-FPC and the visible light-induced photocatalytic oxidation of adsorbed CH3CHO over the Pt/rT-FPC were investigated.
2. Experimental details
2.1. Preparation of carbon paper from filter paper
Carbon paper was prepared from a filter paper (Hyundai Micro Co., Ltd.). The filter paper was carbonized at 400, 600, 800, or 1000 °C for 2 h under continuous-flow Ar gas. The temperature was increased at the rate of 5 °C min−1. The prepared samples are hereinafter denoted as FPC-x where x indicates the carbonization temperature. For comparison, two different carbon materials of CNFs prepared by a previously reported method32 and commercial activated carbon (MSC, MSC-30, Kansai Coke and Chemicals Co., Ltd, Japan) were also used as substrates.2.2. Synthesis of reduced TiO2−x and preparation of reduced TiO2−x-FPC
O-deficient reduced TiO2−x was synthesized by a magnesiothermic reduction of commercial anatase TiO2 as previously reported.30,31 A 4 g sample of commercial anatase TiO2 (CT, particle size <25 nm, Sigma Aldrich) was mixed with the desired amount of Mg powder. The mixed powder was placed in a tube furnace and heated at 500 °C for 8 h under flowing 5% H2/Ar. After annealing, the Mg-treated sample was stirred in 2.0 M HCl solution for 1 day and then washed with distilled water and ethanol to remove MgO and other Mg impurities. The washed Mg-free reduced TiO2−x samples were dried at 80 °C. Different reduced samples prepared with 0.5 and 0.75 molar ratios of Mg per molar amount of CT are denoted as rT-0.5 and rT-0.75, respectively. For comparison, a commercial photocatalyst of P25 TiO2 (P25, Aeroxide) was also used.Pt/rT photocatalysts were synthesized through the well-documented photodeposition method.33 The reduced TiO2−x photocatalyst (0.5 g L−1) was dispersed in 10 vol% methanol, and a proper amount of x mole chloroplatinic acid hexahydrate solution was added dropwise to this dispersion under vigorous stirring for 30 min. The Pt![[thin space (1/6-em)]](https://www.rsc.org/images/entities/char_2009.gif) :
:![[thin space (1/6-em)]](https://www.rsc.org/images/entities/char_2009.gif) photocatalyst weight ratio was 0.005
photocatalyst weight ratio was 0.005![[thin space (1/6-em)]](https://www.rsc.org/images/entities/char_2009.gif) :
:![[thin space (1/6-em)]](https://www.rsc.org/images/entities/char_2009.gif) 1. The suspension was illuminated with UV light (300 W Xe arc lamp, Newport) through a 10 cm infrared (IR) water filter and a UV cutoff filter (λ > 295 nm) for 30 min. The suspension was filtered using 0.45 μm polytetrafluoroethylene (PTFE) filters (Millipore), washed with methanol solution, and dried at 80 °C in an oven to obtain Pt/rT. The photocatalyst was then loaded on the FPC. A 5 mL suspension of photocatalyst in distilled water was pipetted onto the center of each FPC specimen. After the dispersion of the suspension, the FPC was dried at 80 °C in an oven. The mass of the photocatalyst (Pt/rT-FPC or Pt/rT) in the sample holder was approximately 10 mg for each loading.
1. The suspension was illuminated with UV light (300 W Xe arc lamp, Newport) through a 10 cm infrared (IR) water filter and a UV cutoff filter (λ > 295 nm) for 30 min. The suspension was filtered using 0.45 μm polytetrafluoroethylene (PTFE) filters (Millipore), washed with methanol solution, and dried at 80 °C in an oven to obtain Pt/rT. The photocatalyst was then loaded on the FPC. A 5 mL suspension of photocatalyst in distilled water was pipetted onto the center of each FPC specimen. After the dispersion of the suspension, the FPC was dried at 80 °C in an oven. The mass of the photocatalyst (Pt/rT-FPC or Pt/rT) in the sample holder was approximately 10 mg for each loading.
2.3. Characterizations
Surface morphology images were obtained using a field-emission scanning electron microscope (FE-SEM, Hitachi S4-8020, Japan). Transmission electron micrographs were obtained on a high-resolution transmission electron microscope (HR-TEM, Hitachi HF-3300, Japan). X-ray diffraction (XRD) patterns were obtained with an X-ray diffractometer (Panalytical, Empyrean, 40 kV, 30 mA) using Cu Kα1 radiation (λ = 0.154178 nm) and a quartz monochromator. Raman spectra of the samples were analyzed by a Raman spectrophotometer (Thermo Scientific, Nicolet Almega XR) in the wavenumber range of ∼100 to 4000 cm−1 using a 532 nm laser. The Brunauer–Emmett–Teller (BET) surface areas were determined from the N2 adsorption–desorption isotherms obtained at 77 K (ASAP 2020 Micromeritics). The surface compositions were measured by X-ray photoelectron spectroscopy (XPS, Thermo Scientific, Escalab 250Xi) using the Mg-Kα line (1253.6 eV) as the excitation source. The light absorption was analyzed by UV-visible diffuse reflectance spectroscopy (DRS) using a Cary series spectroscope (Cary 5000, Agilent Technologies).2.4. Visible light-induced gas-phase CH3CHO oxidation
Photocatalytic oxidation experiments were performed by two different methods of closed-circulation mode and continuous-flow mode. In closed-circulation mode, the photocatalytic oxidation of gaseous CH3CHO was determined in a closed circulating stainless steel reactor with a volume of 150 cm3 that could be divided into two parts (upper and lower) by a control valve, similar to the reactor in a previously reported experiment.25 The gases used were CH3CHO (300 ppmv N2) as a CH3CHO standard, O2 (99.9999%), and Ar (99.9999%) as the carrier gas. The concentrations of CH3CHO and O2 were 80 ppmv and 20%, respectively. A sample of reduced TiO2−x-loaded FPC was placed in the lower reactor. Each sample weighed approximately 15 mg. The mixed gas passed through the empty upper reactor, and the concentration of CH3CHO in the exit stream was monitored until it reached a constant value. The gas was then circulated in the reactor by the pump. Next, the circulated gas was passed through the lower reactor by using the valve to make contact with the surface of the sample in the lower reactor. After adsorption equilibrium with the surface of the sample was established in the dark, the sample was illuminated with UV light (150 W Xe arc lamp, Abet Technologies). The distance between the sample and the lamp was 15 cm, and a cut-off filter (λ > 295 nm for UV irradiation or λ > 420 nm for visible irradiation) was used. The removal of CH3CHO was monitored using a gas chromatograph (GC, HP6890, Agilent) equipped with a Porapak Q column, a flame ionization detector (FID), a CO2 methanizer (Ni catalyst), and a gas-sampling valve. In the continuous-flow mode, the photocatalytic oxidation of gaseous CH3CHO was performed in the same 150 cm3 stainless steel reactor without division. The mixed gas was fed to the reactor at the total flow rate of 100 mL min−1. The concentrations of CH3CHO and O2 were 60 ppmv and 20%, respectively. The gas residence time in the reactor was 1.5 min. All other experimental conditions were the same as those in the closed-circulation experiments.3. Results and discussion
3.1. Characterization of FPCs
Fig. 1 shows photographs and SEM images of the filter paper and the FPC-600. The filter paper is obviously transformed to carbon paper, as shown in Fig. 1a and c. The filter paper and the FPC-600 both contain fibers with some degree of variation in diameter. The diameters of the fibers are not strongly affected by the carbonization, but do show slight shrinkage.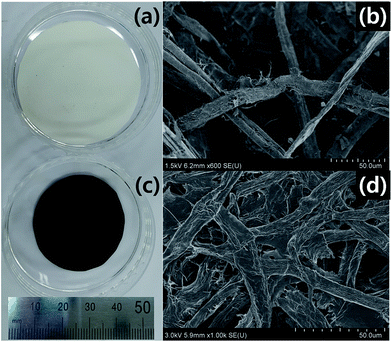 | ||
| Fig. 1 Photographs and SEM images of (a, b) filter paper and (c, d) carbon paper after carbonization at 600 °C (FPC-600). | ||
Fig. 2a shows the XRD patterns of the filter paper, FPC-600, and FPC-800. The filter paper pattern exhibits two major peaks, a weak diffraction peak centered at 15.1° and a strong diffusion diffraction peak centered at 22.5°, which are consistent with previously reported results.34 The FPC patterns each exhibit one broad peak centered at 23°, indicating amorphous carbon.23 The intensities of the diffraction peaks are increased as the temperature of carbonization is increased. Fig. 2b shows the Raman spectra of the filter paper and the FPCs. The FPC spectra show two characteristic peaks centered at 1350 cm−1 and 1580 cm−1 corresponding to the D and G bands, respectively.35 These characteristic peaks become sharper and more intense with increased carbonization temperature. The D and G bands are associated with the vibrations of sp2 carbon atoms with dangling bonds; the integrated intensity ratio (ID/IG) corresponds to the degree of graphitization. The ID/IG ratios for FPC-400, FPC-600, FPC-800, and FPC-1000 are 0.62, 0.65, 0.89, and 0.96, respectively. This implies increasing structural order in the FPC with increasing carbonization temperature, consistent with the results reported for other cellulose materials.36 The XRD patterns and Raman spectra obviously demonstrate that graphitized carbon forms during carbonization, with increasing formation at higher carbonization temperatures.
 | ||
| Fig. 2 (a) XRD patterns and (b) Raman spectra of filter paper and FPCs. (c) Ratio of intensity of D to G peaks in Raman spectra for carbon papers as a function of carbonization temperature. | ||
The N2 adsorption–desorption isotherms of the filter paper and FPCs are shown in Fig. S1.† The BET surface areas of the filter paper, FPC-400, FPC-600, FPC-800, and FPC-1000 were 4.31 m2 g−1, 13.57 m2 g−1, 466.81 m2 g−1, 461.60 m2 g−1, and 26.28 m2 g−1, respectively. The surface areas increase significantly for papers carbonized at temperatures of 400 and 800 °C, and then decrease with the increase of temperature from 800 to 1000 °C. The release of volatile compounds favors the formation of pores, which create the high surface areas of FPC-600 and FPC-800. At 1000 °C, structural ordering and merging of pores decreases the surface area of the FPC.
3.2. Gas-phase CH3CHO adsorption on FPCs
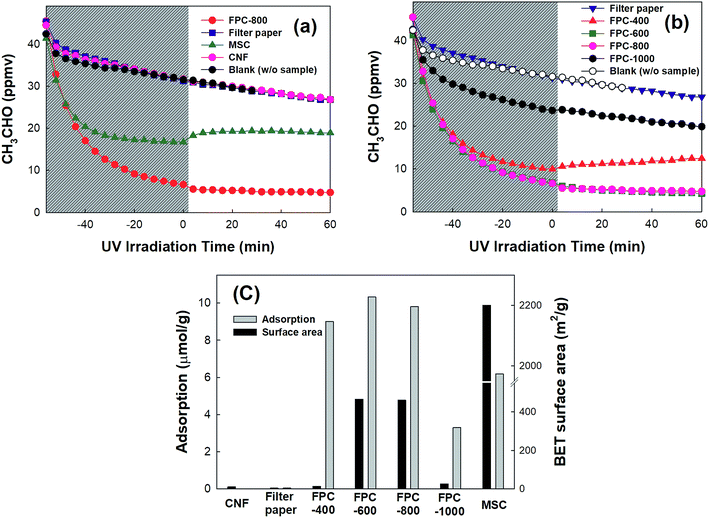
The capability of FPCs to adsorb gaseous CH3CHO was compared with those of commercially available activated carbon (MSC), CNF, and non-carbonized filter paper. Fig. 3a shows that the dark adsorption of gaseous CH3CHO on filter paper and CNF does not occur at all, whereas MSC exhibits strong dark adsorption of CH3CHO. However, FPC-800 shows better CH3CHO adsorption than MSC does. The CH3CHO adsorption may be influenced by the carbonization temperature. Therefore, the carbonization temperature-dependent adsorption of CH3CHO is analyzed as shown in Fig. 3b. The FPCs, except FPC-1000, exhibit strong CH3CHO adsorption. Fig. 3c shows the relationship between the amount of adsorbed CH3CHO and the BET surface area. The dark adsorption capacity of CH3CHO follows the order of FPC-600 > FPC-800 > FPC-400 ≫ MSC ≫ FPC-1000. Although the specific surface areas of FPCs are much lower than that of MSC, the adsorption capacities of FPCs, except that of FPC-1000, exceed that of MSC. The adsorption of CH3CHO on the surfaces of the carbon materials depends on the surface chemistry as well as the microporosity.37 The atomic ratio of O in the FPCs is higher than that in MSC (Fig. S3†). Therefore, enhanced adsorption of CH3CHO appears in FPCs bearing O-containing functional groups. These results were obtained in the closed-circulation system. Similar tendencies were more clearly observed in the continuous-flow system during the photocatalytic oxidation experiments. Additionally, CH3CHO showed no oxidation under UV irradiation on FPCs without photocatalyst.3.3. Visible light-induced activity of reduced TiO2−x
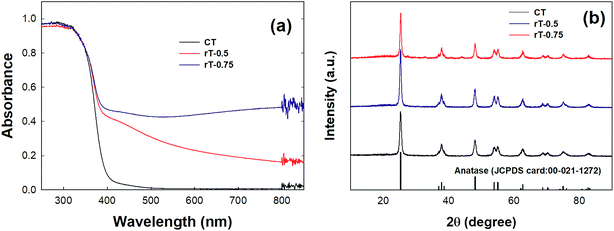
The visible light-induced photocatalytic oxidation of gas-phase CH3CHO was further investigated using Pt/rT-FPC. Previously, reduced TiO2−x exhibited high activity for the visible light-induced production of H2 (ref. 30) and photocatalytic reduction of CO2.31 In Fig. 4a, the reduced TiO2−x samples clearly illustrate extended absorbance in the visible region as well as the UV region compared to that of commercial pristine TiO2, which shows only UV-region absorption. Our previous work revealed that visible light absorption is related to the presence of Ti3+.31 The absorption of light increases as the amount of Mg used in the reduction increases, as observed for rT-0.5 and rT-0.75; this is also reflected in the color change of the samples from white to yellow and gray for pristine TiO2, rT-0.5, and rT-0.75, respectively. The XRD patterns of the different samples are presented in Fig. 4b. Despite the color changes, the reduced samples still show predominantly anatase-phase TiO2. Although the XRD analysis indicates no major structural changes during Mg reduction, the Mg treatment probably induces modifications on the surfaces of the reduced TiO2−x particles, as reflected in the enhanced light absorption and color changes of the reduced samples. The magnesiothermic reduction of TiO2 follows the reaction shown below. The strong reduction powder of Mg causes the pristine TiO2 to lose the framework of O on the surface of the TiO2 particles, generating reduced O-deficient TiO2−x and MgO. The light absorption in the visible region is increased, and the color darkens because of the increased surface modification of the reduced samples with increased amounts of Mg. In the given reaction conditions, this modification occurs only on the surface of the reduced sample; thus, the inner part of the reduced sample has the anatase TiO2 structure, as indicted by the XRD patterns in Fig. 4b.| TiO2 + Mg → TiO2−x + MgO | (1) |
The photocatalytic oxidation of CH3CHO by reduced TiO2−x under visible light was performed in continuous-flow mode. Fig. 5a shows the photocatalytic oxidation of CH3CHO on reduced TiO2−x and P25 TiO2. The dark adsorption capacities on the surfaces of the reduced TiO2−x and P25 TiO2 are much lower than those of reduced TiO2−x immobilized on the FPCs. Under visible irradiation, the concentration of CH3CHO is only slightly reduced and CO2 production is negligible. Under UV irradiation, however, the CH3CHO is degraded and CO2 immediately produced. The concentrations of CH3CHO and CO2 reach steady-state levels after several minutes, indicating that establishing adsorption–desorption equilibrium under UV illumination requires a long time. Meanwhile, the concentration of CO2 on rT-0.75 is higher than that on either P25 or rT-0.5. This implies that the photocatalytic oxidation of CH3CHO is faster on rT-0.75. The CH3CHO degradation and the CO2 production under UV irradiation remain almost identical throughout repeated cycling. However, although the reduced TiO2−x absorbs visible light, the visible light-induced photocatalytic oxidation of CH3CHO occurs on neither rT-0.5 nor rT-0.75. This can be attributed to the rapid recombination of the electron–hole pairs produced under visible irradiation. Therefore, Pt must be photodeposited onto the reduced TiO2−x surface for the efficient separation of the photogenerated electron–hole pairs.
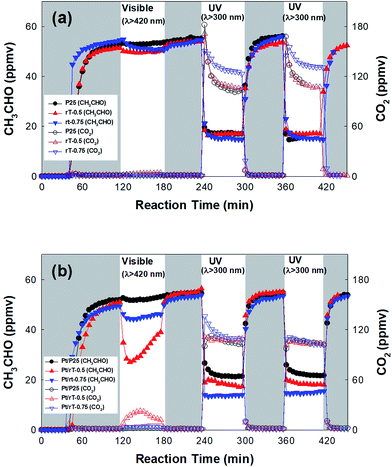 | ||
| Fig. 5 Dark adsorption and photocatalytic oxidation of CH3CHO under visible and UV irradiation on (a) bare photocatalyst and (b) Pt-deposited photocatalyst in continuous-flow mode. | ||
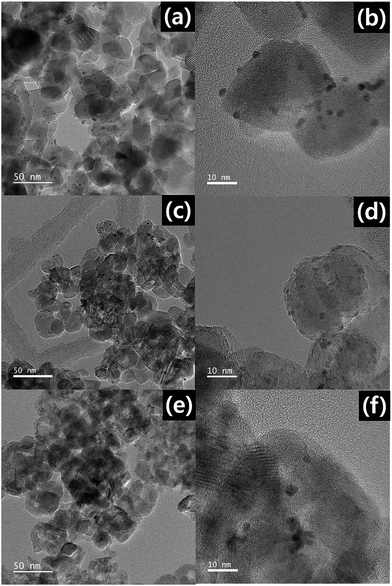
Fig. 6 shows HR-TEM images of Pt/P25, Pt/rT-0.5, and Pt/rT-0.75. In all cases, Pt is deposited similarly. The photocatalytic oxidation of CH3CHO on Pt-deposited P25 and reduced TiO2−x was also investigated. As shown in Fig. 5b, under visible irradiation, the CH3CHO is degraded with simultaneous CO2 production on Pt/rT-0.5. The concentrations of CH3CHO and CO2 do not reach a steady-state level because of the offsets of the adsorption and the photocatalytic oxidation of CH3CHO. This implies that Pt deposition inhibits the recombination of charge carriers created by absorbing visible light and thereby enables visible light-induced CH3CHO degradation. The photocatalytic reaction of CH3CHO oxidation into CO2 can be written as follows:
| Pt/TiO2−x + hν → h+(Pt/TiO2−x) + e−(Pt/TiO2−x) | (2) |
| CH3CHO + 10h+(Pt/TiO2−x) + 3H2O → 2CO2 + 10H+ | (3) |
| 2.5O2 + 10e−(Pt/TiO2−x) + 10H+ → 5H2O | (4) |
| (Total) CH3CHO + 2.5O2 → 2CO2 + 2H2O | (5) |
On Pt/rT-0.75, the CH3CHO is degraded but no CO2 is observed, which could be attributed to the production of some undetected intermediates by the visible light-induced degradation of CH3CHO. Meanwhile on Pt/P25, CH3CHO is not degraded under visible irradiation. The photocatalytic degradation rates of CH3CHO on Pt/P25, Pt/rT-0.5, and Pt/rT-0.75 under UV irradiation are much higher than those under visible irradiation. Compared to the results obtained in the absence of Pt, the photocatalytic activities for CH3CHO degradation under UV irradiation are not significantly enhanced. This implies that UV light-induced charge separation occurs efficiently on P25, rT-0.5, and rT-0.75, so the effect of Pt deposition is not significant. Moreover, the CH3CHO degradation and the CO2 production under UV irradiation remain almost identical throughout repeated cycling, as with the results obtained in the absence of Pt.
3.4. Visible light-induced gas-phase CH3CHO oxidation
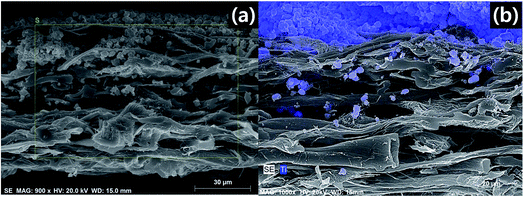
The visible light-induced photocatalytic oxidation of gas-phase CH3CHO using reduced TiO2−x-loaded FPC was investigated. Based on the above results, we investigated visible light-induced gas-phase CH3CHO oxidation using the Pt-deposited photocatalysts and FPC-600. We observed cross-sectional SEM images and analyzed the elemental composition of the Pt/rT-0.5 loaded on the FPC-600 by energy-dispersive X-ray spectroscopy (EDS) mapping, as shown in Fig. 7a and 8b. The Pt/tT-0.5 is well loaded and easily distinguishable on the FPC-600. The amount of Pt/tT-0.5 nanoparticles on the surface of the FPC-600 is indirectly calculated from the thermogravimetric analysis (TGA) results (Fig. S2†). Fig. S2a† shows that the decomposition of Pt/rT-0.5 loaded on FPC-600 begins at approximately 400 °C and stops at 500 °C. The weight loss of Pt/rT-0.5 loaded on the FPC-600 is approximately 47%.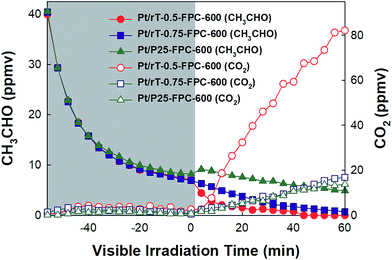 | ||
| Fig. 8 Dark adsorption and photocatalytic oxidation of CH3CHO on the Pt/P25-FPC-600, Pt/rT-0.5-FPC-600, and Pt/rT-0.75-FPC-600 under visible irradiation in closed-circulation mode. | ||
Fig. 8 shows the photocatalytic oxidation of CH3CHO on Pt/rT-0.5, Pt/rT-0.75, and Pt/P25 loaded on FPC-600 in closed-circulation mode. All cases show strong dark adsorption of CH3CHO, similar to the dark adsorption of CH3CHO on the FPC without Pt/rT-0.5, Pt/rT-0.75, or Pt/P25. Upon visible irradiation, the Pt/rT-0.5 loaded on the FPC-600 shows rapid degradation of CH3CHO and simultaneous generation of CO2. The photocatalytic oxidation of CH3CHO on Pt/rT-0.5-FPC-600 is also performed in continuous-flow mode under repeated experiments, as shown in Fig. 9. The photocatalytic oxidation of CH3CHO to CO2 is strongly dependent on the flow rates of 25, 50, and 100 mL min−1, which relate directly to the residence times of 6, 3, and 1.5 min, respectively. For all cases, the concentration of CH3CHO does not reach steady-state levels within 30 min. At the highest flow rate, CO2 production is rapidly saturated and its concentration remains constant under repeated experiments. However, at the lowest flow rate, the concentration of CO2 does not reach a steady-state level but CO2 production from the photocatalytic oxidation of CH3CHO is dramatic, possibly because of the longer residence time. The photocatalytic oxidation of CH3CHO to CO2 was repeated up to six times. The result demonstrates the good stability of Pt/rT-0.5-FPC-600. Investigations to improve the operation conditions are needed for photocatalytic oxidation applications. Even with a small amount of Pt/rT-0.5, the photocatalytic oxidation of CH3CHO under visible irradiation occurs in a few minutes. The FPC-600 efficiently adsorbs the CH3CHO, and Pt/rT-0.5 rapidly and completely degrades the CH3CHO to CO2, even under visible irradiation. It is also possible that some electrons are transferred to the carbon paper, which would promote electron–hole pair separation; this implies that the carbon paper could function as an electron-transfer mediator as well as a support material.32,38 A schematic of the visible light-induced photocatalytic degradation of gas-phase CH3CHO using reduced TiO2−x-loaded FPC is shown in Fig. 10.
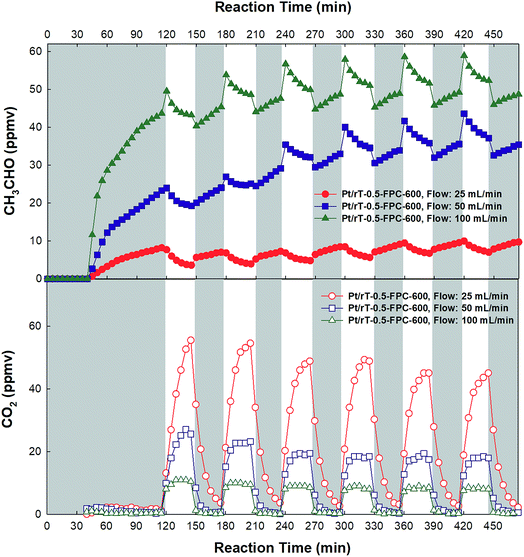 | ||
| Fig. 9 Dark adsorption and photocatalytic oxidation of CH3CHO on the Pt/rT-0.5-FPC-600 under visible irradiation in continuous-flow mode. | ||
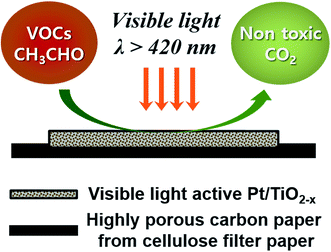 | ||
| Fig. 10 Schematic of the visible light-induced photocatalytic degradation of gas-phase CH3CHO using reduced TiO2−x-loaded carbon paper. | ||
4. Conclusion
In this work, visible light-induced gas-phase CH3CHO degradation on Pt/reduced TiO2−x-loaded FPC was examined for the first time. The FPC was synthesized by the simple pyrolysis of filter paper; its surface area was strongly affected by the carbonization temperature. Although the specific surface areas of the FPCs were much lower than that of commercial MSC, the adsorption rate and capacities of FPCs outperformed those of MSC. The O-deficient reduced TiO2−x prepared by the Mg–H2 reduction of commercial anatase TiO2 showed increased visible light absorption; it was successfully utilized as the active material for visible light-induced photocatalysis. The reduced TiO2-loaded FPC showed rapid degradation of CH3CHO and simultaneous generation of CO2 in both closed-circulation and continuous-flow modes under visible irradiation, clearly demonstrating that the reduced TiO2−x-loaded FPC described in this work is a suitable candidate for the visible light-induced photocatalytic degradation of gas-phase CH3CHO.Conflicts of interest
There are no conflicts of interest to declare.Acknowledgements
This work was supported by the DGIST R&D Program of the Ministry of Science, ICT & Future Planning (17-NT-02 and 17-01-HRLA-01). This work was also supported by Basic Science Research Program, through the National Research Foundation of Korea (NRF), funded by the Ministry of Science, ICT & Future Planning (2017R1A2B4003919).References
- M. R. Hoffmann, S. T. Martin, W. Choi and D. W. Bahnemann, Chem. Rev., 1995, 95, 69–96 CrossRef CAS.
- W. Choi, J. Y. Ko, H. Park and J. S. Chung, Appl. Catal., B, 2001, 31, 209–220 CrossRef CAS.
- S. Kim and W. Choi, Environ. Sci. Technol., 2002, 36, 2019–2025 CrossRef CAS PubMed.
- J. S. Park and W. Choi, Chem. Lett., 2005, 34, 1630–1631 CrossRef CAS.
- J. Ryu and W. Choi, Environ. Sci. Technol., 2008, 42, 294–300 CrossRef CAS PubMed.
- S. Kim, S.-J. Hwang and W. Choi, J. Phys. Chem. B, 2005, 109, 24260–24267 CrossRef CAS PubMed.
- J. W. Zheng, A. Bhattcahrayya, P. Wu, Z. Chen, J. Highfield, Z. Dong and R. Xu, J. Phys. Chem. C, 2010, 114, 7063–7069 CAS.
- S. Na Phattalung, S. Limpijumnong and J. Yu, Appl. Catal., B, 2017, 200, 1–9 CrossRef CAS.
- M. Kim, Y. K. Kim, S. K. Lim, S. Kim and S.-I. In, Appl. Catal., B, 2015, 166, 423–431 CrossRef.
- H. Li, Z. Xia, J. Chen, L. Lei and J. Xing, Appl. Catal., B, 2015, 168, 105–113 Search PubMed.
- S. K. Choi, S. Kim, J. Ryu, S. K. Lim and H. Park, Photochem. Photobiol. Sci., 2012, 11, 1437–1444 CAS.
- P. Chowdhury, H. Gomaa and A. K. Ray, Chemosphere, 2015, 121, 54–61 CrossRef CAS PubMed.
- A. T. Hodgson, D. Beal and J. E. R. McIlvaine, Indoor Air, 2002, 12, 235–242 CrossRef CAS PubMed.
- Y. Odaka, H. Seto, H. Nakaoka, M. Hanazato, E. Todaka and C. Mori, Indoor Built Environ., 2014, 25, 254–261 CrossRef.
- I. Sopyan, M. Watanabe, S. Murasawa, K. Hashimoto and A. Fujishima, J. Photochem. Photobiol., A, 1996, 98, 79–86 CrossRef CAS.
- S. W. Verbruggen, K. Masschaele, E. Moortgat, T. E. Korany, B. Hauchecorne, J. A. Martens and S. Lenaerts, Catal. Sci. Technol., 2012, 2, 2311–2318 CAS.
- T. Nikawa, S.-i. Naya and H. Tada, J. Colloid Interface Sci., 2015, 456, 161–165 CrossRef CAS PubMed.
- I. Jansson, K. Yoshiiri, H. Hori, F. J. García-García, S. Rojas, B. Sánchez, B. Ohtani and S. Suárez, Appl. Catal., A, 2016, 521, 208–219 CrossRef CAS.
- M.-V. Sofianou, M. Tassi, V. Psycharis, N. Boukos, S. Thanos, T. Vaimakis, J. Yu and C. Trapalis, Appl. Catal., B, 2015, 162, 27–33 CrossRef CAS.
- D. Meroni, S. Ardizzone, G. Cappelletti, C. Oliva, M. Ceotto, D. Poelman and H. Poelman, Catal. Today, 2011, 161, 169–174 CrossRef CAS.
- S. Wang, X. Zhang, L. Pan, F.-M. Zhao, J.-J. Zou, T. Zhang and L. Wang, Appl. Catal., B, 2015, 164, 234–240 CrossRef CAS.
- Y. El-Sayed and T. J. Bandosz, Langmuir, 2002, 18, 3213–3218 CrossRef CAS.
- W. Wei, C. Yu, Q. Zhao, X. Qian, G. Li and Y. Wan, Appl. Catal., B, 2014, 146, 151–161 CrossRef CAS.
- E. D. Dimotakis, M. P. Cal, J. Economy, M. J. Rood and S. M. Larson, Environ. Sci. Technol., 1995, 29, 1876–1880 CrossRef CAS PubMed.
- S. Kim and S. K. Lim, Appl. Catal., B, 2008, 84, 16–20 CrossRef CAS.
- S. Kim, M. Kim, Y. K. Kim, S. H. Hwang and S. K. Lim, Appl. Catal., B, 2014, 148, 170–176 CrossRef.
- X. Chen, L. Liu, P. Y. Yu and S. S. Mao, Science, 2011, 331, 746–750 CrossRef CAS PubMed.
- S. Hoang, S. P. Berglund, N. T. Hahn, A. J. Bard and C. B. Mullins, J. Am. Chem. Soc., 2012, 134, 3659–3662 CrossRef CAS PubMed.
- S. Wang, L. Pan, J.-J. Song, W. Mi, J.-J. Zou, L. Wang and X. Zhang, J. Am. Chem. Soc., 2015, 137, 2975–2983 CrossRef CAS PubMed.
- A. Sinhamahapatra, J.-P. Jeon and J.-S. Yu, Energy Environ. Sci., 2015, 8, 3539–3544 CAS.
- A. Razzaq, A. Sinhamahapatra, T.-H. Kang, C. A. Grimes, J.-S. Yu and S.-I. In, Appl. Catal., B, 2017, 215, 28–35 CrossRef CAS.
- Y. K. Kim, S. K. Lim, H. Park, M. R. Hoffmann and S. Kim, Appl. Catal., B, 2016, 196, 216–222 CrossRef CAS.
- S. K. Choi, S. Kim, S. K. Lim and H. Park, J. Phys. Chem. C, 2010, 114, 16475–16480 CAS.
- K. Zhang, Q. Li, L. Zhang, J. Fang, J. Li, F. Qin, Z. Zhang and Y. Lai, Mater. Lett., 2014, 121, 198–201 CrossRef CAS.
- Y. W. Zhu, S. Murali, W. W. Cai, X. S. Li, J. W. Suk, J. R. Potts and R. S. Ruoff, Adv. Mater., 2010, 22, 3907–3924 Search PubMed.
- A. E. Lewandowska, C. Soutis, L. Savage and S. J. Eichhorn, Compos. Sci. Technol., 2015, 116, 50–57 CrossRef CAS.
- Y. El-Sayed and T. J. Bandosz, J. Colloid Interface Sci., 2001, 242, 44–51 CrossRef CAS.
- Y. K. Kim, M. Kim, S. H. Hwang, S. K. Lim, H. Park and S. Kim, Int. J. Hydrogen Energy, 2015, 40, 136–145 CrossRef CAS.
Footnote |
| † Electronic supplementary information (ESI) available: N2 absorption–desorption isotherms and thermal decomposition curves of synthesized materials. See DOI: 10.1039/c7ra10778a |
| This journal is © The Royal Society of Chemistry 2017 |

