 Open Access Article
Creative Commons Attribution 3.0 Unported Licence
Structural investigations of (Mn, Dy) co-doped ZnO nanocrystals using X-ray absorption studies
N. Tiwariab,
S. Kumarc,
A. K. Ghosh d,
S. Chatterjeee,
S. N. Jhaa and
D. Bhattacharyya
 *a
*a
aAtomic & Molecular Physics Division, Bhabha Atomic Research Centre, Mumbai-400 085, India. E-mail: dibyendu@barc.gov.in
bHomi Bhabha National Institute, Anushaktinagar, Mumbai-400 094, India
cHiroshima Synchrotron Radiation Center, Hiroshima University, Kagamiyama 2-313, Higashi-Hiroshima 739-0046, Japan
dMaterials Research Laboratory, Department of Physics, Banaras Hindu University, Varanasi-221 005, India
eDepartment of Physics, Indian Institute of Technology, Banaras Hindu University, Varanasi-221 005, India
First published on 15th December 2017
Abstract
(Mn, Dy)-doped ZnO nanocrystals with Mn-concentrations of 0 and 2% and Dy-concentrations of 0, 0.5%, 1%, 2%, 4% and 6% have been prepared using a sol–gel technique. Preliminary structural characterisations of the samples have been carried out using X-ray diffraction (XRD), Transmission Electron Microscopy (TEM) and Fourier Transformed Infra-red (FTIR) spectroscopy. Changes in the luminescence characteristics of the samples due to rare earth doping have been investigated by Photoluminescence (PL) measurement and its effect on the magnetic properties of the samples has also been studied. The local structure at the host (Zn) and dopant (Mn and Dy) sites of the samples have been thoroughly investigated by synchrotron based X-ray absorption spectroscopy (XAS), which is an element specific microscopic technique comprising both X-ray near edge structure (XANES) and extended X-ray absorption fine structure (EXAFS) measurements and the magnetic properties of the samples have been explained in light of the findings from XANES and EXAFS.
Introduction
In recent years, diluted magnetic semiconductors (DMS) have attracted great interest for their potential technological applications in the field of spintronics and many other spin based devices.1,2 These materials are used in various applications because of their specific catalytic, optical, electrical and magnetic properties.3,4 DMS materials are normally formed through the introduction of transition metal (TM) ions, such as Fe, Ni, Mn, Cr or rare earth (RE) ions like Gd or Dy into a host semiconductor like ZnO. ZnO a transparent conducting oxide, has a direct and wide bandgap5 and is widely used in semiconductor devices like light-emitting diodes6 and photo voltaic cells.7 Considerable efforts were made to study TM ion doped ZnO after the theoretical prediction of room temperature ferromagnetism by Dietl et al. in Mn doped ZnO.8 Later, theoretical demonstration by first-principles electronic structure calculations by Sato and Katayama-Yoshida9 suggested that transition-metal (TM = Ti, V, Cr, Mn, Fe, Co, Ni, Cu) doped ZnO compounds are ferromagnetic provided the carriers produced by TM doping formed a partially filled spin-split impurity band. Transition metal doped ZnO exhibiting ferromagnetism at or above room temperature makes these materials very attractive for use as non-volatile switching elements, LEDs, sensors, electronic and magnetic devices.10In TMs, the magnetization arises from partially filled 3d shells and most of the cases since total orbital magnetic moment is zero, the magnetic moment is only due to the spin component and hence total magnetic moment per atom is less. Thus the ferromagnetism observed in TM doped ZnO samples so far has never been very significant. In rare earth (RE) elements, on the other hand, magnetisation appears due to unfilled 4f orbitals leading to higher magnetic moment per atom, though since 4f electrons only interact through 5d or 6s electrons, they offer weak exchange interaction with other RE ions in contrast to TM elements where 3d electrons directly interact.11–13 In pure form, RE elements exhibit magnetism only at low temperatures and the advantage of rare earth compounds over other magnets is that, these materials are easy to magnetise in one direction and resist magnetisation in the other direction. Recent results for Gd in GaN, indicating high magnetic moments,14 has instigated investigations on ZnO nanocrystals doped with RE metal ions. Rare earth elements doped ZnO nanocrystals are technologically important for industrial applications also in the field of optoelectronics, photo catalysis, fiber amplifier15 etc. Another advantage of doping with RE ions is that these go into ZnO lattice in +3 oxidation state leading to enhancement of carrier density.11 Among various rare earth elements, (Er3+ & Tb3+) doped ZnO have been reported extensively16–19 and doping of ZnO with Dy3+ has also been reported.19,20 Dy3+ ions are also well known for producing visible light by appropriately adjusting yellow and blue emissions21 and these are also used in thermoelectric devices which directly convert waste heat from the surroundings into electricity.22
Magnetic properties of a semiconductor can also be tuned by co-doping, i.e., simultaneous doping with two elements at the host site which can increase the carrier concentration and in turn enhance carrier-mediated room temperature ferromagnetism (RTFM). Jayakumar et al. reported that when Al is co-doped with ZnO:Co system, a systematic increase in ferromagnetic behaviour has been observed.23 Wu et al. reported that addition of Al to the Cu-doped ZnO nanorods increased the carrier concentration, and retained the ferromagnetic properties of the Zn:CuO nanorods.24 Wibowo also reported the presence of RTFM in ZnO:Fe nanoparticles with the additional doping of Cu and Ni.25 Recently, RE-doped DMS materials together with TM dopants have been actively investigated to get benefit of higher magnetic moment of RE ions as well as stronger exchange interaction of the TM ions.26,27 However, the results of co-doping of (Mn, Dy) into ZnO have not been reported yet in the literature.
Though a large volume of work also exists in the literature on room temperature ferromagnetism (RTFM) of doped ZnO systems, however, there are wide variations in the reported papers regarding the origin of RTFM observed in the samples which has been attributed to a variety of intrinsic and extrinsic reasons by various authors. Thus origin of RTFM in doped and co-doped ZnO systems is still a fairly unresolved question and further experimental and theoretical studies are required particularly to explore the local environment around the host and the dopant cations carefully to obtain unambiguous results on the above subject.
In this study we have prepared (Mn, Dy) co-doped ZnO nanocrystals through sol–gel route and characterised them thoroughly by several techniques with an emphasis on synchrotron based Extended X-ray Absorption Fine Structure (EXAFS), which is an element specific technique and can yield important information on local environments of dopants (Mn, Dy) and also host element (Zn) in ZnO nanocrystals and thus in turn can give useful insight into the origin of RTFM in these samples.
Experimental
Preparation of samples
To synthesize (Mn, Dy) doped ZnO nanocrystals with Mn-concentrations of 0 and 2% and Dy-concentrations of 0%, 0.5%, 1%, 2%, 4% and 6%, we follow the sol–gel route. Appropriate proportions of powders of analytical grade metal nitrates Zn(NO3)2·6H2O from Sigma-Aldrich (99.99%), Dy(NO3)3·5H2O from Alfa Aesar (99.99%), and Mn(NO3)2·4H2O from Merck, Germany (99.98%) were thoroughly mixed and dissolved in equimolar solution of ethylene glycol and poly(vinyl alcohol) (PVA) (99+ purity), prepared in double distilled water, while stirring to obtain a homogeneous precursor solution. The obtained solution was slowly heated on a hot plate at 200 °C until a highly viscous gel precursor was obtained. The highly viscous gel was kept at 200 °C in the oven for 12 h for complete drying. After grinding the powder is calcined at 500 °C for 10 h.Characterisation
Structural characterization of (Mn, Dy) doped ZnO nanocrystals was performed by X-ray diffractometer (Model: Miniflex-II, Rigaku, Japan) with Cu Kα radiation (λ = 1.54 Å). TEM, HRTEM and Selected Area Electron Diffraction (SAED) measurements were done with Technai G2 S-Twin (FEI, Netherlands). Fourier transmission infrared (FT-IR) spectra of the samples (as pellets with KBr) were obtained using FT-IR Spectrometer (Spectrum One, Perkin Elmer Instrument, USA) in the range of 400–4000 cm−1 with a resolution of 1 cm−1. The photoluminescence measurements have been carried out using 355 nm radiation from a Nd:YAG laser source (Innolas, Spitlight 600, 7 ns pulse width) and a charge-coupled-device (CCD) camera has been used as the spectral detector. The magnetic (M–H) measurements were done using Superconducting Quantum Interference Device (SQUID) Magnetometer [Magnetic Property Measurement System (MPMS) XL-7, Quantum Design, Inc.].XAS measurements on the samples were carried out at the Energy Scanning EXAFS beamline (BL-8) at the Indus-2 Synchrotron Source (2.5 GeV, 120 mA) at the Raja Ramanna Centre for Advanced Technology (RRCAT), Indore, India.28 The beamline uses a double crystal monochromator (DCM) which works in the photon energy range of 4–25 keV with a resolution of 104 at 10 keV. It uses one meridional cylindrical mirror before the DCM for collimation and another meridional cylindrical mirror after the DCM for vertical focussing and the sagittally bent second crystal of the DCM is used for horizontal focussing of the beam at the sample position. For the present set of samples measurements at Zn K-edge has been carried out in transmission mode while measurements at the dopant Dy L3 and Mn K-edges have been carried out in fluorescence mode.
For measurements in the transmission mode, three ionization chamber detectors are used, the first one for measuring the incident flux (I0) and the second one for measuring the transmitted flux (It), the absorbance of the sample being obtained as  , while a third ionisation chamber is used for measuring the XAS signal of a reference metal foil for calibration of the DCM. The EXAFS spectra of the samples at Zn K-edge were recorded in the energy range 9585–10310 eV in transmission mode. For measurement in fluorescence mode, a Si drift detector placed at 90° to the incident X-ray beam is used for measurements in the fluorescence signal (If) while an ionization chamber detector placed prior to the sample is used to measure the incident X-ray flux (I0), the sample is placed at 45° to the incident X-ray beam and the absorbance of the sample
  is obtained as a function of energy by scanning the monochromator over the specified energy range. The EXAFS spectra of the samples at Mn K-edge were recorded in the energy range of 6470–7250 eV and at Dy L3-edge the measurements have been carried out in the range of 7675–8490 eV.
Results and discussion
X-ray diffraction
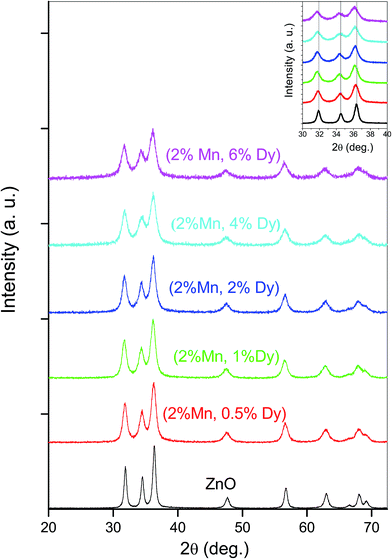
Phase purity of the (Mn, Dy) co-doped ZnO samples has been checked by XRD measurement (Fig. 1) which shows that no secondary phase is present in the samples other than wurtzite hexagonal ZnO phase. Thus incorporation of Dy in ZnO:Mn does not change the structure of wurtzite ZnO. However, it can be seen from the Fig. 1 that there is a shift in the peaks towards lower 2θ values upon Dy doping. Since it has been observed from the XANES studies on the samples at Dy L3-edge, as discussed later, that Dy goes to ZnO lattice as Dy3+, the above shift may be because of expansion of ZnO lattice since the ionic radii of Dy3+ (0.91 Å) is higher than the ionic radii of Zn2+ (0.74 Å), similar results being observed by Khataee et al. also for their Dy doped ZnO nanoparticles.29 The parameters obtained from the analysis of XRD data of the co-doped samples are shown in Table 1.| Parameters | ZnO | (2% Mn, 0.5% Dy) co-doped ZnO | (2% Mn, 1% Dy) co-doped ZnO | (2% Mn, 2% Dy) co-doped ZnO | (2% Mn, 4% Dy) co-doped ZnO | (2% Mn, 6% Dy) co-doped ZnO |
|---|---|---|---|---|---|---|
| Particle size (nm) | 16.5 | 9.8 | 9.6 | 8.9 | 7.7 | 7.4 |
| a (Å) | 3.239 | 3.247 | 3.256 | 3.249 | 3.254 | 3.261 |
| c (Å) | 5.191 | 5.201 | 5.219 | 5.226 | 5.208 | 5.221 |
| d(100) (Å) | 2.805 | 2.811 | 2.820 | 2.813 | 2.818 | 2.824 |
| d(002) (Å) | 2.595 | 2.600 | 2.609 | 2.613 | 2.604 | 2.610 |
| d(101) (Å) | 2.469 | 2.473 | 2.480 | 2.483 | 2.480 | 2.485 |
Transmission electron microscopy
Transmission electron microscopy (TEM) measurements have been carried out to find out the morphology and microstructure of the nanoparticles. Fig. 2(a), (b), (d) and (e) represent the TEM images and SAED patterns of pure ZnO and (2% Mn, 2% Dy) co-doped ZnO nanoparticles which show that the size of nanocrystals are ∼22 nm and 12 nm respectively. The HRTEM micrograph of a representative ZnO and (2% Mn, 2% Dy) co-doped ZnO sample is shown in Fig. 2(c) and (f) which show d-value of 0.272 and 0.284 nm for (100) plane of wurtzite ZnO. Moreover, it should be pointed out here that d-values of the (2% Mn, 2% Dy) co-doped ZnO determined from TEM measurements are found to be higher than that of pristine ZnO, which signifies the presence of tensile strain in the (Mn, Dy) co-doped samples as observed from XRD measurements. The HRTEM pattern also indicates that all the nanoparticles are single crystalline in nature and are free from major lattice defects. Thus according to the results of XRD pattern and HRTEM images, we can say that the Mn and Dy have been well incorporated into the crystal lattice of ZnO.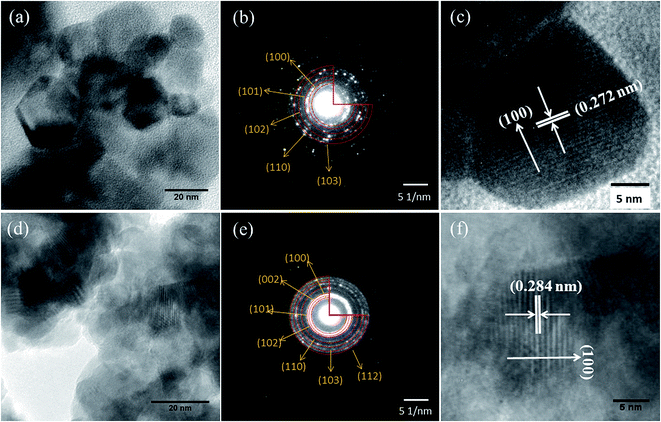 | ||
| Fig. 2 Low magnification TEM (a), SAED (b), and HRTEM (c) images of ZnO nanocrystals and low magnification TEM (d), SAED (e), and HRTEM (f) images of (2% Mn, 2% Dy) co-doped ZnO nanocrystals. | ||
FTIR spectroscopy
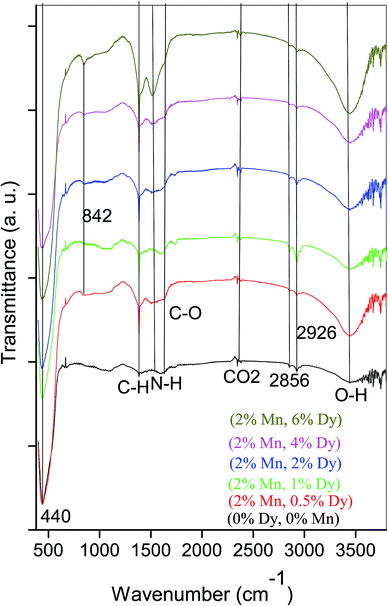
Fig. 3 represents FTIR spectra of undoped and (Mn, Dy) co-doped ZnO NCs capped by PVA. It can be seen from Fig. 3 that all the samples exhibited absorption bands at 3444, 2928, 2856, 2360, 1626, 1534, 1387, 842, 440 cm−1. The peak appeared around 440 cm−1 can be attributed to the Zn–O stretching mode in the ZnO lattice.30 The peak found at around ∼3444 cm−1 can be assigned to the –OH mode while two other peaks observed around 2928 and 2856 cm−1 are due to CO2 molecules present in the air. The absorption peak observed around 1626, 1534 and 1387 cm−1 are due to stretching vibrations of C![[double bond, length as m-dash]](https://www.rsc.org/images/entities/char_e001.gif) H, C
H, C![[double bond, length as m-dash]](https://www.rsc.org/images/entities/char_e001.gif) C and C
C and C![[double bond, length as m-dash]](https://www.rsc.org/images/entities/char_e001.gif) O groups in acetate species which maybe present on the surfaces of the undoped and co-doped (Mn, Dy) ZnO nanoparticles. It is clear from the Fig. 3 that with an increase in Dy concentration, the intensity of the ZnO band decreases which manifests successful incorporation of Dy3+ ions in ZnO lattice and the disorder produced thereof. Similar results have also been obtained by Soni et al. for their Mn doped ZnO nanoparticles prepared by microwave irradiation.31 However, it can be seen from Fig. 3 that in our case there is no significant shift in the Zn–O stretching mode frequency due to Dy incorporation showing that Zn–O bond length does not distort significantly due to Dy incorporation, the result being corroborated from EXAFS measurements as discussed later.
O groups in acetate species which maybe present on the surfaces of the undoped and co-doped (Mn, Dy) ZnO nanoparticles. It is clear from the Fig. 3 that with an increase in Dy concentration, the intensity of the ZnO band decreases which manifests successful incorporation of Dy3+ ions in ZnO lattice and the disorder produced thereof. Similar results have also been obtained by Soni et al. for their Mn doped ZnO nanoparticles prepared by microwave irradiation.31 However, it can be seen from Fig. 3 that in our case there is no significant shift in the Zn–O stretching mode frequency due to Dy incorporation showing that Zn–O bond length does not distort significantly due to Dy incorporation, the result being corroborated from EXAFS measurements as discussed later.
Photo luminescence measurement
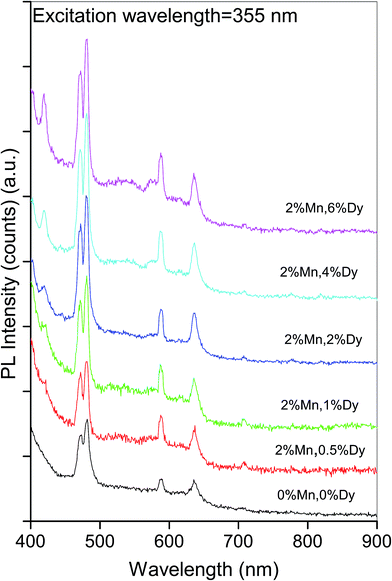
Photo luminescence is an important tool to study the optical properties and structural defects in the semiconductor material. To identify the point defects we have studied the PL spectra at room temperature for (Mn, Dy) co-doped ZnO samples, where the concentration of Mn is kept fixed at 2%, while the concentration of Dy varies from 0.5 to 6%. Fig. 4 shows the room temperature PL spectra of co-doped ZnO samples along with the undoped one recorded between 400 nm to 900 nm range, at the excitation wavelength of 355 nm. It can be seen from the above figure that pure ZnO sample have four emission bands in the visible range centred at 472.1 nm, 481.6 nm, 588.4 nm and 635.6 nm. It can also be found that PL intensity at the above wavelengths increase with the doping of Dy in ZnO:Mn alongwith the appearance of a violet band at 420 nm. The blue emissions at ∼472 and 482 nm are characteristic emissions of some oxides like ZnO, TiO2, SnO2 and are caused by oxygen defects and increase in their intensities manifest increase in these oxygen defects in the samples with increase in Dy doping concentrations. As has been shown by various author32 the luminescence lines in the wavelength range of 420–650 nm obtained from doped and undoped ZnO systems are due to defects related to oxygen vacancies, Zn vacancies, oxygen interstitials and Zn interstitials. In the present samples these defects increase with the increase in Dy doping concentration resulting in the increase of intensities of the above peaks.Thankgeeswari et al. have also observed quenching of UV emission and enhancement of green emission which they have attributed to the creation of oxygen vacancies on Dy doping.13 Wu et al. have observed a PL peak at 575 nm which is due to 4F9/2–6H13/2 transition, characteristic of Dy3+ ions apart from the near band edge transition peak at 384 nm for Dy doped ZnO nanowires.21 Yan et al. on the other hand observed an additional characteristic peak at 482 nm due to 4F9/2–6H15/2 transition in their Dy complex doped ZnO/polyethylene glycol hybrid phosphors.19 We have not observed any of these bands in our samples manifesting that Dy has been successfully incorporated in the ZnO lattice in the samples.
Magnetic measurements
Fig. 5 shows the magnetization (M) vs. applied field (H) curve of the M–H plots of 2% Mn doped and (2% Mn, 2% Dy), (2% Mn, 4% Dy), (2% Mn, 6% Dy) co-doped ZnO samples at room temperatures while that of pure ZnO exhibiting diamagnetic behaviour at room temperature is shown in the inset of the figure. It can be seen that Mn doped and (Mn, Dy) co-doped samples with lower concentration of Dy (2%) exhibit super paramagnetic/weak ferromagnetic behaviour. However as the concentration of Dy is increased, magnetic behaviour changes from weak ferromagnetic/super paramagnetic to ferromagnetic nature. Thangeeswari et al.13 however, contrary to our result have observed a decrease in FM in their (Co, Dy) co-doped ZnO samples with an increase in Dy concentration and have attributed it to anti-ferromagnetic (AFM) interaction among the Dy ions. Subramanian et al.11 and Vijayaprasath et al.12 have also observed decrease in magnetization with an increase in Gd doping concentration in case of Gd doped ZnO samples possibly due to AFM interaction among Gd atoms.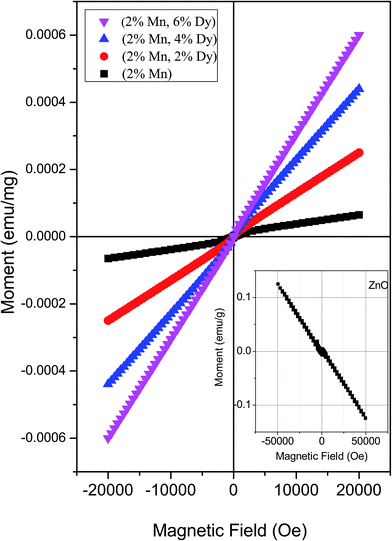 | ||
| Fig. 5 M–H plots for (Mn, Dy) co-doped ZnO nanocrystals. Inset: M–H plot for undoped ZnO nanocrystal. | ||
X-ray absorption spectroscopy
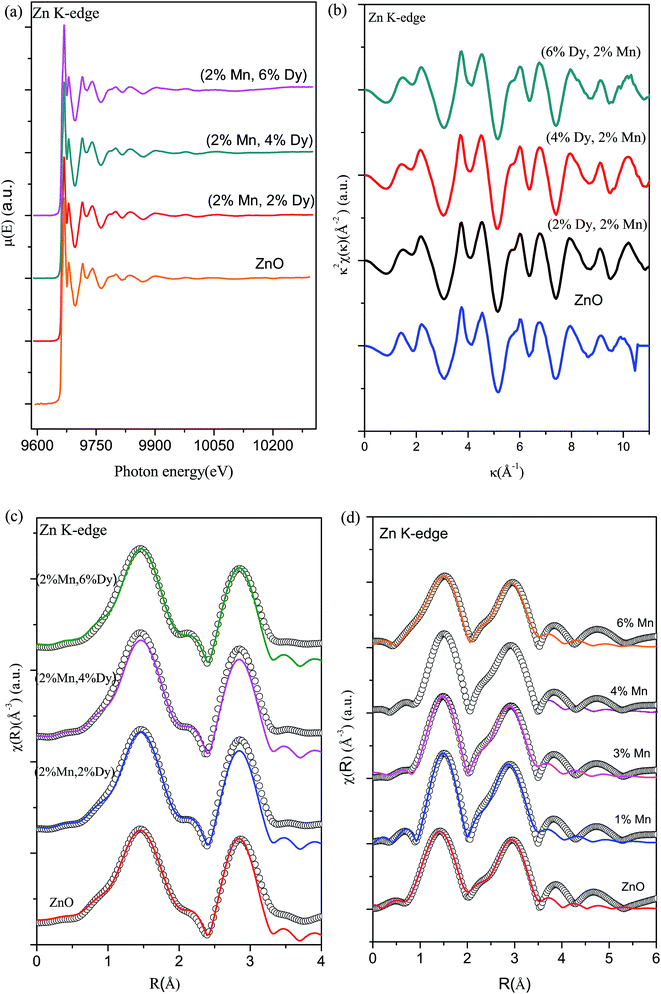
To further investigate the origin of RTFM in the above samples XAS measurement have been carried out on Mn doped and (2% Mn, 2% Dy), (2% Mn, 4% Dy) and (2% Mn, 6% Dy) co-doped samples.Fig. 6(a) represents the experimental EXAFS (μ(E) versus E) spectra of (Mn, Dy) doped ZnO NCs measured at Zn K-edge. A set of EXAFS data analysis program available within the IFEFFIT software package have been used for reduction and fitting of the experimental EXAFS data.33 The ATHENA subroutine of the above software package has been used for converting the (μ(E) versus E) data to (χ(E) versus E) where,34
 | (1) |
 | (2) |
Finally the χ(k) versus k data is Fourier transformed to derive the χ(R) versus R spectra. The ARTEMIS subroutine of the IFEFFIT package has subsequently been used to generate the theoretical EXAFS spectra from an assumed crystallographic structure and to fit the experimental data with the theoretical spectra using the FEFF 6.0 code. The bond distances (R), co-ordination numbers (including scattering amplitudes) (N) and disorder (Debye–Waller) factors (σ2), which give the mean-square fluctuations in the distances, have been used as fitting parameters. The goodness of the fit in the above process is generally expressed by the Rfactor which is defined as:
 | (3) |
Fig. 6(b) shows the k2 χ(k) versus k plots for the samples derived from the experimental EXAFS spectra and Fig. 6(c) shows the Fourier transformed EXAFS (FT-EXAFS) χ(R) versus R spectra of (2% Mn, 2% Dy), (2% Mn, 4% Dy) & (2% Mn, 6% Dy) doped ZnO samples at the Zn K-edge along with the best fit theoretical spectra, k range of 3–11 Å−1 being used for the Fourier transform. The first and second major peaks in the radial distribution functions of the undoped and co-doped ZnO samples correspond to the nearest oxygen and the Zn/Mn/Dy shells respectively from the central Zn atom. The data have been fitted between 1–3.5 Å in R space where the theoretical spectra have been generated assuming the model described by Kisi et al.35 having the first oxygen shell (Zn–O1) at 1.97 Å with coordination number (N) of 4 and the second Zn shell (Zn–Zn) at 3.27 Å with N of 12. The best fit parameters have been shown in Table 2. For comparison in Fig. 6(d) we have also plotted the Fourier transformed EXAFS (FT-EXAFS) χ(R) versus R spectra along with the best fit theoretical spectra for only Mn doped ZnO samples and the best fit parameters have been shown in Table 3 from where it can be seen that the results are similar for both Mn doped and (Mn, Dy) co-doped samples. Thus it has been observed that Dy doping has not caused any additional changes around Zn sites.
| ZnO | (2% Mn, 2% Dy) co-doped ZnO | (2% Mn, 4% Dy) co-doped ZnO | (2% Mn, 6% Dy) co-doped ZnO | ||
|---|---|---|---|---|---|
| Zn–O | N(4) | 3.86 ± 0.84 | 3.86 ± 0.84 | 3.86 ± 0.84 | 3.86 ± 0.84 |
| R (Å) | 1.94 ± 0.02 | 1.93 ± 0.03 | 1.95 ± 0.02 | 1.94 ± 0.01 | |
| σ2 | 0.005 ± 0.002 | 0.004 ± 0.002 | 0.003 ± 0.001 | 0.004 ± 0.002 | |
| Zn–Zn | N(12) | 12.48 ± 1.68 | 12.48 ± 1.68 | 12.48 ± 1.68 | 12.48 ± 1.68 |
| R (Å) | 3.20 ± 0.01 | 3.21 ± 0.01 | 3.20 ± 0.01 | 3.21 ± 0.01 | |
| σ2 | 0.009 ± 0.001 | 0.01 ± 0.001 | 0.008 ± 0.001 | 0.011 ± 0.001 | |
| Rfactor | 0.02 | 0.014 | 0.02 | 0.011 | |
| ZnO | 1% Mn doped ZnO | 3% Mn doped ZnO | 4% Mn doped ZnO | 6% Mn doped ZnO | ||
|---|---|---|---|---|---|---|
| Zn–O | N(4) | 4.24 ± 0.43 | 4.17 ± 0.56 | 4.17 ± 0.56 | 4.12 ± 0.64 | 4.08 ± 0.65 |
| R (Å) | 1.91 ± 0.01 | 1.94 ± 0.03 | 1.94 ± 0.03 | 1.94 ± 0.03 | 1.94 ± 0.03 | |
| σ2 | 0.008 ± 0.001 | 0.008 ± 0.001 | 0.008 ± 0.001 | 0.009 ± 0.006 | 0.009 ± 0.002 | |
| Zn–Zn | N(6) | 5.16 ± 0.47 | 5.06 ± 0.61 | 5.06 ± 0.61 | 5.04 ± 0.61 | 4.32 ± 0.34 |
| R (Å) | 3.08 ± 0.01 | 3.08 ± 0.02 | 3.08 ± 0.02 | 3.08 ± 0.02 | 3.07 ± 0.01 | |
| σ2 | 0.003 ± 0.001 | 0.003 ± 0.001 | 0.003 ± 0.001 | 0.003 ± 0.001 | 0.001 ± 0.001 | |
| Zn–O | N(1) | 1 | 1 | 1 | 1 | 1 |
| R (Å) | 3.61 ± 0.06 | 3.62 ± 0.034 | 3.60 ± 0.08 | 3.62 ± 0.034 | 3.62 ± 0.034 | |
| σ2 | 0.003 ± 0.001 | 0.003 ± 0.001 | 0.003 ± 0.001 | 0.003 ± 0.001 | 0.003 ± 0.001 | |
| Zn–Zn | N(6) | 7.8 ± 0.24 | 7.62 ± 0.64 | 7.62 ± 0.64 | 7.62 ± 0.64 | 7.62 ± 0.64 |
| R (Å) | 3.25 ± 0.003 | 3.26 ± 0.004 | 3.26 ± 0.005 | 3.26 ± 0.004 | 3.27 ± 0.004 | |
| σ2 | 0.003 ± 0.001 | 0.001 ± 0.001 | 0.002 ± 0.001 | 0.002 ± 0.001 | 0.002 ± 0.001 | |
| Rfactor | 0.0009 | 0.0002 | 0.0007 | 0.0004 | 0.0004 | |
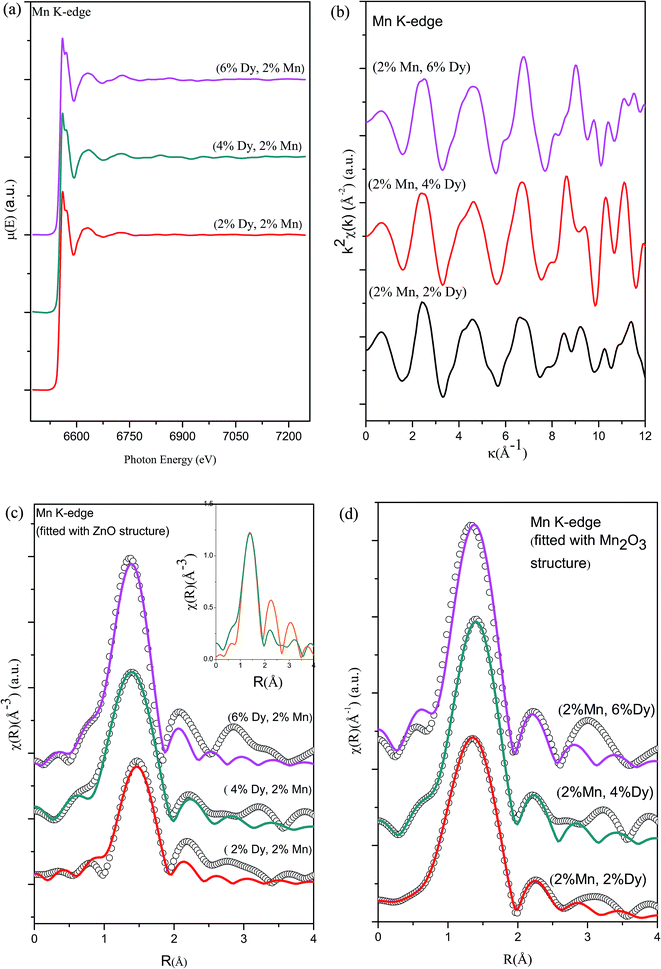
Fig. 7(a) shows the experimental EXAFS (μ(E) versus E) spectra of (Mn, Dy) co-doped ZnO NCs at Mn K-edge while Fig. 7(b) shows the k2-weighed χ(k) versus k plots of the samples derived from the experimental EXAFS spectra. At the Mn K-edge we have explored two possibilities of theoretical modelling to fit the experimental data: (a) starting with the basic wurtzite ZnO structure and replacing the central Zn atom with Mn and (b) taking the initial model to be of cubic Mn2O3. Such an approach to modelling has been reported by other authors as well.36 For the second case, structural parameters of Mn2O3 has been taken from ICSD database36 and data has been fitted by assuming the first nearest oxygen at 1.89 Å with N of 4 and second nearest oxygen shell at 2.24 Å with N of 2.
Fig. 7(c) and (d) show the FT-EXAFS spectra or χ(R) versus R plots of (2% Mn, 2% Dy), (2% Mn, 4% Dy) and (2% Mn, 6% Dy) co-doped ZnO samples at the Mn K-edge, along with the best fit theoretical spectra, where the fittings have been carried out by using (i) wurtzite ZnO structure (where Zn atoms are replaced by Mn atoms according to the doping concentration) and (ii) cubic Mn2O3 structure respectively and the best fit parameters have been given in Tables 4 and 5. It should be noted here that in the theoretical model, which is generated by assuming Mn2O3 structure, the first Mn–Mn path occurs at 3.1 Å, but in FT-spectra of Mn-K edge, no significant peak occurs corresponding to this Mn–Mn path. For comparison the χ(R) versus R plots of the 2% Mn doped and (2% Mn, 2% Dy) doped ZnO nanocrystals measured at Mn K-edge have been plotted in the inset of Fig. 7(c), which shows very broad and reduced Mn–Mn peak in case of the later compared to the former sample, manifesting that Dy doping introduces some distortion in and around Mn sites in the lattice. Thus during fitting of the data for (Mn, Dy) co-doped samples only the contribution of nearest oxygen shells have been taken. It has been observed that the parameters obtained by the later approach viz., assuming Mn2O3 structure yields more reasonable results as shown in Table 5 and it is also reflected in the better quality of fitting obtained in Fig. 7(d) compared to in Fig. 7(c). The above results indicate that Mn is going to ZnO lattice as Mn3+.
| (2% Mn, 2% Dy) co-doped ZnO | (2% Mn, 4% Dy) co-doped ZnO | (2% Mn, 6% Dy) co-doped ZnO | ||
|---|---|---|---|---|
| Mn–O1 | N(4) | 1.468 ± 0.08 | 2.76 ± 0.23 | 2.95 ± 0.22 |
| R (Å) | 1.94 ± 0.01 | 1.9 ± 0.01 | 1.89 ± 0.01 | |
| σ2 | 0.001 ± 0.001 | 0.002 ± 0.001 | 0.002 ± 0.001 | |
| Rfactor | 0.01 | 0.007 | 0.013 | |
| (2% Mn, 2% Dy) co-doped ZnO | (2% Mn, 4% Dy) co-doped ZnO | (2% Mn, 6% Dy) co-doped ZnO | ||
|---|---|---|---|---|
| Mn–O1 | N(4) | 4.0 ± 0.39 | 4.0 ± 0.39 | 4 ± 0.39 |
| R (Å) (1.89) | 1.92 ± 0.01 | 1.92 ± 0.01 | 1.9 ± 0.01 | |
| σ2 | 0.0086 ± 0.001 | 0.005 ± 0.003 | 0.005 ± 0.001 | |
| Mn–O2 | N(2) | 1.57 ± 0.38 | 1.57 ± 0.38 | 1.57 ± 0.38 |
| R (Å) (2.24) | 2.26 ± 0.03 | 2.29 ± 0.01 | 2.26 ± 0.04 | |
| σ2 | 0.01 ± 0.01 | 0.005 ± 0.003 | 0.007 ± 0.006 | |
| Rfactor | 0.0008 | 0.001 | 0.001 | |
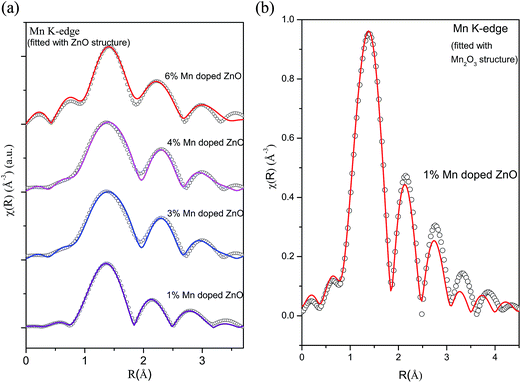
For comparison, Fig. 8(a) shows the experimental FT-EXAFS data of the Mn doped samples at the Mn K-edge along with the best fit theoretical plot where the fitting has been carried out assuming Mn at Zn sites in tetrahedral ZnO structure and Fig. 8(b) shows the corresponding plot for the 1% Mn doped sample where fitting has been carried out using Mn2O3 structure at the Mn sites. The best fit parameters of the above two cases have been shown in Tables 6 and 7. It is clear from the above figures and tables that the fitting quality of the data with the second theoretical model is poor and it yeilds unreasonable results of very low coordination in the oxygen and Mn shells. Hence we can conclude that in case of Mn doped ZnO samples the EXAFS data is best fitted with the model of Mn replacing Zn atoms in ZnO lattice.
| 1% Mn doped ZnO | 3% Mn doped ZnO | 4% Mn doped ZnO | 6% Mn doped ZnO | ||
|---|---|---|---|---|---|
| Mn–O | N(4) | 3.12 ± 0.76 | 2.53 ± 0.44 | 2.59 ± 2.82 | 2.56 ± 0.52 |
| R (1.97 Å) | 1.95 ± 0.04 | 1.95 ± 0.01 | 1.96 ± 0.04 | 1.95 ± 0.02 | |
| σ2 | 0.026 ± 0.034 | 0.01 ± 0.001 | 0.01 ± 0.002 | 0.01 ± 0.004 | |
| Mn–Mn | N(6) | 5.2 ± 1.08 | 5.1 ± 0.22 | 4.98 ± 0.33 | 4.95 ± 0.30 |
| R (3.20 Å) | 2.99 ± 0.03 | 2.99 ± 0.01 | 2.98 ± 0.042 | 2.97 ± 0.01 | |
| σ2 | 0.023 ± 0.003 | 0.012 ± 0.001 | 0.015 ± 0.001 | 0.008 ± 0.001 | |
| Mn–Mn | N(6) | 5.98 ± 1.24 | 5.95 ± 0.38 | 5.4 ± 0.81 | 5.52 ± 0.21 |
| R (3.25 Å) | 3.30 ± 0.02 | 3.31 ± 0.01 | 3.30 ± 0.01 | 3.25 ± 0.01 | |
| σ2 | 0.021 ± 0.002 | 0.023 ± 0.001 | 0.023 ± 0.001 | 0.012 ± 0.001 | |
| Rfactor | 0.0046 | 0.0001 | 0.001 | 0.003 | |
| 1% Mn doped ZnO | ||
|---|---|---|
| Mn–O | N(2) | 0.24 ± 0.26 |
| R (1.89 Å) | 2.29 ± 0.10 | |
| σ2 | 0.03 ± 0.10 | |
| Mn–O | N(2) | 3.82 ± 0.04 |
| R (1.98 Å) | 2.01 ± 0.09 | |
| σ2 | 0.015 ± 0.02 | |
| Mn–O | N(2) | 0.024 ± 0.001 |
| R (2.24 Å) | 2.47 ± 0.01 | |
| σ2 | 0.04 ± 0.001 | |
| Mn–Mn | N(10) | 1.6 ± 0.47 |
| R (3.10 Å) | 3.28 ± 0.029 | |
| σ2 | 0.026 ± 0.005 | |
| Rfactor | 0.0002 | |
Thus the above EXAFS measurements on the Mn doped and (Mn, Dy) co-doped samples show two striking similarities, viz., in case of Mn doped samples, the Mn–Mn peak at 3.1 Å is present in the FT-EXAFS spectra, while in (Mn, Dy) co-doped samples it is significantly reduced due to the disorder introduced by Dy atoms. Secondly, in Mn doped samples Mn is going to the ZnO lattice as Mn2+ while in case of (Mn, Dy) co-doped samples, Mn is going into the lattice in Mn3+ oxidation state. Fig. 9 shows the XANES spectra of the (Mn, Dy) co-doped ZnO samples alongwith that of standard MnO2 and Mn2O3 commercial powder and Mn metallic foil. It shows that the Mn absorption edge positions of the samples lie just above that of Mn2O3 showing that Mn goes into the samples as Mn3+. However it is evident from the above figure that the post edge features (shown with arrows in the figure) of Mn2O3 do not exactly match with that of the samples. This manifests that though Mn goes into the ZnO lattice in the co-doped samples as Mn3+, however it does not exist as separate Mn2O3 phase in the sample manifesting proper Mn doping at Zn sites in the samples.
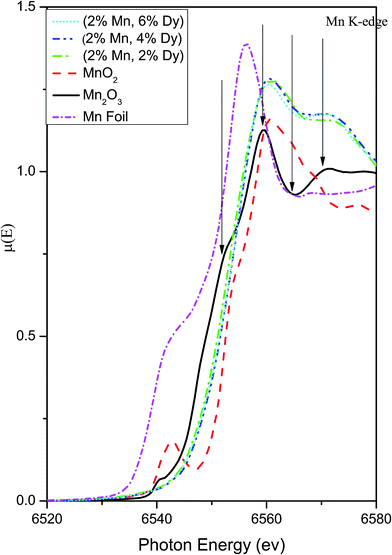 | ||
| Fig. 9 XANES plots for (Mn, Dy) co-doped ZnO samples at Mn K-edge alongwith that of standard MnO2, Mn2O3 powders and Mn foil. | ||
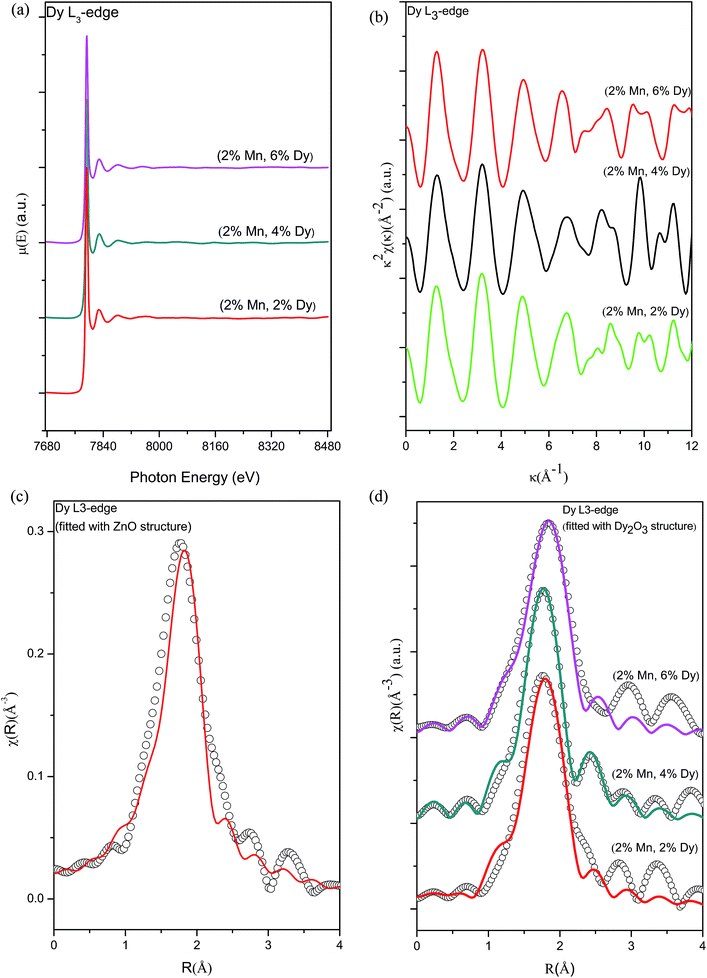
Fig. 10(a) shows the experimental EXAFS (μ(E) versus E) spectra of (Mn, Dy) co-doped ZnO nanocrystals while Fig. 10(b) shows χ(k) versus k plots for the samples derived from the experimental EXAFS spectra. In this case also to fit the experimental FT-EXAFS data at the Dy L3-edge two possibilities were examined viz., (a) Dy at Zn sites in tetrahedral ZnO structure and (b) Dy2O3 structure at the Dy sites.
Fig. 10(c) shows the FT-EXAFS spectra or χ(R) versus R plots of (2% Mn, 4% Dy) co-doped ZnO nanocrystals at the Dy L3-edge along with the best fit theoretical plots where the fitting has been carried out assuming wurtzite ZnO structure with Zn atoms replaced by Dy atoms according to doping concentration. The theoretical FT-EXAFS spectra have been generated assuming the wurtzite ZnO structure where Zn is replaced by Dy with the first oxygen shell (Dy–O) at 1.97 Å with coordination number (N) of 4. It has been observed that the fitting quality of the data with this theoretical model is poor and it yields unreasonable results of higher bond distance (2.31 Å) as compared to its theoretical value.
Fig. 10(d) shows the FT-EXAFS χ(R) versus R plots of (Dy, Mn) co-doped ZnO nanocrystals at the Dy L3-edge along with the best fit theoretical plot where the fitting has been carried out by assuming the 2nd option viz., Dy2O3 structure at the Dy sites and the best fit parameters have been shown in Table 8. In this case, structural parameters of Dy2O3 has been taken from ICSD database.37 Initially fitting has been carried out assuming the two nearest oxygen shells (Dy–O1) at 2.24 Å with coordination number of 2 & (Dy–O2) at 2.35 Å with coordination number of 4 respectively. From the fitting results it has been found that for all the co-doped ZnO samples both oxygens shells are almost at the same distance of 2.25 Å and 2.26 Å from the central atom Dy. Hence during fitting we have combined the contributions of both oxygen shells at 2.24 Å with coordination number of 6 and fitting has been carried out by assuming this single shell of oxygen. It can be seen from Fig. 10(d) and Table 8 that fitting with this structure has yielded better results with reasonable values of the fitting parameters.
| (2% Mn, 2% Dy) co-doped ZnO | (2% Mn, 4%Dy) co-doped ZnO | (2% Mn, 6% Dy) co-doped ZnO | ||
|---|---|---|---|---|
| Dy–O1 | N(6) | 4.92 ± 0.24 | 4.92 ± 0.34 | 4.72 ± 0.018 |
| R (Å) | 2.24 ± 0.005 | 2.28 ± 0.007 | 2.30 ± 0.003 | |
| σ2 | 0.006 ± 0.001 | 0.006 ± 0.001 | 0.006 ± 0.007 | |
| Rfactor | 0.009 | 0.015 | 0.003 | |
Fig. 11 shows the Dy L3 edge XANES spectra of the (Mn, Dy) co-doped ZnO samples alongwith that of standard Dy2O3 commercial powder. It shows that the Dy L3 absorption edge positions of the co-doped samples agree with that of Dy2O3 powder. However the post edge features (like the peak at 7810 eV) of Dy2O3 is not exactly matching with that of the co-doped samples showing that though Dy goes as Dy3+ in the ZnO lattice, it is not present as a separate Dy2O3 phase manifesting successful doping Dy in the ZnO lattice.
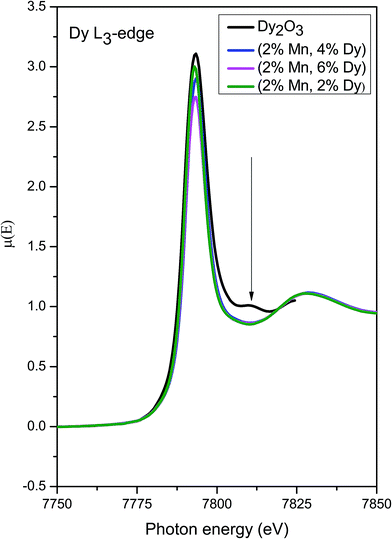 | ||
| Fig. 11 XANES plots for (Mn, Dy) co-doped ZnO samples at Dy L3 edge alongwith that of standard Dy2O3 powder. | ||
However, it can be seen from Table 8 that significant oxygen vacancies are present near Dy sites since oxygen coordination is less than that expected which is corroborated by PL measurements also discussed above. Creation of oxygen vacancy at Dy sites takes place possibly to compensate for the charge neutrality at Zn2+ sites occupied by Dy3+ ions. Thus the FM observed in the Dy doped samples can be attributed to the oxygen vacancy mediated exchange interaction between the Dy3+ ions or in other words due to the formation of bound magnetic polarons or BMP's. Thangeeswari et al. have also attributed the FM observed in their (Co, Dy) co-doped nanoparticles to bound magnetic polarons 13Oxygen vacancies have been considered to be responsible for FM observed in several RE doped CeO2 systems also.38 Oxygen vacancy mediated FM has been observed by us in several other doped TM doped ZnO samples also viz., in Fe doped and Cr doped ZnO nanocrystals and Mn doped ZnO thin film samples.39–41
Conclusion
Sol gel derived (Mn, Dy) doped ZnO nanocrystals with Mn-concentrations of 0 and 2% and Dy-concentrations of 0.5%, 1%, 2%, 4% and 6% have been subjected to various complementary characterisation techniques. XRD measurements show that incorporation of Dy in Mn doped ZnO does not change the structure of wurtzite ZnO though there is slight expansion of ZnO lattice to accommodate relatively larger Dy3+ (0.91 Å) ions which is also confirmed by HRTEM measurement. TEM measurements show (100) oriented wurtzite structure and ∼22 nm and 12 nm sizes respectively for the undoped and co-doped nanocrystals. FTIR study also corroborates the above results that upon rare earth doping ZnO lattice is not distorted significantly. PL measurements however indicate creation of oxygen vacancies on Dy doping. Magnetic measurement shows that as doping concentration of Dy is increased, magnetic behaviour changes from weak ferromagnetic/super paramagnetic to ferromagnetic nature. EXAFS data analysis at Zn K-edge shows that the results are similar for both Mn doped and (Mn, Dy) co-doped samples corroborating the above results that Dy doping has not caused any additional changes around Zn sites. However, EXAFS results at Mn K-edge on the Mn doped and (Mn, Dy) co-doped samples show two striking dissimilarities, viz., in case of co-doped samples, the second shell Mn–Mn peak is significantly reduced due to the disorder introduced by doping of Dy atoms and in only Mn doped samples Mn is going to the ZnO lattice is Mn2+ oxidation state while in case of (Mn, Dy) co-doped samples, Mn is going into the lattice in Mn3+ oxidation state. Dy L3-edge results also show that Dy is going to the ZnO lattice as Dy3+ and significant oxygen vacancies are created near Dy sites to compensate for the charge neutrality at Zn2+ sites, a result also corroborated by PL measurements. Thus, the FM observed in the Dy doped samples can be attributed to the oxygen vacancy mediated exchange interaction between the Dy3+ ions or in other words due to formation of bound magnetic polarons or BMP's. It has also been noted from the XANES measurements of the samples at Mn K-edge and Dy L3 edge alongwith that of standard oxide samples that though Mn and Dy go into ZnO lattice as Mn3+ and Dy3+, no separate Mn2O3 or Dy2O3 phase exists in the samples.Conflicts of interest
There are no conflicts to declare.Acknowledgements
SK is thankful to SERB-India for providing overseas postdoctoral fellowship (OPDF Award No. SB/OS/PDF-060/2015-16), to Prof. K. Shimada (Host Professor, HiSOR, Japan), to the Bio-Physics Lab, Dept. of Physics for PL facility and to central instrument facility, IIT-BHU Varanasi for magnetic measurement (SQUID).References
- S. A. Wolf, D. D. Awschalom, R. A. Buhrman, J. M. Daughton, S. V. Molnar, M. L. Roukes, A. Y. Chtchelkanova and D. M. Treger, Science, 2001, 294, 1488–1495 CrossRef CAS PubMed.
- Y. Ohno, D. K. Young, B. Beschoten, F. Matsukura, H. Ohno and D. D. Awschalom, Nature, 1999, 402, 790–795 CrossRef CAS.
- R. N. Nickolov, B. V. Donkova, K. I. Milenova and D. R. Mehandjiev, Adsorpt. Sci. Technol., 2006, 24, 497–505 CrossRef CAS.
- P. K. Khanna, S. Gaikwad, P. V. Adhyapak, N. Singh and R. Marimuthu, Mater. Lett., 2007, 61, 4711–4714 CrossRef CAS.
- U. Ozgur, Y. I. Alivov, C. Liu, A. Teke, S. Dogan, M. Reshchikov, V. Avrutin, S. J. Cho and H. Morkoc, J. Appl. Phys., 2005, 98, 041301 CrossRef.
- Z. Zang, X. Zeng, J. du, M. Wang and X. Tang, Opt. Lett., 2016, 41, 3463 CrossRef PubMed.
- Z. Zang, A. Nakamura and J. Temmyo, Opt. Express, 2013, 21, 11448 CrossRef CAS PubMed.
- T. Dietl, H. Ohno, F. Matsukura, J. Cibert, D. Ferrand and D. Zener, Science, 2000, 287, 1019 CrossRef CAS PubMed.
- K. Sato and H. Katayama-Yoshida, Phys. E, 2001, 10, 251 CrossRef CAS.
- S. J. Peartn and D. P. Norton, IEEE Trans. Electron Devices, 2007, 54, 1040–1048 CrossRef.
- M. Subramanian, P. Thakur, M. Tanemura, T. Hihara, V. Ganesan, T. Soga, K. H. Chae, R. Jayavel and T. Jimbo, J. Appl. Phys., 2010, 108, 053904 CrossRef.
- G. Vijayaprasath, R. Murugan, Y. Hayakawa and G. Ravi, J. Lumin., 2016, 178, 375 CrossRef CAS.
- T. Thangeeswari, P. Murugasen and J. Velmurugan, J. Supercond. Novel Magn., 2015, 28, 2505 CrossRef CAS.
- S. Dhar, O. Brandt, M. Ramsteiner, V. F. Sapega and K. H. Ploog, Phys. Rev. Lett., 2005, 94, 037205 CrossRef CAS PubMed.
- M. Kohls, T. Schmidt, H. Katschorek, L. Spanhel, G. Muller, N. Mais, A. Wolf and A. Forchel, Adv. Mater., 1999, 11, 288 CrossRef.
- M. Kohls, M. Bonanni and L. Spanhel, Appl. Phys. Lett., 2002, 81, 3858 CrossRef CAS.
- X. Wang, G. Kong, G. Y. Shan, Y. Yu, Y. J. Sun, L. Y. Feng, K. F. Chao, S. Z. Lv and Y. J. Li, J. Phys. Chem. B, 2004, 108, 18408 CrossRef CAS.
- T. Monteiro, M. J. Soares, A. Neves, S. Pereira, M. R. Correia, M. Peres, E. Alves, D. Rogers, F. Teherani, V. Munoz-SanJose, T. Trindade and A. Pereira, J. Non-Cryst. Solids, 2006, 352, 1453 CrossRef CAS.
- B. Yan, X. Chen and J. H. Wu, Appl. Surf. Sci., 2007, 253, 8575 CrossRef CAS.
- S. Ji, L. Yin, G. Liu, Y. Zhang and C. Ye, J. Phys. Chem. C, 2009, 113, 16439–16444 CAS.
- G. S. Wu, Y. L. Zhuang, Z. Q. Lin, X. Y. Yuan, T. Xie and L. D. Zhang, Phys. E, 2006, 31, 5 CrossRef CAS.
- K. Ark, H. K. Hwang, J. W. Seo and W. S. Seo, Energy, 2013, 54, 139 CrossRef.
- O. D. Jayakumar, S. N. Achary, C. Sudakar, R. Naik, H. G. Salunke, R. Rao, X. Peng, R. Ahuja and A. K. Tyagi, Nanoscale, 2010, 2, 1505 RSC.
- Z. F. Wu, K. Cheng, F. Zhang, R. F. Guan, X. M. Wu and L. J. Zhuge, J. Alloys Compd., 2014, 615, 521 CrossRef CAS.
- J. A. Wibowo, N. F. Djaja and R. Saleh, Adv. Mater. Phys. Chem., 2013, 3, 48 CrossRef.
- M. H. N. Assadi, Y. B. Zhang, P. Photongkam and S. Lib, J. Appl. Phys., 2011, 109, 013909 CrossRef.
- H. Huang, Y. Ou, S. Xu, G. Fang, M. Li and X. Z. Zhao, Appl. Surf. Sci., 2008, 254, 2013–2016 CrossRef CAS.
- S. Basu, C. Nayak, A. K. Yadav, A. Agrawal, A. K. Poswal, D. Bhattacharyya, S. N. Jha and N. K. Sahoo, J. Phys.: Conf. Ser., 2014, 493, 012032 CrossRef.
- A. Khataee, R. D. C. Soltani, Y. Hanifehpour, M. Safarpour, H. G. Ranjbar and S. W. Joo, Ind. Eng. Chem. Res., 2014, 53, 1924 CrossRef CAS.
- J. Singh, P. Kumar, K. S. Hui, K. N. Hui, K. Ramam, R. S. Tiwari and O. N. Srivastava, CrystEngComm, 2012, 14, 5898 RSC.
- B. H. Soni, M. P. Deshpande, S. Bhatt, N. Garg, N. N. Pandya and S. H. Chaki, J. Opt., 2013, 42, 328 CrossRef.
- G. Amira, B. Chaker and E. Habib, Spectrochim. Acta, Part A, 2017, 177, 164 CrossRef CAS PubMed.
- M. Newville, B. Ravel, D. Haskel, J. J. Rehr, E. A. Stern and Y. Yacoby, Phys. B, 1995, 154, 1208 Search PubMed.
- D. C. Konigsberger and R. Prince, X-ray absorption: principles, applications, techniques of EXAFS, SEXAFS, and XANES, Wiley, New York, 1988 Search PubMed.
- E. H. Kisi and M. M. Elcombe, Acta Crystallogr., Sect. C: Cryst. Struct. Commun., 1989, 45, 1867 CrossRef.
- S. Basu, D. Y. Inamdar, S. Mahamuni, A. Chakrabarti, C. Kamal, G. Ravi Kumar, S. N. Jha and D. Bhattacharyya, J. Phys. Chem. C, 2014, 118, 9154 CAS.
- https://icsd.fiz-karlsruhe.de.
- M. C. Dimri, H. Khanduri, H. Kooskora, J. Subbi, I. Heinmaa, A. Mere, J. Krustok and R. Stern, Phys. Status Solidi A, 2012, 209, 353 CrossRef CAS.
- S. Kumar, N. Tiwari, S. N. Jha, S. Chatterjee, D. Bhattacharyya, N. K. Sahoo and A. K. Ghosh, RSC Adv., 2015, 5, 94658 RSC.
- S. Kumar, N. Tiwari, S. N. Jha, S. Chatterjee, D. Bhattacharyya, N. K. Sahoo and A. K. Ghosh, RSC Adv., 2016, 6, 107816 RSC.
- A. K. Yadav, S. Maidul Haque, D. Shukla, R. J. Choudhary, S. N. Jha and D. Bhattacharyya, AIP Adv., 2015, 5, 117138 CrossRef.
| This journal is © The Royal Society of Chemistry 2017 |

