 Open Access Article
Insights into the ligand effects of rhodium catalysts toward reductive carbonylation of methanol to ethanol†
Yingzan Chen ,
Dianhua Liu
 * and
Yi Yu
State Key Laboratory of Chemical Engineering, East China University of Science and Technology, Shanghai 200237, China. E-mail: dhliu@ecust.edu.cn; Fax: +86-21-6425-2151; Tel: +86-21-6425-2151
First published on 26th October 2017
Abstract
Methanol reductive carbonylation to ethanol catalyzed by diphosphine ligand modified Rh-based catalysts has been studied. All the catalysts show ligand effects toward the turnover frequency and selectivity. Four Rh–diphosphine complexes were isolated and single crystals were obtained. These complexes were characterized by X-ray single-crystal diffraction, NMR, FTIR, and XPS. The X-ray crystal structure of [Rh2(μ-I)(μ-CO)(CO)2(dppm)2]+ was reported for the first time in this work. Based on the analysis of crystal structures, we unraveled the origin of the ligand effects of rhodium catalysts toward reductive carbonylation of methanol to ethanol. The diphosphine ligand with the appropriate number of methylene groups between two phosphorus atoms can improve the catalytic activity. The steric congestion around the empty coordination site in the Rh–diphosphine complexes led to a preferential reaction of rhodium with H2, which promoted ethanol/acetaldehyde formation.
1. Introduction
Development of ethanol-fuel blends has recently attracted burgeoning interest from both academia and industry, because of the improvement of the fuel combustion efficiency1,2 and thus the reduction of the particulate generation and CO emission.3,4 Traditionally, ethanol is mainly produced by ethylene hydration and biomass (mainly sugar cane and maize) fermentation.5 However, energy efficiency, political uncertainty, and social issues have directed the research efforts into the development of alternative feedstocks/routes for its production.In recent years, there has been growing interest in the development of alternative syngas-based routes for the production of ethanol. Compared to the direct route (i.e., direct conversion of syngas),6,7 the indirect routes including reductive carbonylation of methanol intermediate,8,9 hydrogenation of dimethyl oxalate10,11 or acetic acid/acetate12,13 intermediates generally exhibit higher yield and selectivity to ethanol. In particular, the reductive carbonylation of methanol to ethanol is more attractive owing to the fewer steps involved.
For the reductive carbonylation of methanol to ethanol, although Co-based catalysts appeared to be active (more comments shown in Table S1†),14–18 the harsh reaction conditions (e.g., >25 MPa) hindered its commercialization in large-scale. Interestingly, several studies showed that Rh–Ru catalysts gave rise to a higher low-pressure (10–12 MPa) activity.19,20 Subsequently, Moloy et al. found that the addition of diphosphine ligands endowed the Rh–Ru catalysts with the apparently improved selectivity to ethanol/acetaldehyde even under much milder conditions (e.g., 6.9 MPa and 130–140 °C).9,21,22 Furthermore, they revealed that the Rh catalyst was responsible for reductive carbonylation of methanol to ethanol, while ruthenium catalyst was for hydrogenation of acetaldehyde to ethanol (Fig. S1†).21,23 However, the relationship between the ligand type and the catalytic performance has been still unclear.
Herein, the Rh-based catalysts modified with Ph2P(CH2)nPPh2 (n = 1–4) ligands were tested for reductive carbonylation of methanol to ethanol under relatively mild conditions (130 °C and 6.0 MPa). Four Rh–diphosphine complexes were isolated and recrystallized to obtain the corresponding single crystals for X-ray single-crystal diffraction, NMR (nuclear magnetic resonance), FTIR (Fourier transform infrared spectroscopy) and XPS (X-ray photoelectron spectroscopy) measurements. The ligand effects were investigated based on the catalytic performances and the characterizations of the complexes.
2. Experimental
2.1. Chemicals
Dicarbonyl(2,4-pentanedionato)rhodium(I) (Rh(CO)2(acac) 99%) and ruthenium(III) chloride hydrate (RuCl3·xH2O Ru > 37%) were purchased from Sino-platinum Metals Co CHN. Bis(diphenylphosphino)methane (dppm 99%), 1,2-bis(diphenyl phosphino)ethane (dppe 99%), 1,3-bis(diphenylphosphino)propane (dppp 99%), 1,4-bis(diphenylphosphino)butane (dppb 99%) was purchased from Puyang Huicheng Electronic Material Co CHN. Methanol (CH3OH 99.5%) and methyl iodide (MeI 98%) were purchased from Sinopharm Chemical Reagent Co CHN. Carbon monoxide (CO 99.99%) was purchased from Foshan Huate Gas Co CHN and hydrogen (H2 99.99%) was purchased from Baosteel Gases Co CHN. All of reagents were used without further purification.2.2. Synthesis of Rh–diphosphine complexes and preparation of single crystals
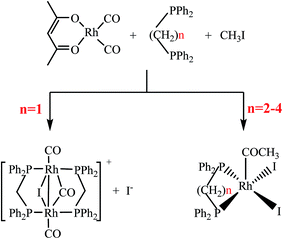
The Rh–diphosphine complexes were synthesized via the reaction of rhodium precursor with methyl iodide and diphosphine ligands in methanol solvent according to the synthetic pathways (Scheme 1), where four types of Ph2P(CH2)nPPh2 (n = 1–4) ligands were used and abbreviated as dppm, dppe, dppp, and dppb, respectively.Rh(CO)2(acac) (1.16 mmol), the bisphosphine ligand (2.32 mmol), methyl iodide (40 mmol), RuCl3·xH2O (5.8 mmol) and methanol (3.71 mol) were added into a 500 ml titanium alloy magnetically stirred autoclave. The reactor was sealed and purged three times with CO of 1 MPa. Then the autoclave was heated to 100 °C with agitation (350 rpm), and was maintained 1 h for Rh–diphosphine complexes synthesis. After the autoclave was cooled to room temperature, the pressure vented carefully and the crystal clusters were formed in the reaction solution. The single crystals were prepared through recrystallization by slowly cooling saturated methanol solutions of crystal clusters in CO atmosphere.
2.3. Characterization
The single crystals obtained above were characterized by XPS, IR, NMR and X-ray crystallography. XPS measurements were performed on a VG ESCALAB 250Xi (Thermo Fisher Scientific, UK) electron spectrometer equipped with Al Kα X-ray source. The analyzer was operated in a constant pass energy mode, and operated at 10 mA and 12 kV. All the spectra measurement were corrected by setting the reference binding energy of carbon (1s) at 284.8 eV. The spectra were analyzed and processed using Thermo Avantage v5.903 software (Thermo Fisher Scientific). The peaks were fitted using Lorentzian–Gaussian product function. IR spectra were recorded using a Thermo Nicolet 6700 FT-IR system. All solids were analysed as KBr disks. NMR spectra were recorded on Bruker Advance III instruments using tetramethylsilane as internal standard. X-ray crystallography data were collected at 130–133 K on a Bruker Smart APEX II CCD diffractometer.2.4. General procedures
In a typical procedure, after Rh–diphosphine complexes synthesis reaction mentioned above, the autoclave was heated to the 130 °C with agitation (350 rpm) and then syngas was charged to 6.0 MPa with the H2/CO ratio of 2.0. The reaction was monitored by gas uptake. After each 0.5 MPa drop, the reactor was repressurized to 6.0 MPa with syngas. After 12 h, the autoclave was cooled to room temperature, the pressure was vented carefully and the liquid mixture was collected.2.5. Analytical methods
The liquid products were analyzed using a gas chromatograph (Agilent 7890A) equipped with an HP-5 column (30 m × 0.32 mm × 0.25 μm). A flame ionization detector (FID) operation at 150 °C was utilized for analyzing liquid product with nitrogen as carrier gas. The column oven temperature was maintained at 40 °C for 3 min, then increased to 90 °C at a rate of 5 °C min−1, and held for 3 min. The products were qualitatively analyzed by GC/MS using the above analytical methods, and quantified using acetonitrile as the internal standard.The turnover frequency (TOF) is defined as a number of moles of consumed methanol per mol of introduced rhodium per hour:
 | (1) |
The selectivity to ethanol/acetaldehyde is calculated in the usual way,9,21 as seen in eqn (2).
 | (2) |
The MeOEt, Et2O, EtOH, EtOAc, MeOAc, AcOH, and MeC(MeO)2H represented, respectively, ethyl methyl ether, diethyl ether, ethanol, ethyl acetate, methyl acetate, acetic acid, and 1,1-dimethoxyethane.
3. Results and discussion
3.1. X-ray photoelectron spectroscopy
Fig. 1 shows the Rh 3d XPS spectra of Rh–dppm complex, Rh–dppe complex, Rh–dppp complex and Rh–dppb complex, respectively. It was observed that the Rh 3d XPS spectrum of Rh–dppm complex (Fig. 1a) consisted of two major peaks at 313.0 and 308.2 eV, corresponding to Rh 3d3/2 and Rh 3d5/2 binding energies, respectively, being indicative of the sole presence of Rh1+ in the complex.24,25 In contrast, the chemical states of Rh in Rh–dppe complex, Rh–dppp complex, and Rh–dppb complex existed as Rh3+,25–27 associated with the Rh 3d5/2 XPS signals at ca. 309.0–309.2 eV, respectively (Fig. 1b–d). Moreover, there was a shoulder peak appearing around 307.5 eV in these three complexes (Fig. 1b–d), indicating that a part of the rhodium complexes underwent reductive elimination to form Rh1+ species during the XPS analysis process.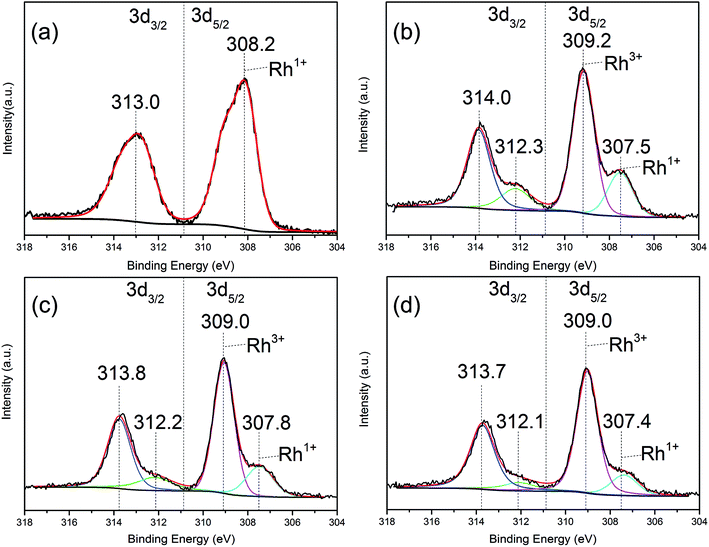 | ||
| Fig. 1 XPS spectra of various Rh–diphosphine complex (a) Rh–dppm complex, (b) Rh–dppe complex, (c) Rh–dppp complex, (d) Rh–dppb complex. | ||
3.2. FTIR spectroscopy
Fig. 2 depicts FTIR spectra of the four Rh–diphosphine complexes. Obviously, the Rh–dppm complex exhibits two characteristic absorption bands of the terminal and bridging carbonyl groups. In contrast, the other three complexes presented similar characteristic absorption bands around 1700 cm−1, which is attributed to the acetyl carbonyl group. The result indicates that there is an acetyl carbonyl group in the Rh–dppe complex, Rh–dppp complex and Rh–dppp complex, respectively.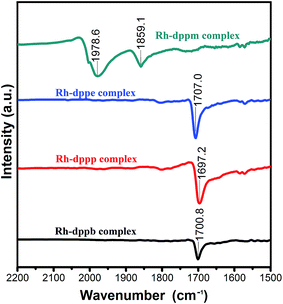 | ||
| Fig. 2 FTIR spectra of Rh–dppm complex, Rh–dppe complex, Rh–dppp complex and Rh–dppb complex for ν(CO) regions. | ||
3.3. X-ray single-crystal diffraction
The four complexes were characterized by single-crystal X-ray crystallography. The molecular structures of these complexes were obtained, which were [Rh2(μ-I)(μ-CO)(CO)2(dppm)2]+, [Rh(COCH3)I2(dppe)], [Rh(COCH3)I2(dppp)] and [Rh(COCH3)I2(dppb)], respectively. Through searching the structure in the Cambridge Structural Database (CSD), it was found that the [Rh2(μ-I)(μ-CO)(CO)2(dppm)2]+ was a new cation and firstly reported in this work, whereas the other three rhodium acetyl complexes had been reported previously.23,28–30 Fig. 3 shows the ORTEP (Oak Ridge Thermal Ellipsoid Plots) structure of [Rh2(μ-I)(μ-CO)(CO)2(dppm)2]+ with thermal ellipsoids drawn at the 50% probability level. The important bond lengths and angles were provided in Table 1. The other three structures of complexes are shown in Fig. 4 with selected bond lengths and angles in Table 2. All of the crystallographic data are listed in Table S2.†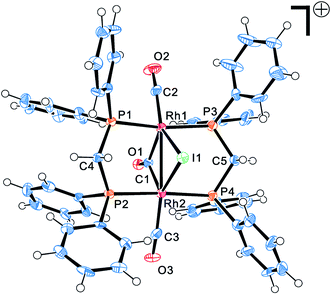 | ||
| Fig. 3 Molecular structures of Rh–dppm complex. Thermal ellipsoids are drawn at the 50% probability level. | ||
| Rh–dppm complex | |||
|---|---|---|---|
| Rh1–I1 | 2.8317(7) | Rh2–I1 | 2.8116(7) |
| Rh1–P1 | 2.3391(19) | Rh2–P2 | 2.3513(19) |
| Rh1–P3 | 2.330(2) | Rh2–P4 | 2.3444(19) |
| Rh1–C1 | 2.075(7) | Rh2–C1 | 2.025(7) |
| Rh1–C2 | 1.822(7) | Rh2–C3 | 1.850(8) |
| Rh1–Rh2 | 2.8207(8) | O1–C1 | 1.169(8) |
| O2–C2 | 1.158(8) | O3–C3 | 1.157(8) |
| P1–P2 | 3.047(7) | P3–P4 | 3.046(3) |
| P3–Rh1–Rh2 | 93.19(5) | P1–Rh1–Rh2 | 94.12(5) |
| P3–Rh1–P1 | 169.12(7) | P4–Rh2–P2 | 175.88(6) |
| P4–Rh2–Rh1 | 92.32(5) | P2–Rh2–Rh1 | 91.30(5) |
| C5–P3–Rh1 | 113.5(2) | C4–P2–Rh2 | 113.1(2) |
| C5–P4–Rh2 | 113.0(2) | C4–P1–Rh1 | 112.4(2) |
| P3–C5–P4 | 112.8(4) | P2–C4–P1 | 112.8(3) |
| C1–Rh1–I1 | 105.46(18) | C1–Rh2–I1 | 107.6(2) |
| Rh2–I1–Rh1 | 59.977(18) | Rh2–C1–Rh1 | 86.9(3) |
| C2–Rh1–I1 | 143.2(3) | C3–Rh2–I1 | 138.9(2) |
| C2–Rh1–C1 | 111.3(3) | C3–Rh2–C1 | 113.5(3) |
| C2–Rh1–P3 | 86.8(2) | C3–Rh2–P4 | 87.9(2) |
| C2–Rh1–P1 | 89.6(2) | C3–Rh2–P2 | 89.3(2) |
| O2–C2–Rh1 | 172.8(7) | O3–C3–Rh2 | 172.5(6) |
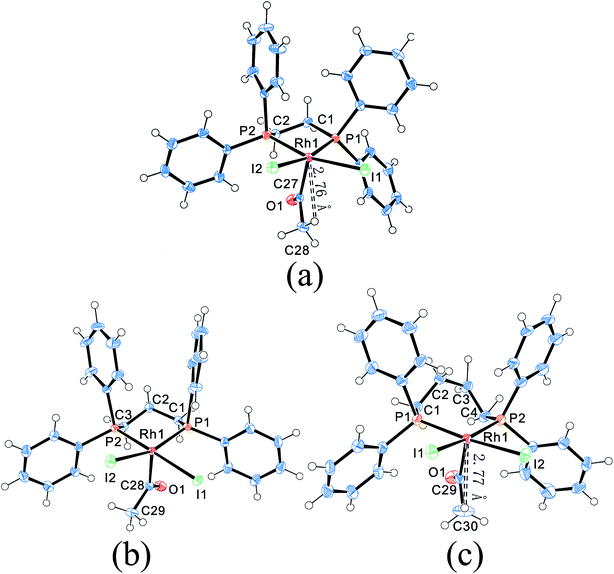 | ||
| Fig. 4 Molecular structures of Rh–dppe complex (a), Rh–dppp complex (b) and Rh–dppb complex (c). Thermal ellipsoids are drawn at the 50% probability level. | ||
| Rh–dppe complex | Rh–dppp complex | Rh–dppb complex | |||
|---|---|---|---|---|---|
| Rh1–I1 | 2.6956(5) | Rh1–I1 | 2.6763(3) | Rh1–I2 | 2.6907(6) |
| Rh1–I2 | 2.6998(5) | Rh1–I2 | 2.7228(3) | Rh1–I1 | 2.7024(7) |
| Rh1–P1 | 2.2781(11) | Rh1–P1 | 2.2743(6) | Rh1–P1 | 2.3094(16) |
| Rh1–P2 | 2.2547(11) | Rh1–P2 | 2.2927(6) | Rh1–P2 | 2.3126(17) |
| Rh1–C27 | 1.981(4) | Rh1–C28 | 1.982(3) | Rh1–C29 | 1.979(6) |
| O1–C27 | 1.200(5) | O1–C28 | 1.192(3) | O1–C29 | 1.187(8) |
| C27–C28 | 1.504(5) | C28–C29 | 1.511(3) | C29–C30 | 1.487(9) |
| P1–P2 | 3.051(2) | P1–P2 | 3.244(9) | P1–P2 | 3.539(4) |
| C27–Rh1–P1 | 92.68(13) | C28–Rh1–P1 | 94.81(7) | C29–Rh1–P1 | 87.62(18) |
| C27–Rh1–P2 | 91.17(12) | C28–Rh1–P2 | 89.29(7) | C29–Rh1–P2 | 88.17(19) |
| C27–Rh1–I1 | 103.19(12) | C28–Rh1–I1 | 90.41(7) | C29–Rh1–I1 | 105.06(19) |
| C27–Rh1–I2 | 99.09(12) | C28–Rh1–I2 | 108.43(7) | C29–Rh1–I2 | 102.07(18) |
| P2–Rh1–P1 | 84.63(4) | P1–Rh1–P2 | 90.54(2) | P1–Rh1–P2 | 99.90(6) |
| P1–Rh1–I1 | 90.56(3) | P1–Rh1–I1 | 90.185(16) | P1–Rh1–I1 | 85.87(4) |
| P1–Rh1–I2 | 167.13(3) | P1–Rh1–I2 | 156.753(18) | P1–Rh1–I2 | 169.12(5) |
| P2–Rh1–I1 | 165.07(3) | P2–Rh1–I1 | 179.240(18) | P2–Rh1–I1 | 165.86(5) |
| P2–Rh1–I2 | 89.93(3) | P2–Rh1–I2 | 90.243(16) | P2–Rh1–I2 | 85.51(4) |
| I1–Rh1–I2 | 91.776(15) | I1–Rh1–I2 | 89.189(7) | I2–Rh1–I1 | 86.81(2) |
| C28–C27–Rh1 | 112.3(3) | C29–C28–Rh1 | 112.56(17) | C30–C29–Rh1 | 113.6(5) |
| C28–H⋯Rh1 | 88.67(5) | C29–H⋯Rh1 | 75.74(6) | C30–H⋯Rh1 | 88.63(2) |
| O1–C27–C28 | 122.1(4) | O1–C28–C29 | 122.5(2) | O1–C29–C30 | 121.5(6) |
| O1–C27–Rh1 | 125.6(3) | O1–C28–Rh1 | 124.95(19) | O1–C29–Rh1 | 124.9(5) |
As shown in Fig. 3, the [Rh2(μ-I)(μ-CO)(CO)2(dppm)2]+ possesses an “A-frame” structure. In this cation, a bridging iodide ligand, a bridging carbonyl ligand, two bridging trans dppm ligand and a terminal carbonyl ligand are bonded to each rhodium atom. Moreover, the Rh–Rh distance of 2.82 Å is indicative of the presence of a single bond between the two rhodium atoms. The structure of [Rh2(μ-I)(μ-CO)(CO)2(dppm)2]+ is similar to that of rhodium cations reported previously,31,32 but the synthetic route and preparation method significantly differ from those cations.
Compared to the “A-frame” structure of [Rh2(μ-I)(μ-CO)(CO)2(dppm)2]+, the complexes [Rh(COCH3)I2(dppe)], [Rh(COCH3)I2(dppp)] and [Rh(COCH3)I2(dppb)] possess distorted square-based pyramidal geometries. Although the crystal structures of these rhodium acetyl complexes had been reported previously,23,28–30 the bond lengths and bond angles in the reported X-ray diffraction data were distinctly different from each other. As an example, the comparison of the selected bond lengths and bond angles for [Rh(COCH3)I2(dppp)] was shown in Table S3.† It was found that the bond lengths of each Rh–I and Rh–P in Panthi's work30 were almost same, but were dramatically different in Moloy's work.23
Inspection of the single crystal preparation conditions and the X-ray diffraction data collection process, we noticed that Panthi prepared the single crystal in methylene chloride solvent and collected the X-ray diffraction data in 110 K. While, Moloy prepared it in methanol and collected the data in 295 K. This observation indicated that the different solvent and the X-ray diffraction data collection temperature influence both bond lengths and bond angles of the crystal structures. To minimize the deviation caused by solvent and data collection temperature on the following structure analysis, all of the single crystals mentioned below were prepared in methanol and the X-ray diffraction date were collected at 130–133 K.
Moreover, it was found that the shortest distance between Rh and H of acetyl group were 2.76 Å and 2.77 Å in Rh–dppe complex and Rh–dppb complex, suggestive of a bonding interaction between Rh and acetyl hydrogen (Fig. 4a and c). Previous agostic interactions between acetyl and metal center were always accompanied by significant angular distortions of the M–C(O)–C bond angles.33 The Rh–C(O)–C angles in Rh–dppe complex and Rh–dppb complex didn't show significant distortions, so these bonding interactions were attributed to pseudo-agostic interaction.34
Previous studies demonstrated that [Rh(COCH3)I2(dppp)] was a key intermediate in methanol reductive carbonylation, and the reaction of [Rh(COCH3)I2(dppp)] with CO or H2 determined both reaction rate and product selectivity21,23,29 (Fig. S1†). Inspection of the structure indicates that [Rh(COCH3)I2(dppe)] and [Rh(COCH3)I2(dppb)] are analogues to [Rh(COCH3)I2(dppp)], which implies that these two complexes are also the intermediates in methanol reductive carbonylation process. Moreover, because the complex [Rh(COCH3)I2(dppm)] (Fig. S2†) was synthesized through the reaction of [Rh2(COCH3)2(CO)2I6]2− with dppm,35 it should exist in the catalytic cycle although it was not obtained in our study. Compared with the five-membered ring cation [Rh2(μ-I)(μ-CO)(CO)2(dppm)2]+, the stability of the four-membered ring complex [Rh(COCH3)I2(dppm)] is seen to be weaker. Additionally, the complex [Rh(COCH3)I2(dppm)] can further react with CO and forming [Rh2(μ-I)(μ-CO)(CO)2(dppm)2]+ under the reaction condition, which may be the reason why the complex [Rh(COCH3)I2(dppm)] can't be obtained in our reaction system. Thus, as same as the other three [Rh(COCH3)I2(diphosphine)] complexes, the complex [Rh(COCH3)I2(dppm)] was also an intermediate in the reaction cycle. Therefore, the inherent nature of the four [Rh(COCH3)I2(diphosphine)] complexes may play a key role in tuning the selectivity.
3.4. NMR spectrum
Furthermore, 1H and 31P NMR measurements of the four Rh–diphosphine complexes in CDCl3 were carried out to probe whether the identified molecular structures mentioned above still persist in the solution, and the results are provided in ESI.† Briefly, the 1H NMR spectrum of the Rh–dppm complex shows signals at δ 4.37–4.52 (m, 4H) as well as those at 7.16 (s, 5H), 7.28–7.32 (m, 7H), 7.40–7.44 (m, 12H) and 7.60–7.75 (m, 16H), which are assigned to two methylene groups and eight phenyl groups of two dppm ligands in Fig. 3, respectively. In contrast, the 1H NMR spectra of the three complexes show the signals of the acetyl group hydrogen in addition to the similar characteristic signals of a diphosphine ligand in Fig. 4, i.e., the δ 2.77 (s, 3H) for the Rh–dppe complex, δ 3.06 (s, 3H) for the Rh–dppp complex and δ 2.73 (s, 3H) for the Rh–dppb complex. Notably, the chemical shifts of acetyl group hydrogen atoms from Rh–dppe complex and Rh–dppb complex are shifted to the higher field than that from Rh–dppp complex by about 0.3 ppm, which indicates that the chemical environment of the acetyl group hydrogens in Rh–dppp complex is different from that in the other catalysts. This observation further confirms the existence of pseudo-agostic interactions in Rh–dppe and Rh–dppb complexes.3.5. The effects of ligands on catalytic performance
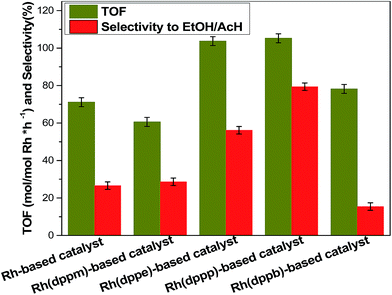
The effects of ligands on catalytic performances are shown in Fig. 5, more detailed product distribution was provided in Table S4.† In the absence of diphosphine ligand, the TOF and the selectivity to ethanol/acetaldehyde of Rh-based catalyst are only 71.1 h−1 and 26.6%, respectively. In contrast, the TOF and selectivity to ethanol/acetaldehyde of Rh(dppm)-based catalyst (dppm modified Rh-based catalyst) were decreased, while those of the other three catalysts were enhanced except the Rh(dppb)-based catalyst with lower selectivity to ethanol/acetaldehyde. Notably, the TOF of Rh(dppp)-based catalyst was increased by ∼50 percent and the selectivity of ethanol/acetaldehyde was increased by two-folds over the Rh-based catalyst. These results strongly indicate ligand effects of Rh catalysts toward reductive carbonylation of methanol to ethanol.Previous studies reported that the diphosphine ligand modified catalysts possess chelate ring structure that is composed of ligand and center metal atom.36,37 In this case, the structures of Rh(dppm)-based catalyst, Rh(dppe)-based catalyst, Rh(dppp)-based catalyst and Rh(dppb)-based catalyst involves four-membered, five-membered, six-membered and seven-membered chelate ring, respectively. The structures of the five-membered ring and six-membered ring are always more stable than the other-membered rings due to their smaller tension of angle. Meanwhile, the Rh(dppe)-based catalyst and Rh(dppp)-based catalyst with stable chelate ring structure exhibit higher TOF. This observation implies that the ligand with proper carbon chain between two phosphorus atoms improves the stability of Rh catalyst, which accounts for the enhanced reactivity.
3.6. The steric effect on the reactivity of [Rh(COCH3)I2(diphosphine)] complexes
The structural analysis shows that all of [Rh(COCH3)I2(diphosphine)] complexes possess square-based pyramidal geometries. Such structure places a vacant coordination site available for H2 activation or CO coordination in a position trans to the acetyl group. Therefore, the steric congestion around the vacant coordination site can influence the reaction of Rh with H2/CO. Such steric congestion was obviously created by the disposition of “axial” phenyl groups (where the equatorial plane is defined as that containing the rhodium atom and the two phosphorus atoms). The steric congestion of phenyl groups is always expressed according to a quadrant diagram.29,36,38 The quadrants with edge-exposed phenyl groups are more hindered than that with face-exposed phenyl groups.36 The quadrant diagrams for [Rh(COCH3)I2(dppm)] (a), [Rh(COCH3)I2(dppe)] (b), [Rh(COCH3)I2(dppp)] (c) and [Rh(COCH3)I2(dppb)] (d) are shown in Fig. 6, and the shaded squares of the quadrants represent the hindered edge-exposed phenyl groups.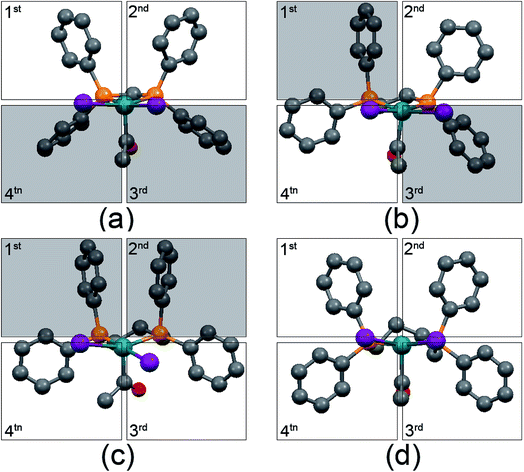 | ||
| Fig. 6 Quadrant diagram for [Rh(COCH3)I2(dppm)] (a), [Rh(COCH3)I2(dppe)] (b), [Rh(COCH3)I2(dppp)] (c) and [Rh(COCH3)I2(dppb)] (d). Hydrogen atoms are not included for the sake of clarity. | ||
As shown in Fig. 6, the quadrants 3 and 4 in [Rh(COCH3)I2(dppm)], the quadrants 1 and 3 in [Rh(COCH3)I2(dppe)] and the quadrants 1 and 2 in [Rh(COCH3)I2(dppp)] are indicative of larger steric hindrance. In contrast, all of the phenyl groups in [Rh(COCH3)I2(dppb)] are close to face-exposed phenyl groups, implying less steric crowding in the four quadrants. Obviously, the steric congestions around the empty coordination site are from quadrants 1 and 2 in these three Rh acetyl complexes. Therefore, the steric congestions around the empty coordination site of the complexes are in such order: [Rh(COCH3)I2(dppp)] > [Rh(COCH3)I2(dppe)] > [Rh(COCH3)I2(dppm)] ≈ [Rh(COCH3)I2(dppb)]. It is noted that such order is consistent with the order of selectivity to ethanol/acetaldehyde, indicating that the steric congestion can improve the ethanol/acetaldehyde selectivity. The distances between the outside hydrogen atoms of the edge-exposed phenyl groups and iodide atoms are shown in Fig. 7.
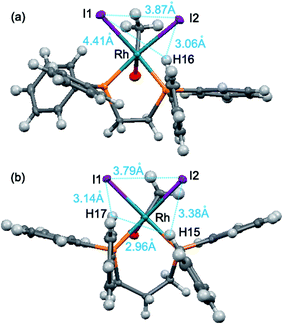 | ||
| Fig. 7 Distances between the outside hydrogen atoms of the edge-exposed phenyl groups and iodide atoms, (a) [Rh(COCH3)I2(dppe)], (b) [Rh(COCH3)I2(dppp)]. | ||
As depicted in Fig. 7, the distances among iodide atoms and the outside hydrogen atoms are from 2.96 Å to 4.41 Å. It was found that most of the distances were smaller than the molecular diameter of CO (3.76 Å), but all of them were larger than H2 (2.9 Å). The observation signifies that the ligand atoms adjacent to the empty coordination site create a steric congestion around rhodium, which gives rise to preferential reaction of rhodium with H2 because that the CO is partly hindered. Therefore, the various ethanol/acetaldehyde selectivity of ligand modified Rh-based catalyst is ascribed to the different steric congestion in the position trans to acetyl group of the corresponding Rh–acetyl complex.
4. Conclusions
In summary, the reactivity of diphosphine modified Rh-based catalyst was studied, and the corresponding single crystals of Rh complexes were prepared. By combining catalytic measurements with multiple characterization techniques on the obtained complexes, we have established a structure–catalytic performance relationship and elucidated the nature of ligand effects in the ligand modified Rh-based catalysts for reductive carbonylation of methanol to ethanol. The diphosphine ligand with the appropriate number of methylene between two phosphorus atoms can enhance the catalyst stability and thus improve the TOF. The edge-exposed phenyl groups of diphosphine ligand create the steric congestions in the position trans to the acetyl group, which favors the reaction of rhodium with H2 and thus promotes the ethanol/acetaldehyde formation. The insights revealed here could open a new avenue for rational selection of ligand to obtain the Rh-based catalysts with the enhanced formation of ethanol.Conflicts of interest
There are no conflicts to declare.Acknowledgements
This work was supported by the Shanghai Pujiang Program (14PJD011) and the Fundamental Research Funds for the Central Universities (222201717013). We wishes to thank Dr Xuezhi Duan for helpful advice.References
- D. P. Ho, H. H. Ngo and W. Guo, Bioresour. Technol., 2014, 169, 742–749 CrossRef CAS PubMed.
- T. Serra, D. Zilberman, J. M. Gil and B. K. Goodwin, in Handbook of Bioenergy Economics and Policy, ed. M. Khanna, J. Scheffran and D. Zilberman, Springer, NY, 2010, pp. 55–72. Search PubMed.
- H. Bayraktar, Renewable Energy, 2005, 30, 1733–1747 CrossRef CAS.
- J. M. Storey, T. Barone, K. Norman and S. Lewis, SAE Int. J. Fuels Lubr., 2010, 3, 650–659 CrossRef CAS.
- A. E. Farrell, R. J. Plevin, B. T. Turner, A. D. Jones, M. O'Hare and D. M. Kammen, Science, 2006, 311, 506–508 CrossRef CAS PubMed.
- M. A. Haider, M. R. Gogate and R. J. Davis, J. Catal., 2009, 261, 9–16 CrossRef CAS.
- M. Gupta, M. L. Smith and J. J. Spivey, ACS Catal., 2011, 1, 641–656 CrossRef CAS.
- M. J. Chen, H. M. Feder and J. W. Rathke, J. Am. Chem. Soc., 1982, 104, 7346–7347 CrossRef CAS.
- K. G. Moloy and R. W. Wegman, J. Chem. Soc., Chem. Commun., 1988, 820–821 RSC.
- S. Zhao, H. Yue, Y. Zhao, B. Wang, Y. Geng, J. Lv, S. Wang, J. Gong and X. Ma, J. Catal., 2013, 297, 142–150 CrossRef CAS.
- Y. Zhu, X. Kong, X. Li, G. Ding, Y. Zhu and Y. Li, ACS Catal., 2014, 4, 3612–3620 CrossRef CAS.
- Z. Wang, G. Li, X. Liu, Y. Huang, A. Wang, W. Chu, X. Wang and N. Li, Catal. Commun., 2014, 43, 38–41 CrossRef CAS.
- K. Zhang, H. Zhang, H. Ma, W. Ying and D. Fang, Catal. Lett., 2014, 144, 691–701 CrossRef CAS.
- I. Wender, R. Friedel and M. Orchin, Science, 1951, 113, 206 CAS.
- J. Berty and L. Marko, Chem. Technol., 1956, 8, 260 CAS.
- M. Röper, H. Loevenich and J. Korff, J. Mol. Catal., 1982, 17, 315–322 CrossRef.
- Y. Sugi, K.-i. Bando and Y. Takami, Chem. Lett., 1981, 10, 63–64 CrossRef.
- G. Doyle, J. Mol. Catal., 1983, 18, 251–258 CrossRef CAS.
- M. Halttunen, M. Niemelä, A. Krause and A. Vuori, J. Mol. Catal. A: Chem., 1996, 109, 209–217 CrossRef CAS.
- J. Pursiainen, K. Karjalainen and T. A. Pakkanen, J. Organomet. Chem., 1986, 314, 227–230 CrossRef CAS.
- K. G. Moloy and R. W. Wegman, Organometallics, 1989, 8, 2883–2892 CrossRef CAS.
- K. G. Moloy and R. W. Wegman, Adv. Chem. Ser., 1992, 230, 323–336 CrossRef CAS.
- K. G. Moloy and J. L. Petersen, Organometallics, 1995, 14, 2931–2936 CrossRef CAS.
- F. Porta, S. Tollari, C. Bianchi and S. Recchia, Inorg. Chim. Acta, 1996, 249, 79–83 CrossRef CAS.
- P. G. Gassman, D. W. Macomber and S. M. Willging, J. Am. Chem. Soc., 1985, 107, 2380–2388 CrossRef CAS.
- G. Gallaher, J. G. Goodwin, C.-S. Huang and M. Houalla, J. Catal., 1991, 127, 719–731 CrossRef CAS.
- D. Clark, I. Woolsey, S. Robinson, K. Laing and J. Wingfield, Inorg. Chem., 1977, 16, 1201–1206 CrossRef CAS.
- G. Lamb, M. Clarke, A. M. Slawin, B. Williams and L. Key, Dalton Trans., 2007, 5582–5589 RSC.
- L. Gonsalvi, H. Adams, G. J. Sunley, E. Ditzel and A. Haynes, J. Am. Chem. Soc., 2002, 124, 13597–13612 CrossRef CAS PubMed.
- B. D. Panthi, S. L. Gipson and A. Franken, Inorg. Chim. Acta, 2015, 425, 176–181 CrossRef CAS.
- C. P. Kubiak, C. Woodcock and R. Eisenberg, Inorg. Chem., 1982, 21, 2119–2129 CrossRef CAS.
- M. M. Olmstead, C. H. Lindsay, L. S. Benner and A. L. Balch, J. Organomet. Chem., 1979, 179, 289–300 CrossRef CAS.
- L. Contreras, A. Monge, A. Pizzano, C. Ruiz, L. Sanchez and E. Carmona, Organometallics, 1992, 11, 3971–3980 CrossRef CAS.
- D. Braga, F. Grepioni, E. Tedesco, K. Biradha and G. R. Desiraju, Organometallics, 1997, 16, 1846–1856 CrossRef CAS.
- H. Adams, N. A. Bailey, B. E. Mann and C. P. Manuel, Inorg. Chim. Acta, 1992, 198–200, 111–118 CrossRef CAS.
- J. A. Gillespie, E. Zuidema, P. W. van Leeuwen and P. C. Kamer, Phosphorus (III) Ligands in Homogeneous Catalysis: Design and Synthesis, 2012, pp. 1–26 Search PubMed.
- L. Cavallo and M. Solà, J. Am. Chem. Soc., 2001, 123, 12294–12302 CrossRef CAS PubMed.
- W. S. Knowles, Acc. Chem. Res., 1983, 16, 106–112 CrossRef CAS.
Footnote |
| † Electronic supplementary information (ESI) available. CCDC 1527246. For ESI and crystallographic data in CIF or other electronic format see DOI: 10.1039/c7ra10739k |
| This journal is © The Royal Society of Chemistry 2017 |

