 Open Access Article
An aptamer-based fluorescence probe for facile detection of lipopolysaccharide in drinks†
Zhifeng Zhang‡
 ,
Jiajia Yang‡,
Wenting Pang and
Guiqin Yan
 *
*
Shanxi Normal University, Linfen, Shanxi 041000, China. E-mail: zzfsx2012@126.com; Fax: +86 0357 2051243
First published on 1st December 2017
Abstract
Bacterial toxin contamination is a serious food safety issue. Rapid, facile detection of bacterial toxins in food is crucial to control their harmful effects on human health. In this study, a facile, selective, and cost-effective method with a 6-carboxy-X-rhodamine labeled lipopolysaccharide binding aptamer (ROX-LBA)/GO fluorescent probe was developed based on the specific recognition characteristics of aptamers and the super fluorescence quenching efficiency of graphene oxide (GO) and used for the detection of lipopolysaccharides (LPS). ROX-LBA is adsorbed on the GO surface because of its strong π–π stacking interactions in the flexible single-stranded state, and fluorescence is quenched by GO via Förster resonance energy transfer (FRET). After adding LPS, the aptamer binds to LPS and forms a LPS/ROX-LBA complex, which exhibits weak binding affinity with GO. ROX-LBA cannot effectively combine with GO, and fluorescence is restored. The concentration of LPS can be quantitatively analyzed by observing fluorescence changes in the sensing system. The fluorescence intensity proportionally increases with LPS concentration (25–1600 ng mL−1), and the detection limit is 15.7 ng mL−1. Hence, the proposed method provides an alternative strategy for the specific detection of endotoxin in drink samples (e.g., apple juice and beer) and could be widely applied to quantify various bacterial toxins by replacing the aptamer sequences.
1. Introduction
Food contamination caused by pathogenic bacteria is one of the most significant issues affecting human health and food safety worldwide, particularly in developing countries. Lipopolysaccharides (LPS), also called as bacterial endotoxins, are common immunogenic molecules that cause bacterial contamination and cover more than 90% of the outer membrane of all gram-negative pathogens; 1,2 LPS consists of three distinct regions: O-specific antigen forming the surface antigen, core oligosaccharide, and lipid A.3–5 Although LPS firmly anchors within the bacterial cell wall, a large amount of this molecule is still continuously shed and released into the surrounding medium during the growth, division, and death of bacteria cells.6 Given that bacteria can grow in various kinds of nutrient media, LPS is commonly found in food, water, and pharmaceutical products of bacterial origin.7 LPS is thermostable, and its biological activity is difficult to destroy through regular sterilization.8 Exposure to bacterial LPS by consuming unhygienic food, water, or insufficiently purified parenteral drugs can cause various diseases, such as fever, vomiting, diarrhea, reduced blood pressure, sepsis or septic shock, inflammatory response, and disseminated intravascular coagulation.9–12 Septic shock induced by LPS is a significant threat to public health, with more than 150![[thin space (1/6-em)]](https://www.rsc.org/images/entities/char_2009.gif) 000 patient-related infection cases reported every year in the United States alone.13 Considering that LPS is extremely toxic and a significant health risk to humans, scholars must develop specific strategies to rapidly control and sensitively identify LPS in complex samples for numerous fields, such as food and pharmaceutical industries, health care, agriculture, environment, and recombinant therapeutic product manufacturing.14,15
000 patient-related infection cases reported every year in the United States alone.13 Considering that LPS is extremely toxic and a significant health risk to humans, scholars must develop specific strategies to rapidly control and sensitively identify LPS in complex samples for numerous fields, such as food and pharmaceutical industries, health care, agriculture, environment, and recombinant therapeutic product manufacturing.14,15
Up to now, much research efforts have been devoted to development of specific and sensitive assays for LPS. Enzymatic limulus amoebocyte lysate assay is commonly used to detect LPS, but this method is susceptible to variations in experimental conditions, particularly pH and temperature, and requires complicated sample preparation and testing procedures.16–18 To address these drawbacks, scholars have developed alternative methods for LPS detection by using various signals, such as colorimetric,19–22 surface-enhanced Raman scattering,23 fluorescence,24 and electrochemical signals.25–27 These methods exhibit high sensitivity and accuracy. However, with increasing concerns on food safety, a large number of food samples should be efficiently tested for LPS because bacteria are commonly found in numerous raw food samples. Therefore, a convenient technique for detection of LPS in food must be developed. In particular, low-cost detection methods are crucial to cope with the increasing demand of the food industry.
With rapid development in the field of nucleotide biotechnology, aptamers have attracted increasing attention as molecular recognition agents for development of biosensors.28 Aptamers, which are short single-stranded oligonucleotides, can specifically recognize and strongly bind to targets, ranging from small molecules to whole cells, through three-dimensional folding.29 Aptamers present numerous competitive advantages, including low cost, synthetic convenience, good stability, modification flexibility, wide applicability, and easy regeneration capabilities, relative to other affinity reagents (such as antibodies, enzymes, or peptides).30–32 Hence, aptamers exhibit potential for detecting various targets, such as metal ions,33 small molecules,34 proteins,22,35–37 cells,38,39 and microorganisms.40–42 A number of aptamer-based biosensors have been developed using different techniques, such as fluorescent methodologies, surface-enhanced Raman spectroscopy, microgravimetry, and electrochemistry.28 Among the various signal transduction protocols, fluorescence resonance energy transfer (FRET) technique has been an attractive option for design of aptamer-based biosensors because of its simplicity and flexibility.43 In an FRET system, excellent donor–acceptor pairs are critical to improve the efficiency of energy transfer and increase the sensor sensitivity.
Graphene oxide (GO), a new inorganic nanomaterial, has received increasing attention in the fields of materials and biological studies because of its excellent fluorescence quenching efficiency, electrical conductivity, large surface area, and high dispersibility in water.44 Compared with organic quenchers, GO possesses broader absorption spectrum and improved quenching efficiency with low background and high signal-to-noise ratio.45 Specifically, GO can strongly adsorb single-stranded DNA (ssDNA) via its hydrophobic and π–π stacking interactions with nucleobases but exhibits less affinity toward double-stranded DNA (dsDNA) or secondary- and tertiary-structured ssDNA.46,47 Hence, GO has been used to develop highly sensitive sensors for various targets.48 In particular, the combination of GO and aptamers exhibits potential for development of novel graphene-based aptasensors.49
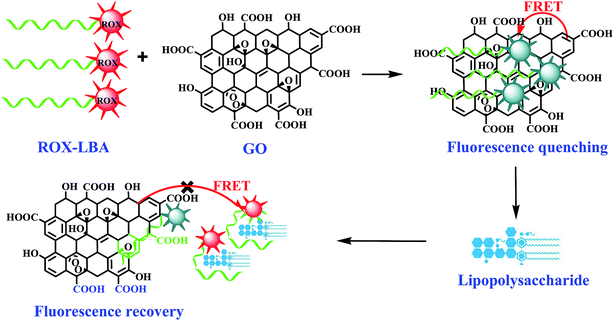
Motivated by the abovementioned, we developed an alternative fluorescent probe for LPS detection. Scheme 1 illustrates the principle of our strategy. The ROX-labeled LPS binding aptamer (ROX-LBA) acting as signaling probe was adsorbed on the GO surface via π–π interactions between the nucleotide bases and GO. This process brought ROX in the close proximity of GO, leading to quenching of ROX fluorescence. Conversely, in the presence of LPS, ROX-LBA can specifically bind to LPS, hinders the interaction between ROX-LBA and GO, and promotes fluorescence recovery. LPS can be easily detected by monitoring changes in the fluorescence signal. Finally, we validated the suitability of the probe for quantification of LPS in practical samples.
2. Experiment
2.1. Materials and apparatuses
Lipopolysaccharide from Escherichia coli 055:B5 (L2880) was purchased from Sigma-Aldrich (USA), while BSA, DNA, RNA, glucose and sucrose were purchased from Sigma (St. Louis, MO, USA). The sequence of 6-carboxy-X-rhodamine (ROX)-labeled LPS binding aptamer used in this paper was as following:27,50ROX-5′-CTTCTGCCCGCCTCCTTCCTAGCCGGATCGCGCTGGCCAGATGATATAAAGGGTCAGCCCCCCAGGAGACGAGATAGGCGGACACT-3′. They were synthesized and HPLC-purified by Sangon Biotech (Shanghai, China) and stored at −20 °C before use. Graphene Oxide (GO) dispersion (0.5 mg mL−1) was purchased from Nanjing XFNANO Materials Technology Corporation (Nanjing, China). All solutions were prepared with ultrapure water from a Millipore Milli-Q water purification system, while other chemicals were of analytical grade and used as received.
2.2 Detection of LPS
For quantitative detection of LPS, 50 μL of ROX-LBA (5 μM), 100 μL of PBS buffer (10 mM, pH = 8.0, 200 mM NaCl) and different concentrations of LPS solutions were firstly incubated for 30 min with gentle shaking at room temperature. Then 300 μL of 0.5 mg mL−1 GO and 400 μL PBS buffer (10 mM, pH = 8.0, 200 mM NaCl) were added into the above mixture. After that, the solutions were diluted to 5 mL with distilled water and incubated for 20 min with gentle shaking at room temperature. Finally, spectra were recorded from 580 nm to 700 nm with excitation at 575 nm. The slit widths for excitation and emission were both set at 5 nm and 10 nm, respectively.2.3 Real sample assay
Detection of LPS was carried out in beer and fruit juices (orange and apple juice) after pre-treatment. The beer was directly diluted 10 times for analysis, while the fruit juices were centrifuged 10![[thin space (1/6-em)]](https://www.rsc.org/images/entities/char_2009.gif) 000 rpm for 5 min to remove the particulate matters, then the supernatant was diluted 10 times for analysis. The concentration of LPS for all spiked samples was kept in the linear scope of detection constantly.
000 rpm for 5 min to remove the particulate matters, then the supernatant was diluted 10 times for analysis. The concentration of LPS for all spiked samples was kept in the linear scope of detection constantly.
3. Results and discussion
3.1. Characterization of GO
The high-resolution transmission electron microscopy (HRTEM) images (Fig. S1A†) show the characteristic monolayer structure of GO. A typical atomic force microscopy (AFM) image of GO is shown in Fig. S1B,† which illustrated the average thickness of GO is about 0.537 nm. In addition, the FT-IR spectrum was acquired to identify functional groups present on the GO surface. As shown in Fig. S1C,† the broad peaks at approximately 3400 cm−1 correspond to the stretching vibration of the hydroxyl group. The peak at 1739 and 1082 cm−1 could be ascribed to the stretching vibration of C![[double bond, length as m-dash]](https://www.rsc.org/images/entities/char_e001.gif) O and C–O stretching vibrations of –COOH groups, respectively. Similar to those in previous reports, the results demonstrated that GO contains –COOH and –OH groups.51
O and C–O stretching vibrations of –COOH groups, respectively. Similar to those in previous reports, the results demonstrated that GO contains –COOH and –OH groups.51
3.2. Feasibility assay
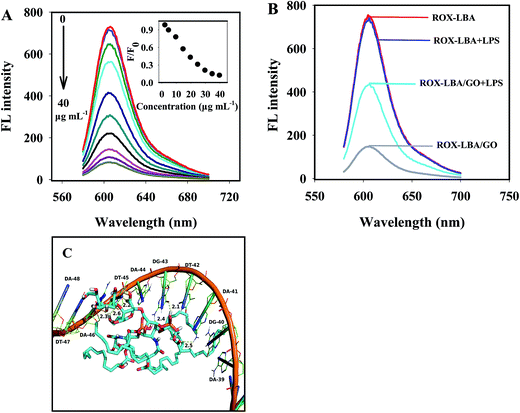
To prove the feasibility of the proposed probe for LPS detection, we investigated the effect of GO on the fluorescence intensity of ROX-LBA. As shown in Fig. 1A, ROX-LBA exhibited strong fluorescence emissions at 606 nm. However, in the presence of GO, the fluorescence intensity of ROX-LBA decreased gradually with increasing GO concentration and remained almost unchanged when the concentration of GO exceeded 30 μg mL−1 (a concentration of GO at 30 μg mL−1 was chosen for the subsequent experiments). This finding may be ascribed to the strong adsorption of ROX-LBA onto GO and the excellent fluorescence quenching ability of GO.36 When ROX-LBA was incubated with LPS for 30 min prior to the addition of GO, the fluorescence emission intensity of the ROX-LBA@GO–LPS system increased by approximately 2.97 times compared with that of the ROX-LBA@GO probe. It can be inferred that the interaction of LPS and ROX-LBA greatly reduces the adsorption of ROX-LBA to GO. It's worth noting that the fluorescence intensity of ROX-LBA remained unchanged when the same concentration of LPS was added to the pure ROX-LBA solution (inset in Fig. 1B). Therefore, the fluorescence recovery of the ROX-LBA@GO probe was not due to the influence of LPS on the luminescence of ROX-LBA but because of the formation of the ROX-LBA/LPS complex. In the presence of the target substance, the aptamer folds to form a special three-dimensional space structure and specifically combines with the target substance under the action of van der Waals forces, base stacking interaction, hydrogen chemical bond, or electrostatic interaction.42 Molecular docking analysis showed that (refer to ESI† documents for analysis) the long chain of LPS extends the DA-39, DG-40, DA-41, DT-42, DA-46, and DT-47 nucleotides in the aptamer, forming a stable hydrophobic interaction. In addition, LPS can bind to aptamer nucleotides, such as DA-41, DG-43, DT-45, and DA-46, forming six hydrogen bonds with corresponding lengths of 2.5, 2.1, 2.4, 2.2, 2.6, and 2.3 Å. All of these interactions lead to a stable composition of LPS and its aptamer. Given that GO rarely interacts with the aptamer and its target complexes,46,47 the fluorescence intensity recovery of ROX-LBA@GO in the presence of LPS could be mainly due to the formation of LBA/LPS complexes with low binding affinity to GO. By changing the addition order of the samples (Fig. S2†), we found that the system exhibited lower fluorescence intensity when the ROX-LBA solution was mixed with GO for 20 min before adding the target LPS. However, the fluorescence intensity of the system evidently increased if the ROX-LBA solution and LPS reacted for 30 min prior to the addition of GO. The above results further illustrated that LPS could bind to ROX-LBA and prevent the combination of ROX-LBA and GO. Moreover, the preferential reaction between LPS and ROX-LBA can increase the flexibility of subsequent detection.523.3 Optimization of detection conditions
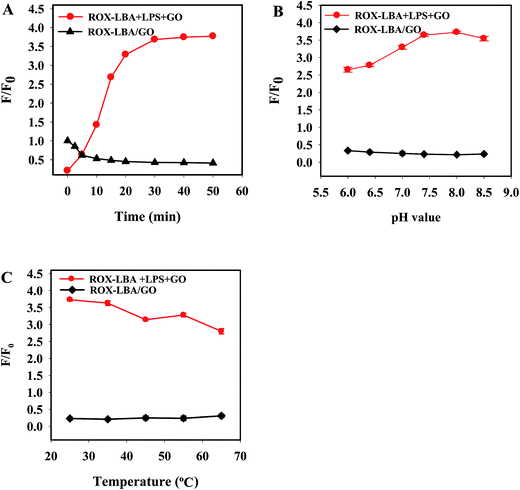
To optimize the assay performance for LPS detection, the detection conditions including reaction time, pH value and incubation temperature were been optimized. The reaction time of ROX-LBA and GO were firstly evaluated by recording time-independent fluorescence emission intensity. As shown in Fig. 2A, the fluorescence intensity ratio F/F0 (where F and F0 refer to the fluorescence intensity of ROX-LBA at 606 nm in the presence and absence of GO, respectively) decreased gradually with increasing incubation time and reached the equilibrium within 20 minutes, indicating that ROX-LBA were completely adsorbed on the surface of GO completely within 20 minutes. Thus, 20 minutes was chose for the fluorescence quenching experiments. The binding time of ROX-LBA and LPS was also optimized and the fluorescence intensity of the reaction system was examined after addition of GO as shown in Fig. 2A, in which the fluorescence intensity ratio F/F0 (where F and F0 refer to the fluorescence intensity of ROX-LBA/GO in the presence and absence of LPS) shows a rapid increase in the first 20 minutes, and then remains constant after 30 minutes. Therefore, 30 minutes was chose as the optimal binding time for LPS and ROX-LBA.The effect of solution pH value on the detection system was then studied over the range of 6.0–8.5. As shown in Fig. 2B, the fluorescence quenching efficiency of GO to ROX-LBA was increased slowly in the pH range of 6.0–8.0, and reached the maximum when the pH reached 8.0. Upon the introduction of LPS, the fluorescence intensity ratio was increased dramatically in the pH range of 6.0–7.5, reached the maximum within the pH range 7.5–8.0, and then decreased with an increase of pH over 8.0 (Fig. 2B). Therefore, phosphate buffer with pH = 8.0 was selected for subsequent experiments.
Considering that temperature not only affects the binding of aptamers to their targets but also affects the stability of their combination, the influence of incubation temperature was also been determined. Fig. 2C suggested that temperature had no obvious effect on the fluorescence quenching efficiency of GO to ROX-LBA. However, increasing the temperature significantly affects the formation of a compound by GO and ROX-LBA and decreases their binding efficiency, which was consistent with that reported in the literature.36 Hence, the selected optimal temperature was 25 °C.
3.4. LPS detection
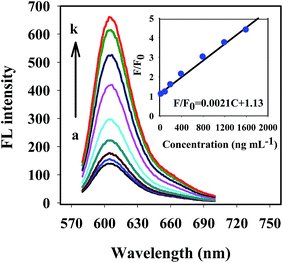
The sensitivity and quantitative range of the proposed probe were evaluated under the optimized assay conditions for detection of LPS. Fig. 3 shows the fluorescence emission spectra of the ROX-LBA/GO system upon incubation with a series of LPS (ranging from 0 to 2000 ng mL−1). The inset shows the fluorescence intensity ratio F/F0 plotted against LPS concentration. It could be seen that, the fluorescence intensity of the ROX-LBA/GO probe was increased gradually with the increase of the concentration of LPS. A good linear relationship between the fluorescence intensity ratio F/F0 and the LPS concentrations was obtained over the concentration range from 25 ng mL−1 to 1600 ng mL−1, which could be expressed as y = 0.0021CLPS + 1.12 (R2 = 0.993) (inset of Fig. 3). With the existence of 50 nM aptamer and 30 μg mL−1 GO in the PBS buffer solution, the detection limit was estimated to be 15.7 ng mL−1 based on 3σ/S, where σ is the standard deviation of 11 parallel measurements of the blank solution without LPS, and S is the slope of the calibration curve.Table S1† shows the comparison between our proposed probe and some other methods reported previously. Relative to colorimetric methods,20,22 surface enhanced Raman scattering sensing,23 surface plasmon resonance smartphone biosensor,53 peptide-perylene based fluorescence detection,17 cationic platinum complexes based fluorescence detection54 and some electrochemistry methods,3,26 the detection limit of 15.7 ng mL−1 obtained by this work is similar to or better than those of above methods. Although the sensitivity was lower than that of gold nanoparticle based fluorescence detection,55 colorimetric analysis reported by Li etc.,56 electrochemical detection developed by Oda etc.,57 and CTAB capped gold based fluorescence detection,58 the proposed method can be operated directly by mixing ROX-LBA, GO, and LPS, which can greatly avoid the complicated probe preparations and reduce the detection cost.
3.5. Selectivity
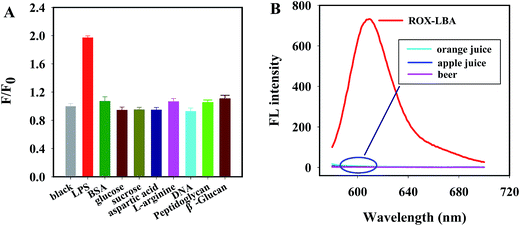
To further evaluate the specificity property of present probe, possible interference of several biological compounds were most likely to be found in a LPS-rich milieu and some polymers likely to be LPS was investigated as well. Fig. 4A shows the fluorescence intensity ratio F/F0 of the probe when incubated with sucrose, bovine serum albumin (BSA), glucose, aspartic acid, L-arginine, DNA, peptidoglycan and β-glucan. It was clearly seen that only LPS caused a dramatic fluorescence restoration. Nonspecific compounds, even when their concentration is 30 times higher than that of LPS, did not cause an obvious response in the fluorescence intensity ratio compared with that of blank solution, which may be attributed to weak combination capacity of LBA to interfering agents. These results clearly demonstrated that our proposed probe responded selectively toward LPS over other tested compounds.Although the analysis of targets in biological samples by adopting organic fluorescent dye probe may be easily interfered by the background fluorescence, the background fluorescence analysis of apple juice, orange juice and beer after the dilution of 10 times showed that, there was no obvious background fluorescence of those three selected samples at the excitation of 575 nm (Fig. 4B), which indicated that, the interference from matrix background fluorescence to the probe developed in practical sample analysis could be excluded. In additional, there was also no obvious influence to the fluorescence emission intensity of ROX-LBA from three samples (Fig. S3†).
These results confirmed that the developed probe exhibited high selectivity toward LPS and showed excellent ability to resist interference.
3.6 Analysis of LPS in real samples
To evaluate the practicability of the proposed probe, we detected LPS in fruit juice and beer, prepared process using the described in the previous section. The recoveries from the test samples were within the range of 87.83–105.94% (Table 1). Thus, the proposed method can be used for practical detection of LPS in real samples.| Type of samples | Added (ng mL−1) | Found (ng mL−1) | Recovery (%) | RSD (n = 3) (%) |
|---|---|---|---|---|
| Apple juice | 400.0 | 370.52 | 92.63 | 3.44 |
| 800.0 | 761.44 | 95.18 | 2.76 | |
| Orange juice | 400.0 | 385.48 | 96.37 | 3.07 |
| 800.0 | 847.52 | 105.94 | 3.79 | |
| Beer | 400.0 | 362.16 | 90.54 | 4.23 |
| 800.0 | 702.64 | 87.83 | 3.72 |
4. Conclusion
In this work, an alternative fluorescent probe for LPS detection was developed based on the strong binding affinity of the aptamer toward its target and the super fluorescence quenching capability of GO. The proposed probe provides a wide linear range of 25 ng mL−1 to 1600 ng mL−1 and a low detection limit of 15.7 ng mL−1 for LPS. Furthermore, the probe is simple, cost-effective, stable, and easy-to-operate owing to the stable interaction of the aptamer to GO. This low-cost and easy to fabricate aptamer is a feasible tool for LPS detection in food. Moreover, the proposed approach is highly versatile and can be extended to detection of other bacterial toxins by rationally changing the aptamer according to a specific target.Conflicts of interest
The authors declare that there is no conflict of interest.Acknowledgements
This work was partially supported by the Natural Science Foundation of Shanxi Province of China (NO. 201601D021098), Fund for Construction Program of Chemical Advantage and Key Discipline of Shanxi Province of China (NO. 912019).References
- Y. Rosenfeld and Y. Shai, Biochim. Biophys. Acta, 2006, 1758(9), 1513–1522 CrossRef CAS PubMed.
- E. T. Rietschel, H. Brade, O. Holst, L. Brade, S. Müller-Loennies, U. Mamat, U. Zähringer, F. Beckmann, U. Seydel, K. Brandenburg, A. J. Ulmer, T. Mattern, H. Heine, J. Schletter and H. Loppnow, Pathology of Septic Shock, 1996, vol. 216, pp. 39–81 Search PubMed.
- K. Brandenburg, A. B. Schromm and T. Gutsmann, Subcell. Biochem., 2010, 53, 53–67 Search PubMed.
- M. B. Gorbet and M. V. Sefton, Biomaterials, 2005, 26, 6811–6817 CrossRef CAS PubMed.
- A. Preston, R. E. Mandrell, B. W. Gibson and M. A. Apicella, Crit. Rev. Microbiol., 1996, 22, 139–180 CrossRef CAS PubMed.
- A. P. Das, P. S. Kumar and S. Swain, Biosens. Bioelectron., 2014, 51(3), 62–75 CrossRef CAS PubMed.
- W. B. Anderson, R. M. Slawson and C. I. Mayfield, Can. J. Microbiol., 2002, 48, 567–587 CrossRef CAS PubMed.
- M. Caroff and D. Karibian, Carbohydr. Res., 2003, 338, 2431–2447 CrossRef CAS PubMed.
- J. Hurley, Toxins, 2013, 5(12), 2589–2620 CrossRef PubMed.
- C. Tischer, U. Gehring, C. M. Chen, M. Kerkhof, G. Koppelman, S. Sausenthaler, O. Herbarth, B. Schaaf, I. Lehmann, U. Krämer, D. Berdel, A. von Berg, C. P. Bauer, S. Koletzko, H. E. Wichmann, B. Brunekreef and J. Heinrich, Eur. Respir. J., 2011, 37, 1050–1059 CrossRef CAS PubMed.
- C. Hirayama and M. Sakata, J. Chromatogr., 2002, 781, 419–432 CAS.
- W. Su, S. E. Kim, M. Cho, J. D. Nam, W. S. Choe and Y. Lee, Innate Immun., 2012, 19, 388–397 CrossRef PubMed.
- S. Koon Lim, P. Chen, S. Moochhala and B. Liedberg, Asian Pac. J. Trop. Dis., 2014, 4, 223–252 CrossRef.
- J. Garcia, D. H. Bennett, D. Tancredi, M. B. Schenker, D. Mitchell, S. J. Reynolds and F. M. Mitloehner, Int. J. Hyg. Environ. Health, 2013, 216, 56–62 CrossRef CAS PubMed.
- P. Miao, RSC Adv., 2013, 3, 9606–9617 RSC.
- B. Beutler and E. T. Rietschel, Nat. Rev. Immunol., 2003, 3, 169–176 CrossRef CAS PubMed.
- F. Liu, J. Mu, X. Wu, S. Bhattacharjya, E. K. Yeow and B. Xing, Chem. Commun., 2014, 50, 6200–6203 RSC.
- F. R. Lourenço, T. S. Botelho and T. J. Pinto, PDA J. Pharm. Sci. Technol., 2012, 66, 542–546 CrossRef PubMed.
- J. Sun, J. Ge, W. Liu, X. Wang, Z. Fan, W. Zhao, H. Zhang, P. Wang and S. T. Lee, Nano Res., 2012, 5, 486–493 CrossRef CAS.
- Y. Wang, D. Zhang, W. Liu, X. Zhang, S. Yu, T. Liu, W. Zhang, W. Zhu and J. Wang, Biosens. Bioelectron., 2014, 55, 242–248 CrossRef CAS PubMed.
- W. Xu, J. Tian, X. Shao, L. Zhu, K. Huang and Y. Luo, Biosens. Bioelectron., 2016, 89, 795–801 CrossRef PubMed.
- C. Lei, Z. Qiao, Y. Fu and Y. Li, Anal. Methods, 2016, 8, 8079–8083 RSC.
- M. F. Liang, D. M. Zhou, W. Yu, C. H. Chen and J. H. Jiang, Chin. J. Anal. Chem., 2013, 41, 1341–1346 CrossRef CAS.
- S. K. Lim, P. Chen, F. L. Lee, S. Moochhala and B. Liedberg, Anal. Chem., 2015, 87, 9408–9412 CrossRef CAS PubMed.
- W. Su, S. E. Kim, M. Cho, J. D. Nam, W. S. Choe and Y. Lee, Innate Immun., 2013, 19, 388–397 CrossRef PubMed.
- S. E. Kim, W. Su, M. Cho, Y. Lee and W. S. Choe, Anal. Biochem., 2012, 424, 12–20 CrossRef CAS PubMed.
- L. Bai, Y. Chai, X. Pu and R. Yuan, Nanoscale, 2014, 6, 2902–2908 RSC.
- Y. Seok Kim, N. H. Ahmad Raston and M. Bock Gu, Biosens. Bioelectron., 2016, 76, 2–19 CrossRef CAS PubMed.
- X. Cao, S. Li, L. Chen, H. Ding, H. Xu, Y. Huang, J. Li, N. Liu, W. Cao and Y. Zhu, Nucleic Acids Res., 2009, 37, 4621–4628 CrossRef CAS PubMed.
- A. B. Iliuk, L. Hu and W. A. Tao, Anal. Chem., 2011, 83, 4440–4452 CrossRef CAS PubMed.
- F. Radom, P. M. Jurek, M. P. Mazurek, J. Otlewski and F. Jeleń, Biotechnol. Adv., 2013, 31, 1260–1274 CrossRef CAS PubMed.
- M. Ilgu and M. Nilsen-Hamilton, Analyst, 2016, 141, 1551–1568 RSC.
- W. Zhao, W. Chiuman, J. C. Lam, S. A. McManus, W. Chen, Y. Cui, R. Pelton, M. A. Brook and Y. Li, J. Am. Chem. Soc., 2008, 130, 3610–3618 CrossRef CAS PubMed.
- X. Xiang, L. Han, Z. Zhang and F. Huang, Spectrochim. Acta, Part A, 2017, 174, 75–79 CrossRef CAS PubMed.
- Y. He, X. Xing, H. Tang and D. Pang, Small, 2013, 9, 2097–2101 CrossRef CAS PubMed.
- L. Gao, Q. Li, R. Li, L. Yan, Y. Zhou, K. Chen and H. Shi, Nanoscale, 2015, 7, 10903–10907 RSC.
- J. Qin, X. Cui, P. Wu, Z. Jiang, Y. Chen, R. Yang, Q. Hu, Y. Sun and S. Zhao, Food Control, 2016, 726–733 Search PubMed.
- B. P. Viraka Nellore, R. Kanchanapally, A. Pramanik, S. S. Sinha, S. R. Chavva, A. Hamme and P. C. Ray, Bioconjugate Chem., 2015, 26, 235–242 CrossRef CAS PubMed.
- L. Liang, M. Su, L. Li, F. Lan, G. Yang, S. Ge, J. Yu and X. Song, Sens. Actuators, B, 2016, 229, 347–354 CrossRef CAS.
- Z. Liu and X. Su, Biosens. Bioelectron., 2017, 87, 66–72 CrossRef CAS PubMed.
- Z. Bagheryan, J. B. Raoof, M. Golabi, A. P. F. Turner and V. Beni, Biosens. Bioelectron., 2016, 80, 566–573 CrossRef CAS PubMed.
- N. Duan, X. Ding, L. He, S. Wu, Y. Wei and Z. Wang, Food Control, 2013, 33, 239–243 CrossRef CAS.
- H. Li, Y. Zhang, T. Wu, S. Liu, L. Wang and X. Sun, J. Mater. Chem., 2011, 21, 4663–4668 RSC.
- P. T. Yin, S. Shah, M. Chhowalla and K. B. Lee, Chem. Rev., 2015, 115, 2483–2531 CrossRef CAS PubMed.
- L. Cui, X. Lin, N. Lin, Y. Song, Z. Zhu, X. Chen and C. J. Yang, Chem. Commun., 2012, 48, 194–196 RSC.
- X. Xing, X. Liu, Y. Zhou, D. Xu, D. Pang and H. Tang, RSC Adv., 2016, 6, 11815–11821 RSC.
- L. Tang, Y. Wang and J. Li, Chem. Soc. Rev., 2015, 44, 6954–6980 RSC.
- H. Zhang, H. Zhang, A. Aldalbahi, X. Zuo, C. Fan and X. Mi, Biosens. Bioelectron., 2017, 89, 96–106 CrossRef CAS PubMed.
- J. Ping, Y. Zhou, Y. Wu, V. Papper, S. Boujday, R. S. Marks and T. W. J. Steele, Biosens. Bioelectron., 2015, 64, 373–385 CrossRef CAS PubMed.
- W. Su, M. Lin, H. Lee, M. S. Cho, W. S. Choe and Y. Lee, Biosens. Bioelectron., 2012, 32, 32–36 CrossRef CAS PubMed.
- Q. Zhang and D. M. Kong, Analyst, 2013, 138, 6437–6444 RSC.
- J. J. Liu, X. R. Song, Y. W. Wang, G. N. Chen and H. H. Yang, Nanoscale, 2012, 4, 3655–3659 RSC.
- J. L. Zhang, I. Khan, Q. W. Zhang, X. H. Liu, J. Dostalek, B. Liedberg and Y. Wang, Biosens. Bioelectron., 2018, 37, 312–317 CrossRef PubMed.
- Y. W. Zhu, C. Xu, Y. Wang, Y. Q. Chen, X. K. Ding and B. A. Yu, RSC Adv., 2017, 7, 32632–32636 RSC.
- J. Gao, Z. Li, O. Zhang, C. Wu and Y. Zhao, Analyst, 2017, 142(7), 1084–1090 RSC.
- D. F. Li, T. W. Sun, W. J. Zhang, Z. M. Shen and J. Zhang, Anal. Chim. Acta, 2017, 992, 85–93 CrossRef CAS PubMed.
- A. Oda, D. Kato, K. Yoshioka, M. Tanaka, T. Kamata, M. Todokoro and O. Niwa, Electrochim. Acta, 2016, 197, 152–158 CrossRef CAS.
- I. E. Paul, A. M. Raichur, N. Chandrasekaran and A. Mukherjee, J. Lumin., 2016, 178, 106–114 CrossRef CAS.
Footnotes |
| † Electronic supplementary information (ESI) available. See DOI: 10.1039/c7ra10710b |
| ‡ These authors contributed equally to this work. |
| This journal is © The Royal Society of Chemistry 2017 |

