
 Open Access Article
 This Open Access Article is licensed under a
 Creative Commons Attribution 3.0 Unported Licence
Synthesis of all-inorganic CsPb2Br5 perovskite and determination of its luminescence mechanism†
Jing Lia,
Huijie Zhanga,
Song Wangb,
Debing Longa,
Mingkai Lia,
Yizhong Guoa,
Zhicheng Zhonga,
Kaifeng Wuc,
Duofa Wang *a and
Tianjin Zhang*a
*a and
Tianjin Zhang*a
aHubei Collaborative Innovation Center for Advanced Organic Chemical Materials, Ministry of Education, Key Laboratory of Green Preparation and Application for Materials, Hubei Provincial Key Laboratory of Polymers, Department of Materials Science and Engineering, Hubei University, Wuhan 430062, People's Republic of China. E-mail: duofawang@hotmail.com; zhangtj@hubu.edu.cn
bHubei Key Laboratory of Low Dimensional Optoelectronic Materials and Devices, Hubei University of Arts and Science, Xiangyang, Hubei 441053, China
cState Key Laboratory of Molecular Reaction Dynamics, Dalian Institute of Chemical Physics, Chinese Academy of Sciences, 457 Zhongshan Road, Dalian 116023, China
First published on 23rd November 2017
Abstract
All-inorganic cesium lead halide perovskite materials, such as CsPbBr3 and CsPb2Br5, have drawn immense attention recently due to their potential applications in optoelectronics. However, unlike the extensively-studied CsPbBr3, many of the fundamental properties of CsPb2Br5 remain unclear, such as its electronic structure and photoluminescence (PL) mechanism. In this work, we developed a novel environmentally friendly chemical method to synthesize CsPb2Br5, where only water and ethanol were used as solvents. The optical property and electronic structure of CsPb2Br5 were then examined both experimentally and theoretically. For the first time we found that the band-edge emission of CsPb2Br5 was not in the visible range as reported in the literature but rather located in the ultraviolet range. By monitoring the PL property during phase conversion between CsPb2Br5 and CsPbBr3, we propose that previously-reported visible emission might be due to the involvement of CsPbBr3 during sample preparation. Overall, this study presents a novel green method for the preparation of CsPb2Br5 and clarifies the optical properties and electronic structure of CsPb2Br5.
1. Introduction
In the recent years, newly emerging metal halide perovskite crystals, in particular organic–inorganic perovskites such as CH3NH3PbX3 (X = Cl, Br, and I), have attracted tremendous scientific attention, thanks to the rapid development of perovskite solar cells whose power conversion efficiency already exceeds 20% since the first report of 3.81% in the year of 2009.1,2 In addition to the applications in photovoltaics, perovskites are also reported in high-efficiency light emitting diodes (LEDs), lasers and photodetectors. From the standpoint of practical application, however, hybrid organic–inorganic perovskites suffer from low environmental- and photo-stability due to their undesirable reaction with water and degradation under UV light irradiation.3–5 Perovskite solar cells start to degrade within several hours without encapsulation; the chemical processes that cause the degradation of perovskite films were reviewed by Niu et al.6 Many efforts are being attempted to mitigate this degradation issue but with very limited success.7 As a type of perovskite material, the all-inorganic perovskites have recently been proposed as promising candidates for optoelectronics because of their higher chemical stability as compared to their hybrid organic–inorganic counterparts.8–10 Cesium lead halide (CsPbX3, X = Cl, Br, and I) is the most widely reported material, which was typically prepared in the range of 140–200 °C by wet chemical method.11 A variety of optoelectronic devices based on CsPbX3 have been reported.Very recently, a new type of inorganic perovskite material, CsPb2Br5, has been found to also exhibit superior optical property and potential application in optoelectronic device.12–15 Especially interesting is that unlike CsPbBr3 that requires high temperature for the synthesis, CsPb2Br5 can be prepared in a facile way at room temperature, which is very attractive for the future applications. Yu et al. first reported on the synthesis of CsPb2Br5 and its efficient photoluminescence (PL) in the visible region (512 nm) with a quantum yield of 87%.12 Zhou et al. demonstrated visible amplified spontaneous emission (ASE) from CsPb2Br5 microplates with very low pump threshold.13 Sun et al. reported the formation of CsPb2Br5 as a by-product during the preparation of CsPbBr3 and also noted an enhancement in the light emission efficiency of CsPbBr3 LED due to the generation of CsPb2Br5.14 However, there is a debate about the luminescence mechanism of inorganic CsPb2Br5 perovskite. Based on the density functional theory (DFT) simulation as well as experimental work, it has been noted that the visible light emission gradually decreases and ultimately disappears accompanying the phase conversion from CsPbBr3 to CsPb2Br5. Jiang et al. emphasized that CsPb2Br5 is an indirect bandgap semiconductor and PL-inactive.15 Therefore, fundamental research on the optical property and electronic structure of CsPb2Br5 is imperative, which is important to explain the current controversial experimental observations and to explore its mechanism of luminescence.
In this context, we report a facile method on the fabrication of tetragonal perovskite, CsPb2Br5 at ambient temperature as well as its phase conversion between CsPb2Br5 and CsPbBr3. By precisely controlling the phase conversion and monitoring the evolution of PL property, we find that CsPb2Br5 has a bandgap of 3.13 eV and correspondingly exhibits a band-edge emission in the ultraviolet region, and hence, the frequently observed visible PL peak can be attributed to the CsPbBr3 by-product in CsPb2Br5. These results not only clarify the luminescence mechanism of CsPb2Br5 being under debate, but also provide valuable insights for the development of CsPb2Br5 based photoelectric devices.
2. Experimental
Synthesis of CsPb2Br5
CsPb2Br5 nanoplates were synthesized by chemical precipitation conducted at room temperature. Firstly, purified water and ethanol were mixed to obtain the solvent mixture (total volume = 2 ml, VH2O![[thin space (1/6-em)]](https://www.rsc.org/images/entities/char_2009.gif) :VEtOH = 1:3). CsAc (1 mmol) was added into the above solution and dissolved completely. PbBr2 (2.5 mmol) was added into CsAc solution and mixed mechanically which resulted in the formation of CsPb2Br5 as a precipitate at the bottom of the solution. The precipitate was further treated with HBr to remove the impurities and then washed with water.
:VEtOH = 1:3). CsAc (1 mmol) was added into the above solution and dissolved completely. PbBr2 (2.5 mmol) was added into CsAc solution and mixed mechanically which resulted in the formation of CsPb2Br5 as a precipitate at the bottom of the solution. The precipitate was further treated with HBr to remove the impurities and then washed with water.
Characterization of CsPb2Br5
The crystal structure was measured by using a X-ray diffractometer (Bruker D8 Advance) with Cu-Kα radiation (λ = 1.5406 Å). The SEM and EDS were measured using JSM7100F. Absorption spectra were obtained by UV-Visible-NIR Spectrophotometer (SHIMADZU UV-3600). Edinburgh FLS 980 was used to measure the steady-state fluorescence spectrum.First principle calculations
First-principle calculations were performed on the basis of density functional theory (DFT) as implemented in the QUANTUM ESPRESSO code. The exchange and correlation terms were described using general gradient approximation (GGA) of Perdew–Burke–Ernzerhof (PBE). The energy cutoff for the plane wave basis set was 600 eV. The accuracy of self-consistent field (SCF) energy convergence and the convergence accuracy of the internal stress of crystal is less than 1.4 × 10⁻⁵ eV per atom and 0.05 GPa, respectively. For the different alloy configurations, Monkhorst–Pack grids were determined automatically for Brillouin zone integration and KPPRA parameter was set to 1000.3. Results and discussion
The CsPb2Br5 was synthesized via a chemical precipitation method and the details are described in the Experimental Section. Briefly, cesium acetate (CsAc) was first dissolved in a mixed solvent of purified water and ethanol and PbBr2 solid was added into the above solvent mixture. As shown by the video (Movie S1) in the ESI,† the reaction is very fast and efficient and results in the formation of CsPb2Br5 just several seconds after the addition of PbBr2 which “emits” green light under UV light irradiation. As CsPb2Br5 does not dissolve well in water, a precipitate was obtained at the bottom. The obtained precipitate was further treated with HBr to remove the impurities and then washed with water. We propose the following equations representing the chemical reactions involved in the synthesis, where CsAc is hydrolyzed at first to generate CsOH, which then reacts with PbBr2:| CsAc + H2O → CsOH + HAc | (1) |
| CsOH + PbBr2 → CsPb2Br5 + Pb(OH)Br | (2) |
| Pb(OH)Br + HBr → PbBr2 + H2O | (3) |
To investigate the possibility of eqn (2), which is crucial for the formation of CsPb2Br5, the total energy (Et) of the chemical reaction was calculated by employing first principles. The change in total energy (ΔEt) of −4.558 eV indicates that the reaction is exothermic and should occur spontaneously. The details of calculations can be found in the ESI (Table S1†). The chemical reaction eqn (1) was confirmed experimentally that the PH value was changed to 9 after the CsAc is added to the mixture solvent of water and ethanol.
Fig. 1a shows the scanning electron microscopy (SEM) image, which illustrates that the formed CsPb2Br5 nanoparticles are prone to aggregate to form a cluster. Energy dispersive spectroscopy (EDS) analysis (Fig. S1 in the ESI†) reveals the molar ratio of Cs/Pb/Br to be 1/2.1/5.9, which agrees well with the stoichiometry of the compound.
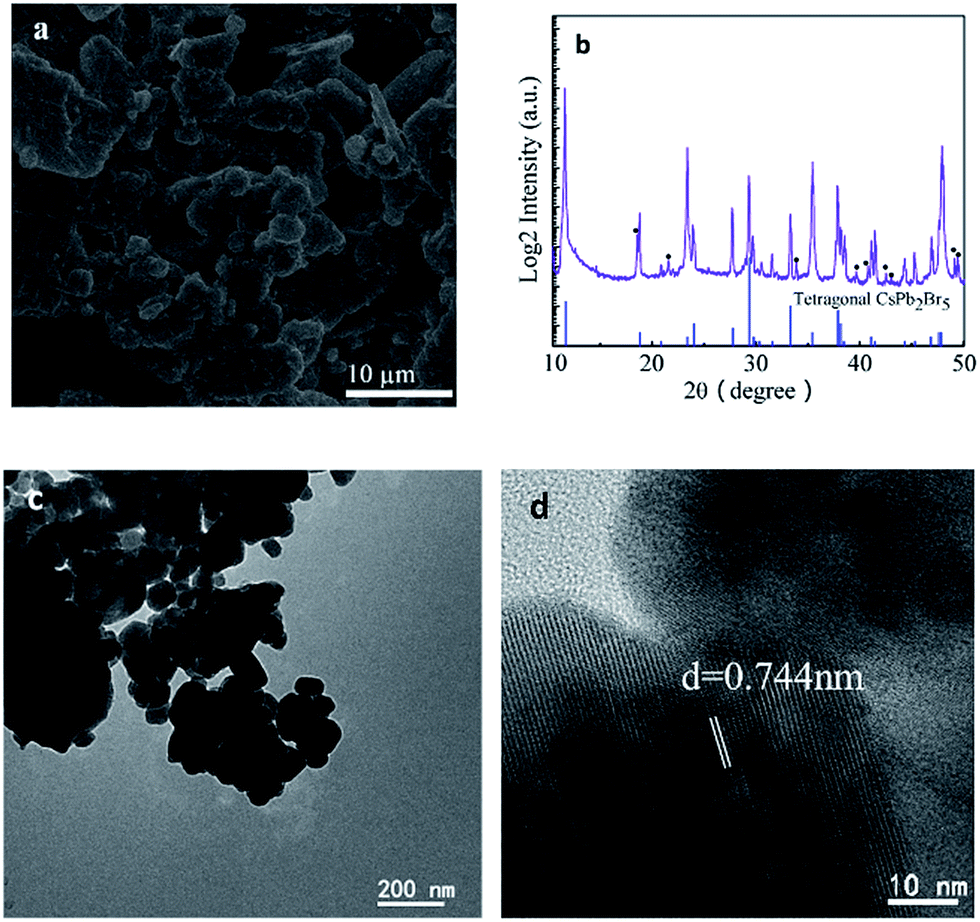 | ||
| Fig. 1 (a) SEM images of CsPb2Br5 cluster. (b) PXRD pattern of tetragonal CsPb2Br5 particles (black dots represent PbBr2). The intensity is in logarithmic scale. (c) Low-resolution, and (d) high resolution lattice resolved TEM image of a representative CsPb2Br5 cluster. | ||
The crystalline structure was characterized by powder X-ray diffraction (PXRD) (Fig. 1b). As shown in this figure, all the diffraction peaks match well with the standard tetragonal phase of CsPb2Br5 (PDF#25-0211). The presence of small amounts of PbBr2 has also been noted. The microstructure of CsPb2Br5 was further characterized by TEM, as shown in Fig. 1c and d. High resolution TEM reveals the crystalline CsPb2Br5 phase with the lattice fringe of 0.744 nm, corresponding to the (002) plane of CsPb2Br5. This is well consistent with the XRD results.
Fig. 2a–e illustrate the detailed structure of CsPb2Br5. The tetragonal phase of CsPb2Br5 belongs to the space group of I4/mcm and it exhibits a sandwich structure consisting of [Pb2Br5]− layers and intercalated Cs+. The Cs+ ions stay in the gaps between the two rectangular pyramid grooves, which have a staggered arrangement. There are two types of bromine atoms occupying different positions in the cell which combine with lead atoms forming a Pb–Br coordination polyhedron. One lead atom and eight bromine atoms make up a hendecahedron. Combining ball-and-stick models and polyhedral models exhibit the tetragonal phase of CsPb2Br5 with an interesting sandwich structure. DFT-based first-principles calculations (see details in the Experimental Section) determined the lattice constants as: a = b = 0.86 nm and c = 1.59 nm.
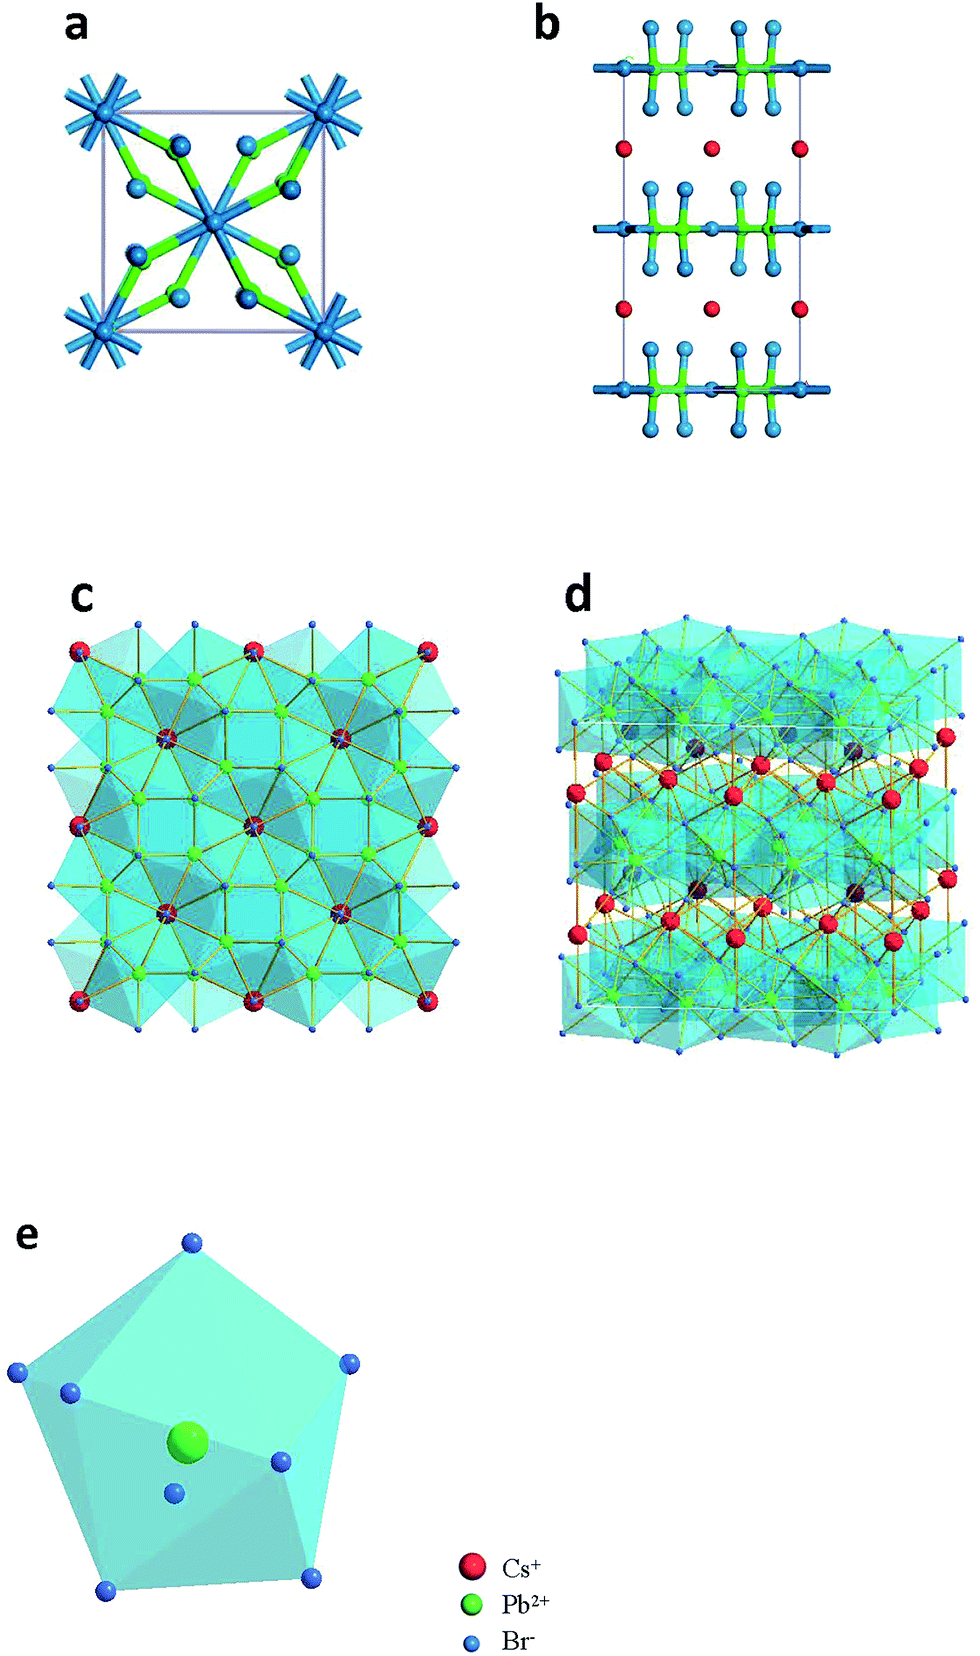 | ||
| Fig. 2 Crystal structure of tetragonal CsPb2Br5. (a), (b) Top and side views of ball-and-stick models for CsPb2Br5 unit cell. (c), (d) Top and side views of polyhedral models for the tetragonal structure of CsPb2Br5, with sandwiched structure by alternating Cs+ and (Pb2Br5)− layers. (e) Schematic of Pb–Br hendecahedron (red ball: Cs+, green ball: Pb2+, blue ball: Br−). | ||
The optical absorption and emission spectra of CsPb2Br5 are shown in Fig. 3a. An obvious absorption edge at 380 nm could be noted which is different from the previously reported value of 520 nm.12,13 In the PL spectrum, the two luminescence peaks at 385 nm and 460 nm were detected which exhibit a small Stokes shift as compared to absorption. Fig. 3b gives the plots of (Ahν)1/2 vs. photo energy, from which a bandgap of 3.13 eV can be found for CsPb2Br5.
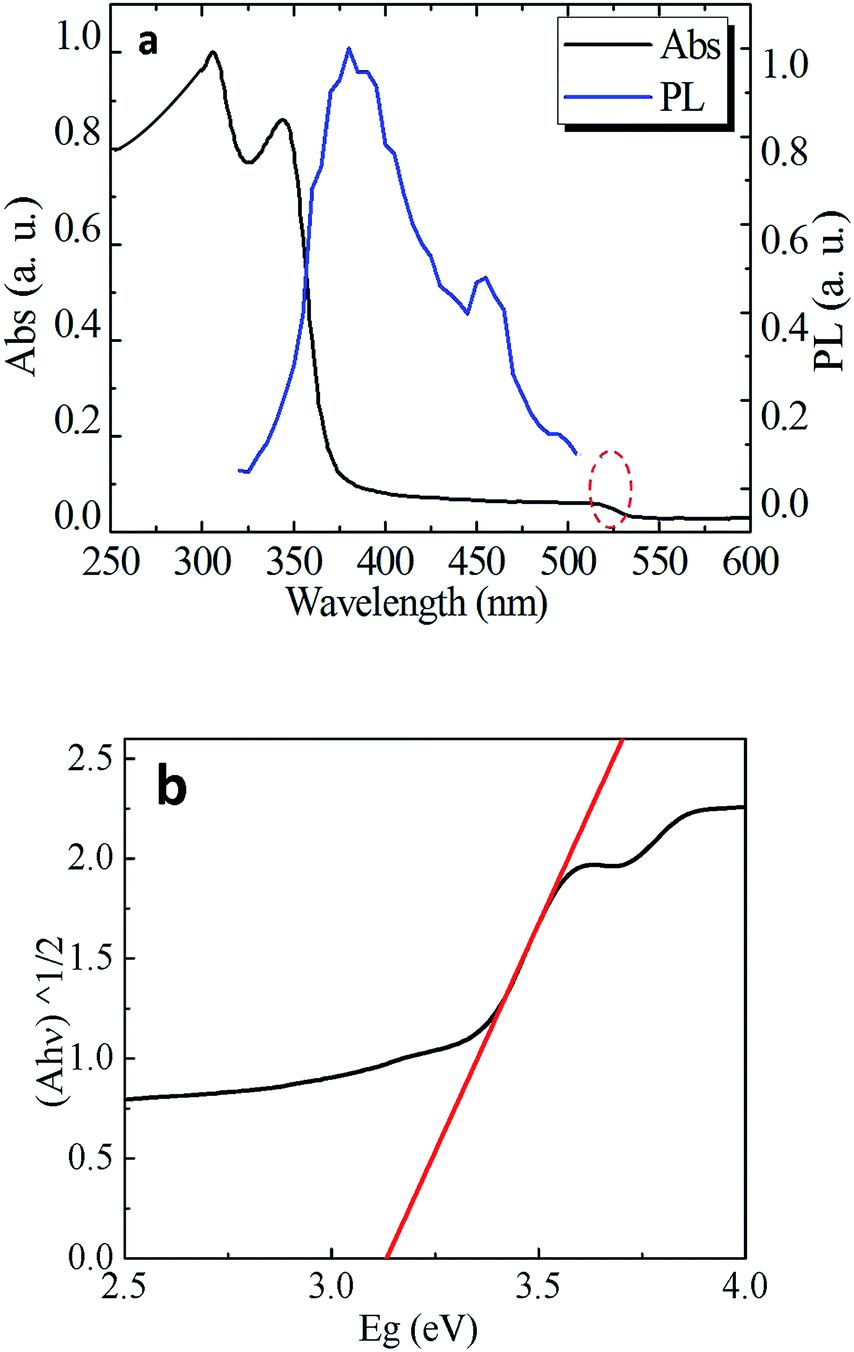 | ||
| Fig. 3 (a) Absorption (black) and PL spectra (blue) of CsPb2Br5 particles, the PL spectrum under 250 nm excitation. (b) Corresponding (Ahν)1/2 vs. energy (hν) curve of CsPb2Br5. The optical band gap of CsPb2Br5 is measured to be ∼3.13 eV. | ||
To reconcile the absorption and emission properties of CsPb2Br5 observed here with previous reports (band edge at ∼515 nm), we scrutinized the absorption spectrum and indeed found another weak absorption edge at ∼515 nm as highlighted with the red circle in Fig. 3a. Since two absorption edges were observed, a reasonable assumption is that the one observed at 515 nm is due to an impurity, the most possible origin of which would be CsPbBr3 considering that there exists a phase transition between CsPbBr3 and CsPb2Br5 as well as that the absorption edge of CsPbBr3 is well known to be located at 515 nm and PbBr2 does not show light emission at room temperature.16,17
To confirm the above speculation, we annealed CsPb2Br5 sample and measured the phase transition and meanwhile monitored the associated absorption and PL properties. Fig. 4a is the PXRD data of CsPb2Br5 annealed at different temperatures. As shown in this figure, the diffraction peaks corresponding to CsPbBr3 and PbBr2 were detected when the sample was treated with thermal annealing, and the intensity of the corresponding diffraction peaks increased with annealing temperature. It indicates that part of the CsPb2Br5 is decomposed into CsPbBr3 as shown by eqn (4),
| CsPb2Br5 → CsPbBr3 + PbBr2 | (4) |
 | ||
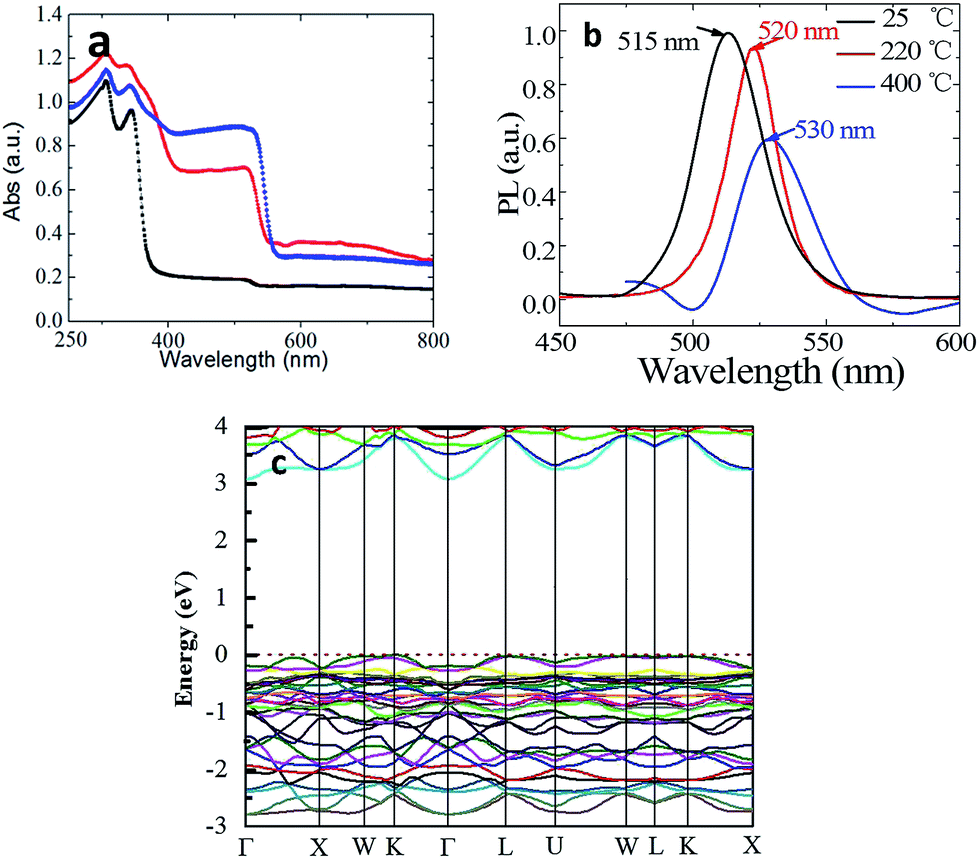
| Fig. 4 (a) PXRD pattern of tetragonal CsPb2Br5 particles after annealing at different temperatures (red squares represent CsPbBr3 (PDF#18-0364), black dots represent PbBr2), sample 1 is of high purity CsPb2Br5 (black) without annealing, sample 2 is CsPb2Br5 after annealing at 220 °C (red), sample 3 is CsPb2Br5 after annealing at 400 °C (blue). (b) XPS spectra of the pure as-grown CsPb2Br5 and annealed composite CsPb2Br5–CsPbBr3 with element Pb 4f. (c) Low-resolution, and (d) high-resolution TEM image of a representative CsPb2Br5 cluster after annealing at 400 °C. | ||
XPS characterization results in Fig. 4b reveals that there is no obvious peak shift of binding energy after the thermal annealing due to the same chemical valence of Pb in CsPb2Br5 and CsPbBr3. The microstructure and composition of the annealed sample was further revealed by TEM and shown in Fig. 4c and d. The CsPb2Br5 and CsPbBr3 are clearly observed in the high resolution TEM, which consistent with XRD results.
Fig. 5a shows the notable increase in absorption between 380 and 530 nm. This absorption band grows with increasing annealing temperature. When the sample was annealed at 400 °C, the absorption edge at 380 nm was not distinguishable any more due to being overwhelmed by the absorption of CsPbBr3, which might explains the absence of the absorption edge at 380 nm as observed in previous reports. The consistency between the PXRD and absorption results demonstrates that the absorption at 515 nm is indeed induced by CsPbBr3.
 | ||
| Fig. 5 (a), (b) Absorption and PL spectra of CsPb2Br5 particles. The black, red and blue represents the sample of as-grown, annealed at 220 °C, and 400 °C, respectively. The PL excitation is 400 nm. (c) DFT calculated band structure of CsPb2Br5 with a bandgap of 3.079 eV. | ||
The PL spectra in Fig. 5b also shows the luminescence peaks corresponding to CsPbBr3.11,18 In addition, the position of PL peak shifts from 515 to 530 nm with thermal annealing. This is ascribed to the size effect. In the as-grown sample, the contents of CsPbBr3 is too low to be detected by XRD and the grain size must be very small. Whereas, it could grown into larger size with the decomposition of CsPb2Br5 after thermal annealing. The band structure of CsPb2Br5 was investigated theoretically by first principles calculations based on DFT (Fig. 5c). It could be seen that CsPb2Br5 exhibits an indirect band gap of 3.079 eV with the conduction band minimum and valence band maximum at the Γ and K points respectively. The obtained bandgap value agrees reasonably well with the value as obtained from the absorption spectrum.
Moreover, we investigated the partial cation exchange of Cs by Rb to from Cs1−xRbxPb2Br5. When RbAc was introduced together with CsAc, Cs1−xRbxPb2Br5 compound was successfully synthesized. As shown in Fig. 6a, the ion exchange by Rb did not change the crystalline structure but the lattice constant was reduced due to the smaller atomic radius of Rb. Fig. 6b plots the absorption and PL spectra of RbPb2Br5. Compared to CsPb2Br5 in Fig. 3a, the absorption and PL are red-shifted, indicating that ion exchange of A-site could be utilized to tune the bandgap and extend the optical response of Cs1−xRbxPb2Br5 to the visible range.
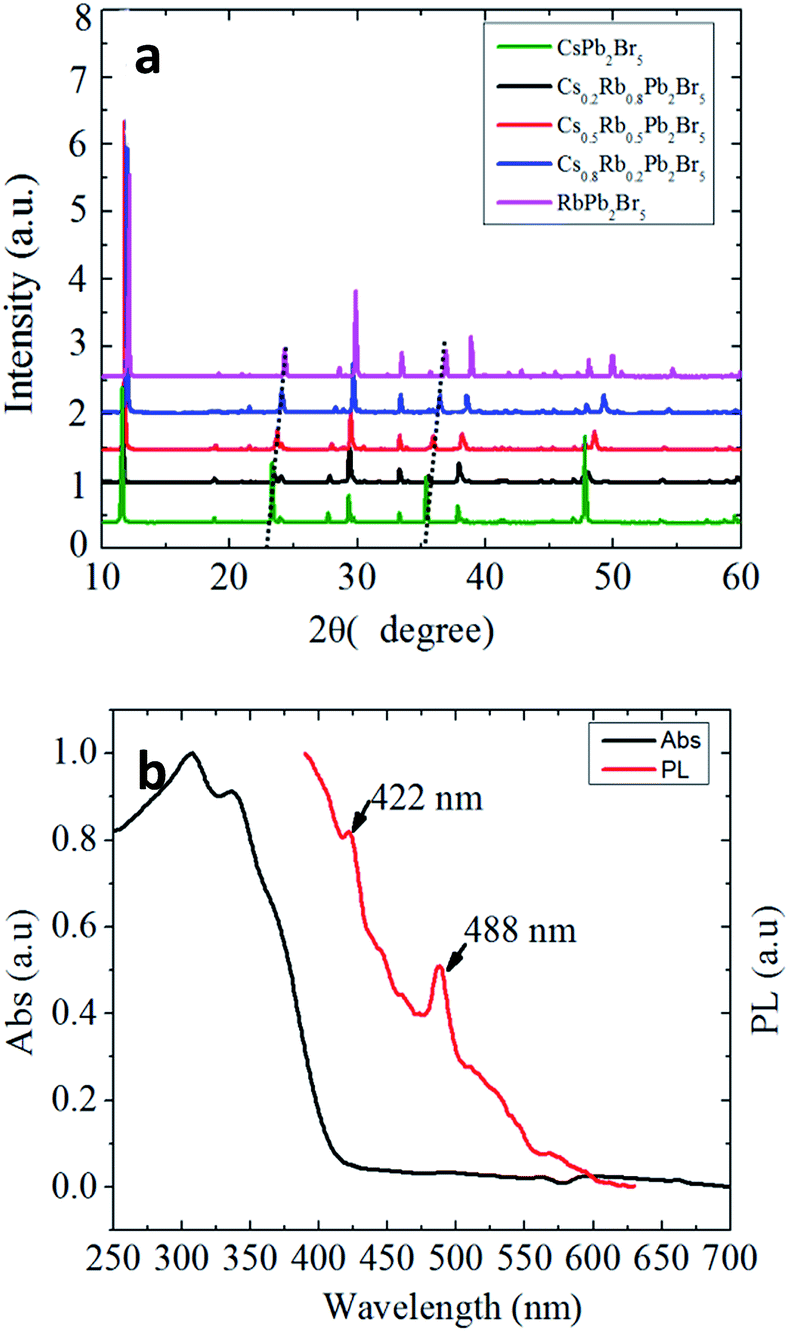 | ||
| Fig. 6 (a) PXRD patterns of the parent CsPb2Br5 particles and anion exchanged samples with increasing quantities of anion-exchange of Rb−. (b) Absorption (black) and PL spectra (red) of RbPb2Br5, the PL spectrum under 250 nm excitation. | ||
4. Conclusions
In conclusion, we developed a novel environmentally green method to synthesize CsPb2Br5, where only water and ethanol were used as solvents. The optical property and electronic structure of CsPb2Br5 have been explored experimentally as well as theoretically. For the first time, we observed the ultraviolet emission from CsPb2Br5. Employing the technique of UV-vis absorption, PL, and first principle calculation, we find that the ultraviolet emission is ascribed to band-edge emission of CsPb2Br5, which has a bandgap of 3.13 eV. The visible emission at 515 nm that was previously ascribed to band edge emission of CsPb2Br5 is now unambiguously assigned CsPbBr3, which emerged as a by-product due to thermally induced phase conversion between CsPb2Br5 and CsPbBr3. This study not only clarifies the luminescence mechanism of CsPb2Br5 being under debate, but also provides valuable insights for the development of CsPb2Br5 based optoelectronic devices.Conflicts of interest
There are no conflicts to declare.Acknowledgements
This work has been supported by National Natural Science Foundation of China (No. 11174071, 11304088 and 51372180) and Special Technical Innovation Project of Hubei Province (No. 2016AAA035).Notes and references
- W. S. Yang, B. W. Park, E. H. Jung, N. J. Jeon, Y. C. Kim, D. U. Lee, S. S. Shin, J. Seo, E. K. Kim, J. H. Noh and S. I. Seok, Science, 2017, 356, 1376 CrossRef CAS PubMed.
- A. Kojima, K. Teshima, Y. Shirai and T. Miyasaka, J. Am. Chem. Soc., 2009, 131, 6050–6051 CrossRef CAS PubMed.
- J. B. You, L. Meng, T. B. Song, T. F. Guo, Y. Yang, W. H. Chang, Z. R. Hong, H. J. Chen, H. P. Zhou, Q. Chen, Y. S. Liu, N. D. Marco and Y. Yang, Nat. Nanotechnol., 2016, 11, 75 CrossRef CAS PubMed.
- Q. D. Tai, P. You, H. Q. Sang, Z. K. Liu, C. L. Hu, H. L. W. Chan and F. Yan, Nat. Commun., 2016, 7, 11105 CrossRef CAS PubMed.
- W. Z. Li, W. Zhang, S. V. Reenen, R. J. Sutton, J. D. Fan, A. A. Haghighirad, M. B. Johnston, L. D. Wang and H. J. Snaith, Energy Environ. Sci., 2016, 9, 490 CAS.
- G. Niu, X. Guo and L. Wang, J. Am. Chem. Soc., 2015, 3, 8970–8980 CAS.
- T. A. Berhe, W. N. Su, C. H. Chen, C. J. Pan, J. H. Cheng, H. M. Chen, M. C. Tsai, L. Y. Chen, A. A. Dubale and B. J. Hwang, Energy Environ. Sci., 2016, 9, 323–356 CAS.
- N. Yantara, S. Bhaumik, F. Yan, D. Sabba, H. A. Dewi, N. Mathews, P. P. Boix, H. V. Demir and S. Mhaisalkar, J. Phys. Chem. Lett., 2015, 6, 4360 CrossRef CAS PubMed.
- S. W. Eaton, M. Lai, N. A. Gibson, A. B. Wong, L. Dou, J. Ma, L. W. Wang, S. R. Leone and P. D. Yang, Proc. Natl. Acad. Sci. U. S. A., 2016, 113, 1993 CrossRef CAS PubMed.
- J. Xue, Y. Gu, Q. S. Shan, Y. S. Zou, J. Z. Song, L. M. Xu, Y. H. Dong, J. H. Li and H. B. Zeng, Angew. Chem., Int. Ed., 2017, 56, 5232 CrossRef CAS PubMed.
- L. Protesescu, S. Yakunin, M. I. Bodnarchuk, F. Krieg, R. Caputo, C. H. Hendon, R. X. Yang, A. Walsh and M. V. Kovalenko, Nano Lett., 2015, 15, 3692 CrossRef CAS PubMed.
- K. H. Wang, L. Wu, L. Li, H. B. Yao, H. S. Qian and S. H. Yu, Angew. Chem., Int. Ed., 2016, 55, 8328 CrossRef CAS PubMed.
- X. S. Tang, Z. P. Hu, W. Yuan, W. Hu, H. B. Shao, D. J. Han, J. F. Zheng, J. Y. Hao, Z. G. Zang, J. Du, Y. X. Leng, L. Fang and M. Zhou, Adv. Opt. Mater., 2016, 5, 1600788 CrossRef.
- X. L. Zhang, B. Xu, J. B. Zhang, Y. Gao, Y. J. Zheng, K. Wang and X. W. Sun, Adv. Funct. Mater., 2016, 26, 4595 CrossRef CAS.
- G. P. Li, H. Wang, Z. F. Zhu, Y. J. Chang, T. Zhang, Z. H. Song and Y. Jiang, Chem. Commun., 2016, 52, 11296 RSC.
- J. Liang, C. X. Wang, Y. R. Wang, Z. R. Xu, Z. P. Lu, Y. Ma, H. F. Zhu, Y. Hu, C. C. Xiao, X. Yi, G. Y. Zhu, H. L. Lv, L. B. Ma, T. Chen, Z. X. Tie, Z. Jin and J. Liu, J. Am. Chem. Soc., 2016, 138, 15829–15832 CrossRef CAS PubMed.
- K. Nitsch, V. Hamplova, M. Nikl, C. Canale, K. Polak and M. Rodova, Chem. Phys. Lett., 1996, 258, 518–522 CrossRef CAS.
- X. M. Li, Y. Wu, S. L. Zhang, B. Cai, Y. Gu, J. Z. Song and H. B. Zeng, Adv. Funct. Mater., 2016, 26, 2435 CrossRef CAS.
Footnote |
| † Electronic supplementary information (ESI) available: Full video of the chemical reaction; energy dispersive X-spectroscopy of CsPb2Br5; total energy calculation of unit cell for each reactant and the resultant chemical eqn (2). See DOI: 10.1039/c7ra10693a |
| This journal is © The Royal Society of Chemistry 2017 |