 Open Access Article
Discharge and corrosion behaviour of AP65 magnesium anode plates with different rolling reductions†
Naiguang Wang a,
Yangchang Mua,
Qi Lib and
Zhicong Shi*a
aSchool of Materials and Energy, Guangdong University of Technology, Guangzhou, 510006, China. E-mail: zhicong@gdut.edu.cn; Fax: + 86 020 39322570; Tel: +86 18933958027
bSchool of Materials Science and Engineering, Central South University, Changsha 410083, China
First published on 20th November 2017
Abstract
AP65 with strong discharge activity is an attractive magnesium anode used for high-power seawater activated batteries. Herein, we adopt multi-pass rolling to tailor the microstructure of AP65 and systematically study the effect of rolling reduction on its discharge and corrosion behaviour. The results indicate that 63% reduction uniformly refines the grains and favours the formation of nanometer sub-grains that distribute homogeneously in the magnesium matrix, hence promoting the active dissolution of the AP65 plate at 180 mA cm−2 and leading to its more negative discharge potential along with higher anodic efficiency compared with other samples. Furthermore, the microstructure features corresponding to different rolling reductions and their impacts on the electrochemical response of AP65 are also analyzed.
1. Introduction
Seawater activated batteries are intriguing power sources for undersea equipments and thus have attracted new interest recently.1–3 These batteries use seawater as the electrolyte, which flows through the cell system and activates the metal anode for power generation.1,4,5 Hence, choosing appropriate metals to serve as the anodes plays a vital role in enhancing the performance of seawater activated batteries. Magnesium with a negative standard electrode potential of −2.37 V (vs. SHE) and a high faradic capacity of 2.2 A h g−1 is a desirable choice of anode material.6–8 Doping it with other elements to form magnesium alloys could even accelerate the self-peeling of oxidation products (Mg(OH)2) and suppress the parasitic corrosion reaction, thus further boosting its anode performance.6,9,10AP65 with a nominal composition of Mg-6 wt% Al-5 wt% Pb is one of these magnesium alloy anodes. The most striking feature of this alloy is its strong discharge activity and high anodic efficiency when applied a large current density.2,11 Hence, it is suitable to serve as the anode for high-power seawater activated battery. Since the metal anode is usually put into use in the form of sheets or plates that placed parallel to the cathodes (AgCl or Cu2Cl2) in the battery system, plastic forming such as extrusion or rolling is used to fabricate the anode plates for battery configuration.12–14 This processing obviously modifies the microstructures of metal anodes and hence affects their discharge performance.15–17 Previous work indicated that hot rolling and post-annealing at proper temperature refined the grains of AP65 and reduced its dislocation density, thus leading to the improvement of discharge performance.11 However, until recently, less attention has been paid on the reduction of multi-pass rolling,15,18,19 which is a crucial parameter that distinctly controls the microstructure along with the discharge and corrosion behaviour of metal anode. In addition, the rolling reduction should be optimized for achieving desirable anode performance. Furthermore, the microstructure evolution under various rolling reductions and its impact on the performance of magnesium anode still needs to be clarified.
In this work, the multi-pass rolling is imposed on AP65 magnesium alloy and the discharge behaviour of the plates with variant rolling reductions is systematically studied by electrochemical response and microstructure characterization. Pure magnesium is also considered for comparison. The purpose of this work is to optimize the rolling reduction for enhancing the anode performance of AP65 and analyze the correlation between microstructure features together with discharge and corrosion behaviour of the magnesium plates with different amounts of rolling deformation.
2. Experimental procedure
2.1 Material preparation
The AP65 magnesium alloy with a nominal composition of Mg-6 wt% Al-5 wt% Pb-1 wt% Zn-0.25 wt% Mn was prepared using a resistance furnace by melting the pure ingots (99.99 wt%) of magnesium, aluminium, lead, and zinc at 730 °C, while manganese was added into the molten metal in the form of Al-30 wt% Mn intermediate alloy. Pure argon was adopted as the protective atmosphere and the stirred liquid alloy was poured into a stainless steel mould with a dimension of 200 mm × 200 mm × 40 mm. The as-cast billet was homogenized at 400 °C for 24 h followed by water quench, and the homogenized specimens was subjected to multi-pass rolling using heated rollers for obtaining the plates with the total reductions of 0%, 38%, 63%, and 86%, respectively. In this work, the rolling reduction is defined using the following equation:
 | (1) |
2.2 Microstructure characterization
The grain sizes of the AP65 plates were characterized with an optical microscope (OM; XJP-6A). These samples were ground with different grades of SiC abrasive papers and polished using diamond paste. The solution of 1 mL nitric acid, 1 mL acetic acid, 1 g oxalic acid, and 70–100 mL distilled water was employed to etch the polished samples for revealing the grain boundaries. The phase structures of the experimental alloys were identified with an X-ray diffractometer (XRD; D/Max 2550) using Cu Ka radiation. The scan range of 2 theta was 10–80° and the scan rate was 1° min−1. The morphology evolution of second phase during rolling was monitored with a scanning electron microscope (SEM; Quanta-200), and the phase composition was determined using energy dispersion spectrum (EDS). A linear intercept method was adopted to measure the sizes of grains and second phase particles.2,20 Three to eight images in different fields of view were selected to count the corresponding size distributions. The crystal defects induced by multi-pass rolling (such as dislocation arrangements and sub-grains) were studied via a transmission electron microscope (TEM; Tecnai G220) with the combination of selected-area electron diffraction (SAED) analysis. The specimens used for the TEM observation were ground to a thickness of 0.08 mm and then ion milled.2.3 Electrochemical tests
A CHI660E electrochemical workstation equipped with a three-electrode cell were employed to perform the electrochemical tests. Pure magnesium and the AP65 plates with different rolling reductions were used as the working electrodes; the testing area for each specimen was 10 mm × 10 mm. All these plates had been ground with 1200 grade SiC abrasive paper and ultrasonically rinsed in ethanol for 5 min before exposed in the electrolyte at room temperature. This electrolyte was 3.5 wt% NaCl solution made from analytical regent and distilled water to simulate seawater.2,9,11 A saturated calomel electrode (SCE) and a platinum foil acted as the reference and counter electrodes, respectively.The polarization curves were measured by potentiodynamic polarization after the working electrodes had been immersed in the electrolyte for 5 min; the initial potential for each test was −1.9 V (vs. SCE) and the scan speed was 1 mV s−1 with anodic scanning direction. The potential–time curves of the testing plates were obtained by galvanostatic discharge at 10 and 180 mA cm−2, respectively, and the corresponding anodic efficiencies were calculated via mass loss method.11,21,22 In addition, the corroded surfaces after discharge were observed with a Quanta-200 SEM. To reveal more information, the oxidation products were removed in dichromic acid using ultrasonic cleaning. The electrochemical impedance spectra (EIS) were recorded at open circuit potentials (OCPs) and the potentials of 100 mV more positive than the OCPs. The soaking time before EIS testing was 5 min to achieve steady OCPs and the voltage amplitude was 5 mV with the frequency varying from 105 Hz to 0.05 Hz.
At least five parallel tests were carried out to ensure good reliability of the data.
3. Results and discussion
3.1 Microstructures
The optical micrographs of AP65 alloys with different rolling reductions are shown in Fig. 1, and the distributions of their grain sizes are revealed by Fig. S1 in ESI.† For each specimen, at least 300 grains in three to four fields of view are counted to obtain the grain size distribution. The homogenized sample without rolling exhibits equiaxed grains with uniform sizes (Fig. 1(a)), the average value of which is (91.3 ± 40.5) μm. Fig. S1(a)† suggests that the grain sizes of this alloy obey normal distribution and mainly locate in the range of 40–160 μm. In addition, a lot of second phase particles (black dots) with small sizes distribute homogeneously in the specimen; however, the XRD patterns (Fig. S2 in ESI†) only reveal the α-Mg, whereas other phases cannot be identified attributed to their relatively low volume fractions.8 Thus, the EDS analysis is used here for phase identification. About five particles in each sample are analyzed and the results are almost the same. The representative EDS (Fig. S3 in ESI†) shows that the atomic ratio of Al/Mn is 1.44, which is close to the stoichiometric ratio of Al8Mn5 (1.6). Therefore, the second phase in AP65 alloy is hereafter identified as Al8Mn5, which is consistent with our previous work.2 Moreover, the β-Mg17Al12 phase in the as-cast billet disappears during the homogenization at 400 °C for 24 h;2,11 lead and zinc dissolve in the α-Mg matrix because of their high solubility in magnesium.23 As a consequence, the experimental alloy is composed of α-Mg and Al8Mn5 phases.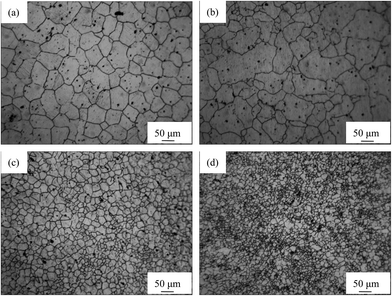 | ||
| Fig. 1 Optical micrographs of AP65 magnesium alloys with the rolling reductions of (a) 0%, (b) 38%, (c) 63%, and (d) 86%. | ||
The multi-pass rolling at 410 °C still sustains the equiaxed grains in AP65 sheets. The rolling reduction of 38% slightly refines the grains ((85.5 ± 53.3) μm); however, the grain sizes are not uniform, with several large grains surrounded by some small ones (Fig. 1(b)). According to Fig. S1(b) in ESI,† these large grains even have the sizes varying from 320 to 360 μm, whereas the small grains could appear in the range of 0–40 μm. This phenomenon means that the small deformation amount promotes the uneven grains in AP65 sheet. After the rolling with 63% reduction, the grains are refined obviously ((43.8 ± 24.6) μm) and their sizes become more uniform without the particularly large grains (Fig. 1(c)). Fig. S1(c) in ESI† reveals that most of the grains locate in the range of 0–80 μm, whereas the percentage of large grains (≥80 μm) is less than 9%. A deformation of 86% further refines the grains ((22.0 ± 13.0) μm), as shown in Fig. 1(d). Moreover, Fig. S1(d)† suggests that the grains of this plate mainly vary from 0–60 μm, whereas few grains could be found in the range larger than 60 μm. However, this grain refining is less significant as compared to that produced by severe plastic deformation.24,25 The possible cause is the result of repeated heating between two rolling passes,26 which leads to the growth of grains.
The morphology evolution of Al8Mn5 particles during the multi-pass rolling is shown in Fig. 2. These SEM images indicate that increasing the reduction to 63% fractures the Al8Mn5 particles (Fig. 2(c)), which distribute along the rolling direction as the deformation further increases to 86% (Fig. 2(d)). However, this phenomenon is less obvious compared with the effect induced by hot extrusion, the deformation of which is obviously larger than that of multi-pass rolling.2 Fig. S4 in ESI† gives the size distributions of Al8Mn5 after different amounts of rolling deformation. For each specimen, at least 100 particles in eight fields of view are counted to obtain the distribution of particle size. It can be observed that all these sizes obey normal distribution and increasing the rolling reduction slightly decreases the average size of Al8Mn5 phase.
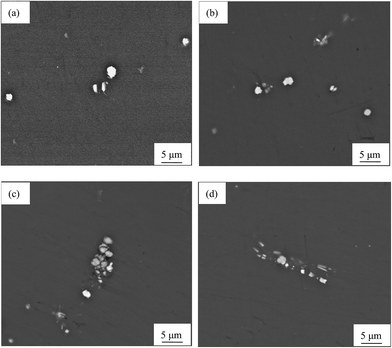 | ||
| Fig. 2 SEM images of AP65 magnesium alloys with the rolling reductions of (a) 0%, (b) 38%, (c) 63%, and (d) 86%. | ||
The TEM image presented in Fig. 3(a) indicates that the dislocation density in the un-rolled sample is relatively low. Fig. S5(a) in ESI† displays the un-fractured Al8Mn5 particle with large size before rolling. The reduction of 38% produces many slip bands (Fig. S5(b) in ESI†)27 and high density of dislocations near the grain boundaries (Fig. 3(b)), while many sub-grains with high energy28 are observed in other regions (Fig. S5(c) in ESI†). This result signifies that the microstructure is not uniform when small deformation is imposed on the specimen, as verified by the optical image shown in Fig. 1(b). The SAED analysis in Fig. S5(c)† shows the type of single crystal diffraction spots, which indicates the micro-scale sub-grains caused by 38% reduction. When the deformation amount increases to 63%, the slip bands disappear and many fine sub-grains distribute homogeneously in the matrix (Fig. 3(c)). The rings obtained via SAED (Fig. S5(d) in ESI†) reveal that these sub-grains are nano-crystalline.29,30 Thus, the 63% reduction produces the unique fine sub-structures in AP65 sheet. A large reduction of 86% favours the formation of well-defined triple line grain boundaries and high density of dislocations, which are stored not only along the boundaries but also within the grains (Fig. 3(d)). Additionally, several regions exhibit the enlarged sub-grain, the size of which is micro dimension, as supported by the corresponding SAED spots (Fig. S5(e) in ESI†). Therefore, further increasing the deformation amount leads to the growth of sub-structures. Fig. S5(f)† gives the morphology of fractured Al8Mn5 phase after 86% deformation; its size is smaller than the un-rolled specimen (Fig. S5(a) in ESI†). Furthermore, the deformation twins in AZ31 wrought magnesium alloys26,31 cannot be found here; this phenomenon is explained as a result of high deformation temperature that accelerates the dynamic recrystallization to some degree.
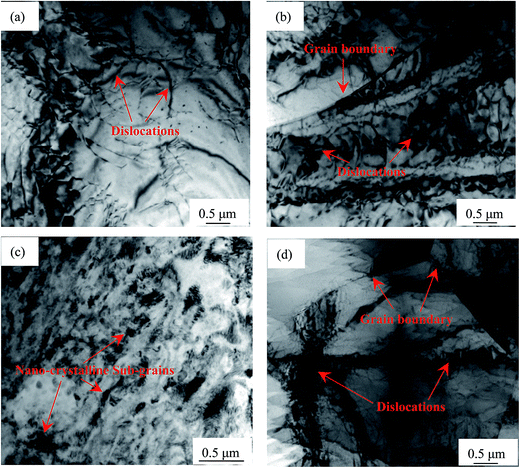 | ||
| Fig. 3 TEM bright field images of AP65 magnesium alloys with the rolling reductions of (a) 0%, (b) 38%, (c) 63%, and (d) 86%. | ||
3.2 Polarization curves
The representative polarization curves of pure magnesium and AP65 specimens with different rolling reductions are shown in Fig. 4, and the evaluated electrochemical parameters are listed in Table 1. The corrosion current densities (jcorr) are the average values of five parallel tests with the standard deviations expressing the errors. These jcorr are obtained by extrapolating linear regions of cathodic branches back to the corrosion potentials (Ecorr). It can be seen that pure magnesium has more negative Ecorr along with larger jcorr than all AP65 samples, indicating that the latter are more corrosion resistant than the former at the corrosion potentials. However, each AP65 specimen with strong discharge activity displays smaller anodic Tafel slop (ba) than pure magnesium, which is less active during anodic polarization and even shows short period of passive behaviour. Rolling deformation cannot obviously affect the cathodic process since the cathodic Tafel slopes (bc) are nearly the same for all AP65 specimens. However, this rolling gradually decreases their ba and negatively shifts the onset potential (Eonset) for the current to reach the maximum value (plateau), thus leading to the active dissolution of AP65 alloys during anodic polarization. This phenomenon is owing to the fact that increasing rolling deformation refines the grains (Fig. 1) and is valuable to enhance the discharge activity.2,17 Moreover, the multi-pass rolling creates crystal defects such as high density of dislocations and sub-grains (Fig. 3 and S5†), which accelerate the dissolution of working electrode24,28,32 and is also responsible for the decrease of ba and the negative shift of Eonset as the amount of deformation increases. Since the un-rolled alloy has low dislocation density, it exhibits larger ba, more positive Eonset, and smaller jcorr than the rolled sheets.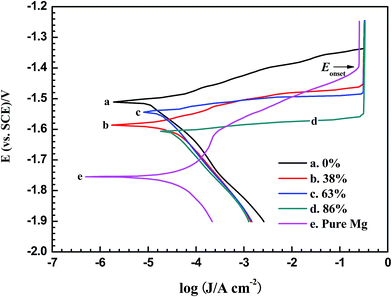 | ||
| Fig. 4 Polarization curves of pure magnesium and AP65 magnesium alloys with different rolling reductions in 3.5 wt% NaCl solution at a scan rate of 1 mV s−1. | ||
| Rolling reduction | Ecorr (vs. SCE)/V | Eonset (vs. SCE)/V | jcorr/(μA cm−2) | bc/(mV dec−1) |
|---|---|---|---|---|
| 0 | −1.511 | −1.336 | 16.2 ± 3.2 | −177 |
| 38% | −1.586 | −1.452 | 40.3 ± 3.6 | −198 |
| 63% | −1.544 | −1.480 | 20.6 ± 3.7 | −189 |
| 86% | −1.606 | −1.549 | 37.1 ± 3.1 | −183 |
| Pure Mg | −1.755 | −1.392 | 61.9 ± 4.2 | −267 |
| Rolling reduction | ba/(mV dec−1) |
|---|---|
| 0 | 39 |
| 38% | 23 |
| 63% | 12 |
| 86% | 12 |
| Pure Mg | 68 |
The AP65 plate with 38% reduction has the largest jcorr among the four samples, attributed to its uneven microstructure caused by the relatively small amount of deformation. According to Fig. 1(b), this plate exhibits large grains surrounded by some small ones. The TEM image shown in Fig. 3(b) indicates the high density of dislocations; Fig. S5(b) and (c)† reveal that many slip bands and sub-grains exist in different regions of the sample, respectively. Song et al.28 reported that the sub-grains and dislocations possess plenty of internal energy and therefore are sensitive to aggressive solution. Gu et al.32 found that the slip bands can break the corrosion products film and facilitate the corrosion process. Additionally, the inhomogeneous crystal defects and the uneven grains also accelerate the micro-galvanic corrosion of the rolled plate with 38% reduction. As a consequence, its corrosion current density is obviously larger than other samples.
The amount of 63% deformation uniformly refines the grains of AP65 (Fig. 1(c)) and forms the nanometer sub-grains that distribute homogeneously in the matrix (Fig. 3(c)). Moreover, this process fractures the particles of Al8Mn5 phase (Fig. 2(c)), the potential of which is 300–400 mV more positive than the α-Mg matrix.33,34 Accordingly, the micro-galvanic effect is suppressed and thus the corrosion resistance at Ecorr is improved. Several literature studies suggested that the grain boundaries could serve as the barriers to inhibit the corrosion of magnesium alloys at the corrosion potentials.35–37 The refined grains in the plate with 63% reduction create more boundaries and thus it shows smaller corrosion current density than the one with 38% deformation.
The grain sizes of AP65 are further refined (Fig. 1(d)) and the Al8Mn5 particles are obviously fractured (Fig. 2(d) and S5(f) in ESI†) when the rolling reduction increases to 86%. However, this large deformation also results in the high density of dislocations (Fig. 3(d)) and the relatively large sub-grains (Fig. S5(e) in ESI†), which are matrix defects that encourage the corrosion process at Ecorr.24,37 Hence, the specimen with 86% deformation has larger corrosion current density than that with 63% reduction.
3.3 Galvanostatic discharge
The representative potential–time curves of pure magnesium and AP65 alloys in the course of galvanostatic discharge at 10 and 180 mA cm−2 are shown in Fig. 5(a) and (b), respectively. The small current density is used to evaluate the performance of low-power battery anodes whereas the large one aims to study the discharge behaviour of the anodes for high-power seawater activated batteries.11,12 The average discharge potentials along with the standard deviations for five parallel tests are listed in Table 2. It can be observed that all these AP65 specimens possess more negative potentials than pure magnesium at each current density, revealing that the former display stronger discharge activity than the latter and thus are suitable to serve as the battery anode. Additionally, the AP65 plates with various rolling reductions exhibit similar discharge behaviour at 10 mA cm−2 and the difference among average discharge potentials is not obvious. In contrast, the large current density of 180 mA cm−2 can clearly reflects the discharge performance of these plates, which have different potentials during discharge. According to Fig. 5(b) and Table 2, rolling negatively shifts the discharge potential of AP65, whereas the specimen with 0% reduction exhibits more positive potential that moves positively with elapsed time. Generally, the anode with negative potential at a certain current density has strong discharge activity and hence could provide high power density when assembled for a battery.9,12,21 Both Fig. 3 and S5† show that multi-pass rolling forms many crystal defects such as dislocations and sub-grains, which have high deformation energy and thus play a valuable role in decreasing the electrochemical potential of α-Mg.15,24,28 Consequently, the rolled plates exhibit more negative discharge potential than the un-rolled one, as in agreement with the values of ba and Eonset based on the polarization curves (Table 1).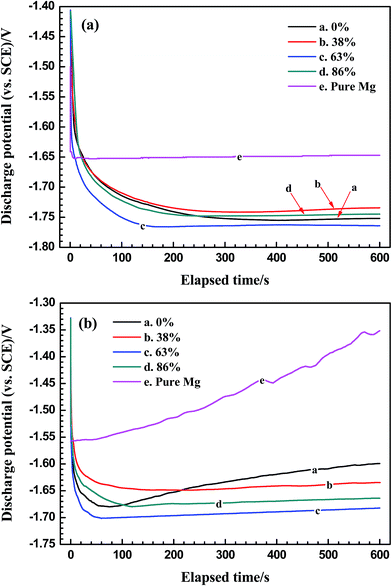 | ||
| Fig. 5 Galvanostatic potential–time curves of pure magnesium and AP65 magnesium alloys with different rolling reductions in 3.5 wt% NaCl solution at (a) 10 mA cm−2 and (b) 180 mA cm−2. | ||
| Rolling reduction | Average discharge potential (vs. SCE)/V | |
|---|---|---|
| 10 mA cm−2 | 180 mA cm−2 | |
| 0 | −1.734 ± 0.001 | −1.635 ± 0.004 |
| 38% | −1.724 ± 0.002 | −1.640 ± 0.005 |
| 63% | −1.754 ± 0.002 | −1.690 ± 0.005 |
| 86% | −1.732 ± 0.001 | −1.667 ± 0.006 |
| Pure Mg | −1.649 ± 0.001 | −1.471 ± 0.006 |
Grain size is another factor controlling the discharge potential of magnesium anode. Previous work indicated that fine grains promoted the discharge activity of AP65 alloy, especially at a large current density.2,11 Increasing rolling deformation obviously refines the grains (Fig. 1); therefore, the plates with 63% and 86% reductions exhibit more negative potentials and smaller ba than that with 38% deformation at 180 mA cm−2. However, the rolling reduction of 86% results in the high density of dislocations (Fig. 3(d)), which accelerate the formation of partial Mg(OH)2 film28 and slightly decrease the active electrode region. As a result, the sheet with 86% deformation exhibits less negative potential than that with 63% reduction, even though the former possesses finer grains than the latter. This issue can be partially solved via post-annealing at proper temperature, which not only reduces the dislocation density but also sustains the fine grains.11,28 The reduction of 63% uniformly refines the grains of AP65 alloy (Fig. 1(c)) and favours the formation of nanometer sub-grains that distribute homogeneously in the matrix (Fig. 3(c)). This unique structure promotes the uniform dissolution of active electrode area and therefore the sheet with 63% deformation has the most negative discharge potential among the four samples.
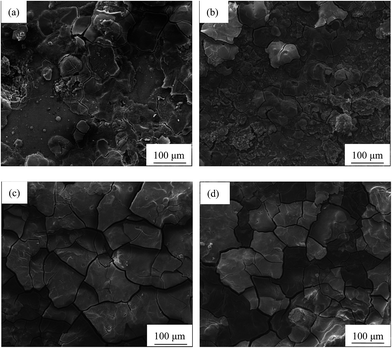
Monitoring the oxidized surface after discharge could reflect the anode performance to some degree. Fig. 6 gives the surface morphologies of the AP65 plates discharged at 180 mA cm−2 for 600 s. The specimens suffered 0% and 38% reductions display relatively thick oxidation products with less cracks, as shown in Fig. 6(a) and (b), respectively. Consequently, their surfaces cannot contact the electrolyte sufficiently, leading to the relatively positive discharge potentials at a large current density. In contrast, the oxidation products of the 63% and 86% reduction plates exhibit more cracks and therefore favour the penetration of electrolyte, as presented in Fig. 6(c) and (d), respectively. Hence, the discharge potentials of the two plates are more negative than those of the samples with small amounts of rolling deformation.
Generally, the negative discharge potential is not always related to the large corrosion current density and negative corrosion potential (Table 1), as confirmed by several literature studies.10,11,21,38 This opinion is due to the fact that the discharge potential is obtained by galvanostatic discharge, which imposes an anodic current on the electrode and significantly changes its surface condition, whereas the corrosion potential and corrosion current density are evaluated from the polarization curve used for characterizing the corrosion rate at the corrosion potential.
The anodic efficiencies of the samples at 10 and 180 mA cm−2 are presented in Table 3. These efficiencies are the average values of five parallel tests and the standard deviations are adopted to express the errors. It can be observed that all AP65 specimens exhibit similar anodic efficiencies lower than pure magnesium at 10 mA cm−2. However, a large current density of 180 mA cm−2 significantly improves their efficiencies, which are obviously higher than that of pure magnesium. Moreover, the rolled plate with 63% reduction has the highest anodic efficiency of (88.9 ± 0.5)% among all samples, and this value is even higher than that of the as-extruded AP65 (ref. 2 and 39). Since the research object is mainly employed for high-power seawater activated battery operating at a large current density,2 the plate with 63% deformation is a good candidate for the anode materials.
| Rolling reduction | Anodic efficiency (%) | |
|---|---|---|
| 10 mA cm−2 for 10 h | 180 mA cm−2 for 1 h | |
| 0 | 39.8 ± 0.7 | 82.5 ± 0.4 |
| 38% | 37.9 ± 0.5 | 79.4 ± 0.6 |
| 63% | 38.9 ± 0.6 | 88.9 ± 0.5 |
| 86% | 38.4 ± 0.7 | 81.9 ± 0.5 |
| Pure Mg | 55.6 ± 0.1 | 64.0 ± 0.5 |
The main issues that adversely influence the anodic efficiency of magnesium include the self- discharge (evolution of hydrogen) and the detachment of metallic pieces (chunk effect).2,10,40 The latter plays more important role than the former when the impressed current density is smaller than 20 mA cm−2.2,21 Fig. S6 in ESI† shows the surface morphologies discharged at 10 mA cm−2 for 600 s after removing the oxidation products. All these specimens exhibit a lot of pits, regardless of the rolling reduction. This result indicates that local corrosion with severe chunk effect occurs on the electrode surfaces, thus significantly decreasing the anodic efficiency of AP65. Increasing the current density promotes the uniform dissolution of magnesium electrode;2,21 hence, the detachment of metallic pieces at 180 mA cm−2 is largely suppressed and the anodic efficiency is improved. However, hydrogen bubbles release quickly under this condition and mainly controls the anodic efficiency of AP65 (ref. 2 and 21). In the studied alloy, Al8Mn5 phase with the potential of 300–400 mV more positive than α-Mg matrix33,34 could serve as the local cathode to promote the evolution of hydrogen, and this effect is more obvious when applied a large current density.2,11 According to Fig. S5(a) in ESI,† the sample before rolling has un-fractured Al8Mn5 particles, which possess relatively large dimensions and thus could accelerate the self-discharge. Increasing rolling deformation gradually fractures the second phase (Fig. 2 and S5(f)†) and inhibits the micro-galvanic effect to some extent; however, the inhomogeneous microstructures and the high density of dislocations make the hydrogen evolved quickly,11,25,28,36 although the refined grains exert an effect on reducing the self-discharge.2,9,10 Therefore, the rolled plates with 38% and 86% reductions have relatively low efficiencies. The rolling deformation of 63% refines the grains of AP65 (Fig. 1(c)) and creates the nano-sized sub-structures with uniform distribution (Fig. 3(c)), hence effectively improving its anodic efficiency.
In addition to hydrogen evolution reaction (HER), oxygen reduction reaction (ORR) is also responsible for the self-corrosion of magnesium and thus might reduce its anodic efficiency. This point of view is based on the fact that the standard potential of ORR in neutral medium is more positive than that of HER. However, the presence of oxygen plays a more important role in the atmosphere corrosion of magnesium with thin electrolyte layers,34,41 whereas the dissolution of magnesium in aqueous solution is relatively insensitive to the oxygen concentration.41,42 Ghali et al.41 suggested that only in pure water and alkaline solutions with good aeration can ORR exert an obvious effect on magnesium corrosion. In this work, the 3.5 wt% NaCl solution is made from analytical regent and distilled water that contains low concentration of dissolved oxygen. Hence, the HER should be the dominant reaction decreasing the anodic efficiency of magnesium electrode, whereas the ORR, if any effect, is less significant.
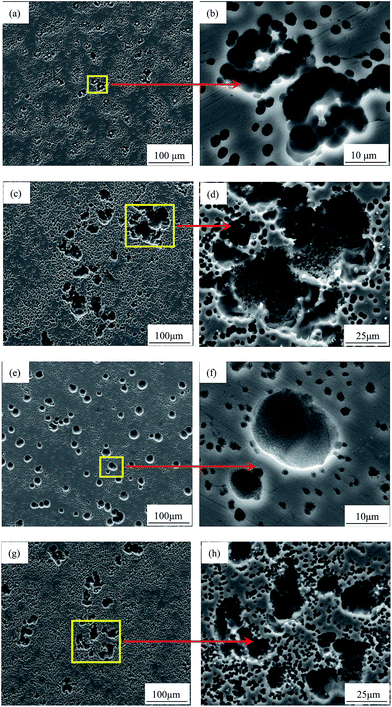
The performance of magnesium electrode at a large current density can also be reflected via observing the corroded surface during initial discharge. Fig. 7 gives the surface morphologies of AP65 alloys discharged at 180 mA cm−2 for 5 s after removing the oxidation products. Except for the plate with 63% deformation, other specimens suffer local corrosion at the outset of discharge. This phenomenon is more obvious for the 38% and 86% rolled plates possessing inhomogeneous microstructures, as demonstrated by the magnified pit morphologies displayed in Fig. 7(d) and (h), respectively. The angular shapes of these pits reveal the spalling of grains21,43 and account for the relatively low anodic efficiencies of the two specimens. In contrast, the sheet with 63% reduction has uniform grain sizes (Fig. 1(c)) and dispersed nano-scale sub-grains (Fig. 3(c)); accordingly, it dissolves uniformly at 180 mA cm−2 and a large number of round pits distribute homogeneously on the electrode surface (Fig. 7(e)). Fig. 7(f) clearly reveals the morphologies of these pits; the angular shape cannot be found and the grain spalling is inhibited. Therefore, the sample with 63% deformation mainly undergoes active dissolution, which is responsible for its negative discharge potential (−1.690 V vs. SCE) and high anodic efficiency at 180 mA cm−2.
It should be noted that the metal anode with high anodic efficiency could also exhibit large corrosion current density (Table 1), because the latter is on the basis of polarization curve at the corrosion potential, whereas the former is correlated with the applied current flowing through the electrode for long period, during which the surface condition of electrode is obviously changed.
3.4 Electrochemical impedance spectra (EIS)
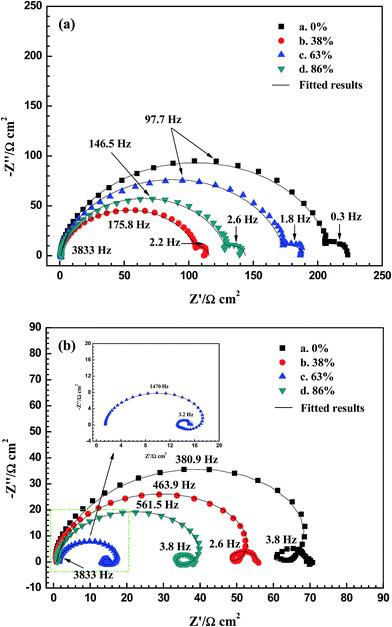
The EIS of the alloys at different potentials are given in Fig. 8. Each curve is characterized by two capacitive loops at OCP (Fig. 8(a)); the large loop in the high frequency range is related to the double layer (dl) and charge transfer process occurring at the electrode/electrolyte interface, while the small one at low frequencies is caused by the Mg(OH)2 film covered on the electrode surface.9,11,44 The diameter of large loop equals to the charge transfer resistance (Rct), which could reflect the corrosion resistance at OCP. To obtain the electrochemical parameters, the EIS at the OCPs are fitted using the equivalent circuit depicted in Fig. S7(a) in ESI,† in which the constant phase element (CPE) is employed for describing the frequency dependence of non-ideal capacitive behaviour.45 Table 4 displays the corresponding data and each specimen exhibits similar resistance of Mg(OH)2 film (Rf). However, different values of Rct are observed and the order of this resistance is in agreement with that of jcorr based on the polarization curves (Table 1), i.e., the larger the corrosion current density, the smaller the charge transfer resistance is.| Rolling reduction | Rs/(Ω cm2) | Rct/(Ω cm2) | Ydl/(Ω−1 cm−2 sn) | ndl | Rf/(Ω cm2) |
|---|---|---|---|---|---|
| 0% | 1 | 208 | 1.0 × 10⁻⁵ | 0.93 | 15 |
| 38% | 0.8 | 105 | 1.4 × 10⁻⁵ | 0.91 | 10 |
| 63% | 0.8 | 173 | 1.0 × 10⁻⁵ | 0.92 | 15 |
| 86% | 0.8 | 128 | 1.2 × 10⁻⁵ | 0.93 | 15 |
| Rolling reduction | Yf/(Ω−1 cm−2 sn) | nf |
|---|---|---|
| 0% | 7.0 × 10⁻³ | 1 |
| 38% | 3.0 × 10⁻³ | 1 |
| 63% | 7.0 × 10⁻³ | 1 |
| 86% | 5.0 × 10⁻³ | 1 |
Positively shifting the potential obviously changes the impedance response. According to Fig. 8(b), an induction loop appears at middle frequencies for each sample when the potential is 100 mV more positive than the OCP. This loop indicates the incubation of localized corrosion during anodic polarization,44 as confirmed by the surface morphologies shown in Fig. S6 in ESI.† In addition, the anodic potential shrinks the EIS of each specimen and the plate with 63% reduction has the smallest curve among the four samples (inserted figure). The equivalent circuit depicted in Fig. S7(b) in ESI† is used to fit these spectra and the results are listed in Table 5. The charge transfer resistance (Rct) under this condition reflects the discharge activity and the order of Rct is consistent with that of discharge potentials at 180 mA cm−2 (Table 2), i.e., the smaller the resistance, the more negative the discharge potential is. Additionally, the specimens with 0% and 38% deformation display larger values of Rf than the plates with 63% and 86% reductions, indicating that the Mg(OH)2 film of the first two alloys cannot be easily detached, as confirmed by the oxidized surfaces (Fig. 6). Another interesting note is that the plate with 63% reduction shows different impedance behaviour at low frequencies; its RL and L are significantly smaller than those of other samples, respectively. This phenomenon might be owing to the unique structure of 63% rolled sheet, which promotes the active dissolution during anodic polarization (Fig. 7(e) and (f)).
| Rolling reduction | Rs/(Ω cm2) | Rct/(Ω cm2) | Ydl/(Ω−1 cm−2 sn) | ndl | Rf/(Ω cm2) |
|---|---|---|---|---|---|
| 0% | 1 | 82 | 1.1 × 10⁻⁵ | 0.93 | 10 |
| 38% | 1 | 58 | 1.1 × 10⁻⁵ | 0.94 | 8 |
| 63% | 1.4 | 18 | 1.35 × 10⁻⁵ | 0.92 | 2.5 |
| 86% | 0.8 | 44 | 1.35 × 10⁻⁵ | 0.925 | 5.4 |
| Rolling reduction | Yf/(Ω−1 cm−2 sn) | nf | RL/(Ω cm2) | L/(H cm2) |
|---|---|---|---|---|
| 0% | 7.0 × 10⁻³ | 1 | 210 | 0.41 |
| 38% | 7.0 × 10⁻³ | 1 | 239 | 0.6 |
| 63% | 2.0 × 10⁻² | 1 | 35 | 0.031 |
| 86% | 1.0 × 10⁻² | 1 | 121 | 0.27 |
4. Conclusions
The discharge and corrosion behaviour of the AP65 alloys with different rolling reductions is investigated by electrochemical techniques and microstructure characterization. Pure magnesium is included for comparison. The results indicate that all AP65 samples exhibit stronger discharge activity and higher anodic efficiencies at 180 mA cm−2 than pure magnesium. The un-rolled AP65 alloy has large equiaxed grains and low dislocation density; it displays strong corrosion resistance but relatively weak discharge activity. The rolling with 38% reduction produces the uneven grain sizes in the plate; the distribution of crystal defects is not uniform, with several areas exhibiting several slip bands and high density of dislocations, while other regions stored many micro-scale sub-grains. This inhomogeneous microstructure greatly promotes the self-corrosion of AP65 alloy. After 63% deformation, the grains are uniformly refined and the Al8Mn5 particles are fractured; a lot of nanometer sub-grains distribute homogeneously in the matrix. Therefore, this sheet exhibits relatively small corrosion rate at Ecorr and undergoes active dissolution with high anodic efficiency at 180 mA cm−2. A large rolling reduction of 86% further refines the grains and obviously fractures the Al8Mn5 phase; however, high density of dislocations and enlarged sub-grains are also created, thus debasing the anode performance of AP65 alloy. Our results would enlighten the fabrication of magnesium plates used for high-power battery anodes.Conflicts of interest
There are no conflicts to declare.Acknowledgements
This work was financially supported by the National Natural Science Foundation of China (No. 51401243), a Special Financial Grant from the China Postdoctoral Science Foundation (No. 2015T80883), a General Financial Grant from the China Postdoctoral Science Foundation (No. 2014M552151), and the research foundation of Guangdong University of Technology.References
- R. Hahn, J. Mainert, F. Glaw and K. D. Lang, J. Power Sources, 2015, 288, 26–35 CrossRef CAS.
- N. Wang, R. Wang, C. Peng and Y. Feng, Corros. Sci., 2014, 81, 85–95 CrossRef CAS.
- Ø. Hasvold, T. Lian, E. Haakaas, N. Størkersen, O. Perelman and S. Cordier, J. Power Sources, 2004, 136, 232–239 CrossRef.
- Ø. Hasvold and N. Størkersen, J. Power Sources, 2001, 96, 252–258 CrossRef.
- R. Balasubramanian, A. Veluchamy, N. Venkatakrishnan and R. Gangadharan, J. Power Sources, 1995, 56, 197–199 CrossRef CAS.
- T. Zhang, Z. Tao and J. Chen, Mater. Horiz., 2014, 1, 196–206 RSC.
- D. Cao, L. Wu, Y. Sun, G. Wang and Y. Lv, J. Power Sources, 2008, 177, 624–630 CrossRef CAS.
- Y. Feng, W. Xiong, J. Zhang, R. Wang and N. Wang, J. Mater. Chem. A, 2016, 4, 8658–8668 CAS.
- D. Cao, L. Wu, G. Wang and Y. Lv, J. Power Sources, 2008, 183, 799–804 CrossRef CAS.
- M. Yuasa, X. Huang, K. Suzuki, M. Mabuchi and Y. Chino, J. Power Sources, 2015, 297, 449–456 CrossRef CAS.
- N. Wang, R. Wang, C. Peng, Y. Feng and B. Chen, Corros. Sci., 2012, 64, 17–27 CrossRef CAS.
- J. Zhao, K. Yu, Y. Hu, S. Li, X. Tan, F. Chen and Z. Yu, Electrochim. Acta, 2011, 56, 8224–8231 CrossRef CAS.
- K. Yu, X. Tan, Y. Hu, F. Chen and S. Li, Corros. Sci., 2011, 53, 2035–2040 CrossRef CAS.
- H. Xiong, K. Yu, X. Yin, Y. Dai, Y. Yan and H. Zhu, J. Alloys Compd., 2016, 708, 652–661 CrossRef.
- G. Huang, Y. Zhao, Y. Wang, H. Zhang and F. Pan, Mater. Lett., 2013, 113, 46–49 CrossRef CAS.
- J. Deng, G. Huang, Y. Zhao and B. Wang, Rare Met. Mater. Eng., 2014, 43, 316–321 CrossRef CAS.
- H. Zhao, P. Bian and D. Ju, J. Environ. Sci., 2009, 21, S88–S91 CrossRef.
- S. Liang, Y. Zhang, D. Guan, Y. Tang and Z. Mao, Trans. Nonferrous Met. Soc. China, 2010, 20, 942–949 CrossRef CAS.
- P. Wang, J. Li, Y. Guo, Z. Yang, F. Xia and J. Wang, Rare Met., 2011, 30, 639–643 CrossRef CAS.
- F. Zarandi, G. Seale, R. Verma, E. Essadiqi and S. Yue, Mater. Sci. Eng., A, 2008, 496, 159–168 CrossRef.
- N. Wang, R. Wang, C. Peng, B. Peng, Y. Feng and C. Hu, Electrochim. Acta, 2014, 149, 193–205 CrossRef CAS.
- M. C. Lin, C. Y. Tsai and J. Y. Uan, Corros. Sci., 2009, 51, 2463–2472 CrossRef CAS.
- A. Srinivasan, U. T. S. Pillai and B. C. Pai, Mater. Sci. Eng., A, 2007, 452–453, 87–92 CrossRef.
- G. B. Hamu, D. Eliezer and L. Wagner, J. Alloys Compd., 2009, 468, 222–229 CrossRef.
- D. Song, A. B. Ma, J. H. Jiang, P. H. Lin, D. H. Yang and J. F. Fan, Corros. Sci., 2011, 53, 362–373 CrossRef CAS.
- T. Chang, J. Wang, O. Chia-Ming and S. Lee, J. Mater. Process. Technol., 2003, 140, 588–591 CrossRef CAS.
- S. Sandlöbes, S. Zaefferer, I. Schestakow, S. Yi and R. Gonzalez-Martinez, Acta Mater., 2011, 59, 429–439 CrossRef.
- D. Song, A. Ma, J. Jiang, P. Lin, D. Yang and J. Fan, Corros. Sci., 2010, 52, 481–490 CrossRef CAS.
- X. Du and B. Wu, Sci. China, Ser. E: Technol. Sci., 2008, 52, 1751–1755 CrossRef.
- L. Lü, M. O. Lai and W. Liang, Compos. Sci. Technol., 2004, 64, 2009–2014 CrossRef.
- L. L. Chang, E. F. Shang, Y. N. Wang, X. Zhao and M. Qi, Mater. Charact., 2009, 60, 487–491 CrossRef CAS.
- X. N. Gu, W. R. Zhou, Y. F. Zheng, Y. Cheng, S. C. Wei, S. P. Zhong, T. F. Xi and L. J. Chen, Acta Biomater., 2010, 6, 4605–4613 CrossRef CAS PubMed.
- M. Jönsson, D. Thierry and N. LeBozec, Corros. Sci., 2006, 48, 1193–1208 CrossRef.
- M. C. Merino, A. Pardo, R. Arrabal, S. Merino, P. Casajús and M. Mohedano, Corros. Sci., 2010, 52, 1696–1704 CrossRef CAS.
- J. Liao, M. Hotta and N. Yamamoto, Corros. Sci., 2012, 61, 208–214 CrossRef CAS.
- N. N. Aung and W. Zhou, Corros. Sci., 2010, 52, 589–594 CrossRef CAS.
- M. Ben-Haroush, G. Ben-Hamu, D. Eliezer and L. Wagner, Corros. Sci., 2008, 50, 1766–1778 CrossRef CAS.
- Y. Ma, N. Li, D. Li, M. Zhang and X. Huang, J. Power Sources, 2011, 196, 2346–2350 CrossRef CAS.
- Y. Shi, C. Peng, Y. Feng, R. Wang and N. Wang, Mater. Des., 2017, 124, 24–33 CrossRef CAS.
- M. Andrei, F. d. Gabriele, P. L. Bonora and D. Scantlebury, Mater. Corros., 2003, 54, 5–11 CrossRef CAS.
- E. Ghali, W. Dietzel and K. U. Kainer, J. Mater. Eng. Perform., 2013, 22, 2875–2891 CrossRef CAS.
- G. Baril and N. Pebere, Corros. Sci., 2001, 43, 471–484 CrossRef CAS.
- M. Nestoridi, D. Pletcher, R. J. K. Wood, S. Wang, R. L. Jones, K. R. Stokes and I. Wilcock, J. Power Sources, 2008, 178, 445–455 CrossRef CAS.
- G.-L. Song, Corros. Sci., 2009, 51, 2063–2070 CrossRef CAS.
- C. H. Hsu and F. Mansfeld, Corrosion, 2001, 57, 747–748 CrossRef CAS.
Footnote |
| † Electronic supplementary information (ESI) available. See DOI: 10.1039/c7ra10652a |
| This journal is © The Royal Society of Chemistry 2017 |

