 Open Access Article
Compositional dependence of ferromagnetic and magnetoelectric effect properties in BaTiO3–BiFeO3–LaFeO3 solid solutions†
Xiwei Qi *abc,
Min Zhang*a,
Xiaoyan Zhangbc,
Yaohang Gua,
Hongen Zhub,
Weicheng Yanga and
Ying Liad
aSchool of Materials Science and Engineering, Northeastern University, Shenyang 110819, China. E-mail: qxw@mail.neuq.edu.cn; minzhang1992@126.com
bSchool of Resources and Materials, Northeastern University at Qinhuangdao, Qinhuangdao 066004, China
cKey Laboratory of Dielectric and Electrolyte Functional Materials Hebei Province, School of Resources and Materials, Northeastern University at Qinhuangdao, Qinhuangdao 066004, China
dSchool of Science, Inner Mongolia University of Science and Technology, Baotou 014010, China
First published on 7th November 2017
Abstract
Multiferroic ceramics consisting of barium titanate (BaTiO3, BT), bismuth ferrite (BiFeO3, BFO), and lanthanum ferrite (LaFeO3, LFO), namely (1 − x)(0.96BaTiO3–0.04BiFeO3)–xLaFeO3 (BT–BFO–xLFO, where x = 0.1–0.5), were synthesized by the sol–gel method. The crystal structure, microstructure, and dielectric, ferromagnetic, and magnetoelectric properties of the ceramics were systematically investigated. Structural analysis of BT–BFO–xLFO solid solution showed a pure perovskite structure. The Rietveld refined XRD data fitted well with an orthorhombic structure (Pbnm space group). BT–BFO–0.4LFO and BT–BFO–0.5LFO exhibited initial dielectric constants of 2114 and 1741, respectively, at 20 Hz, followed by fast decay with increasing frequency. In comparison, the BT–BFO–xLFO ceramics with x = 0.1–0.3 showed excellent stability. Remarkably improved ferromagnetic properties were obtained for BT–BFO–0.4LFO, and the remnant magnetization increased from 0.008 to 0.666 emu g−1 when x was increased from 0.1 to 0.4. The maximum value of the magnetoelectric coefficient reached 354 mV (cm−1·Oe−1) for the ceramic with x = 0.4 at 1000 kHz and 1 kOe.
1. Introduction
The coexistence of ferroelectric, ferromagnetic, and ferroelastic ordering in multiferroic materials makes them popular materials for transformers, sensors, and information storage.1 In multiferroics, a magnetoelectric (ME) material is one whose ferroelectric and ferromagnetic order parameters are coupled.2–5 There are a few ME multiferroic materials which have attracted the attention of many researchers.The rhombohedral perovskite bismuth ferrite (BiFeO3, BFO) is a single-phase ME material. It has high Neel (TN = 370 °C) and Curie temperatures (TC = 830 °C).6,7 However, two factors hinder its use in applications: persistent formation of impurity phases and large leakage current.8 Therefore, many studies have been carried out to improve the electric insulation and prevent the formation of impurity phases, including partial substitution of A sites9,10 and B sites11 and the formation of solid solutions of BiFeO3 with other ABO3-type perovskites.12–14 The solid solution of barium titanate (BaTiO3, BT) and BFO (BT–BFO) has been extensively studied.14–17
In our previous work,18 we reported the fabrication of binary solid solutions of (1 − x)BT–xBFO (x = 0–0.07). The ceramic with BFO content of x = 0.04 exhibited enhanced ferroelectric properties with remnant polarization (Pr) of 16.74 μC cm−2. Although the BT–BFO system possesses high ferroelectric properties, its use in practical applications still faces many issues. For example, BT–xBFO ceramics exhibit extremely low ferromagnetic properties, and the ceramic with x = 0.04 exhibits the highest magnetoelectric coupling coefficient of 298.8 mV (cm−1·Oe−1) at 900 kHz and 1000 Oe, which is too small for practical applications. In order to improve the ferromagnetic properties, many different modifications were carried out on the BT–BFO system. Jiang et al.19 found that the ferromagnetism of the materials was greatly enhanced by doping them with SmCoO3, which resulted in a remnant magnetism (Mr) of 0.136 emu g−1 for 0.75BiFeO3–0.25BaTiO3 and 0.389 emu g−1 for 0.68BiFeO3–0.25BaTiO3–0.07SmCoO3. Tian et al.9 reported that Eu-modified (1 − x)BiFeO3–xBaTiO3 ceramics exhibited improved Mr of 0.136 emu g−1. Other ceramics like BiFeO3–ReFeO3–BaTiO3 (Re = Dy, Pr, or La)20 were also investigated systematically, and the most remarkable ferromagnetic ferroelectrics obtained in this study were 0.65BiFeO3–0.025DyFeO3–0.325BaTiO3 (Pr = 5 μC cm−2, Mr = 0.1 emu g−1) and 0.475BiFeO3–0.05LaFeO3–0.475BaTiO3 (Pr = 3.2 μC cm−2, Mr = 0.2 emu g−1). Double modifications of the BT–BFO system were carried out using PrFeO3 and DyFeO3,21 producing 0.4BiFeO3–0.1PrFeO3–0.1DyFeO3–0.4BaTiO3 with Pr = 4.2 μC cm−2 and Mr = 0.04 emu g−1.
Lanthanum ferrite (LaFeO3, LFO) is an orthorhombically distorted perovskite structure with antiferromagnetic characteristics.22–24 It exhibits a high Neel temperature (TN = 467 °C) and a colossal dielectric constant.25 Since the radii of a La3+ ion (1.032 Å) and a Ba2+ ion (1.35 Å) are almost the same, LFO is a promising candidate for improving the ferromagnetic properties of ME materials. The addition of the antiferromagnetic LFO into the BT–BFO system is expected to improve the ferromagnetic and magnetoelectric properties.
Therefore, (1 − x)(0.96BaTiO3–0.04BiFeO3)–xLaFeO3 (BT–BFO–xLFO) (x = 0.1–0.5) ternary system was synthesized in this work, and its structure, microstructure, dielectric properties, ferromagnetic properties, and magnetoelectric coupling properties were studied systematically.
2. Experimental
A series of (1 − x)(0.96BaTiO3–0.04BiFeO3)–xLaFeO3 (BT–BFO–xLFO) (x = 0.1–0.5) multiferroic materials were prepared using the sol–gel method. Stoichiometric amounts of Bi(NO3)3·5H2O (>99.0%), Fe(NO3)3·9H2O (>98.5%), Ba(OH)2·8H2O (>98.0%), Ti(OC4H9)4 (>98.0%), and C6H8O7·H2O (>99.5%) were dissolved in a mixture solvents (C2H6O (>95.0%)![[thin space (1/6-em)]](https://www.rsc.org/images/entities/char_2009.gif) :
:![[thin space (1/6-em)]](https://www.rsc.org/images/entities/char_2009.gif) C2H6O2 (>99.0%) = 3
C2H6O2 (>99.0%) = 3![[thin space (1/6-em)]](https://www.rsc.org/images/entities/char_2009.gif) :
:![[thin space (1/6-em)]](https://www.rsc.org/images/entities/char_2009.gif) 7) to form a clear solution. The solutions were first stirred for 2 h at 25 °C, then dried at 100 °C in a furnace and calcined at 750 °C for 3 h. After the calcined fine powders were sieved, the powders mixed with a 5 wt% polyvinyl alcohol binder solution and pressed into pellets. These pellets were heated at 500 °C for 3 h to eliminate the binder before they were sintered at 1300 °C for 2 h. Silver electrodes were fired on both surfaces at 600 °C for 30 min.
7) to form a clear solution. The solutions were first stirred for 2 h at 25 °C, then dried at 100 °C in a furnace and calcined at 750 °C for 3 h. After the calcined fine powders were sieved, the powders mixed with a 5 wt% polyvinyl alcohol binder solution and pressed into pellets. These pellets were heated at 500 °C for 3 h to eliminate the binder before they were sintered at 1300 °C for 2 h. Silver electrodes were fired on both surfaces at 600 °C for 30 min.
The crystalline structure of the ceramics was measured using X-ray diffraction (XRD; SmartLab, Rigaku, Japan). The microstructures and the corresponding selected-area electron diffraction were observed by scanning electron microscopy (SEM; ZEISS SUPRA-55, Zeiss, Germany) and transmission electron microscopy (TEM; Tecnai G2 F20, FEI, USA). The frequency dependence of the dielectric constant and dielectric loss was studied using a LCR meter (Agilent E4980A, Agilent Technologies Inc., Canada). The leakage-current density was tested by Keithley electrometer (6517B, Keithley Instruments Inc., USA). The ferroelectric hysteresis loops were measured at 1 kHz and room temperature with a Radiant Multiferroic tester (Multiferroic, Radiant Technologies Inc., USA). The magnetic hysteresis (M–H) loops were measured using a magnetic measurement instrument (JDAW-2000C&D, Changchun Yingpu Magnetoelectricity Technology Co., China). The magnetoelectric coefficient was determined using the direct-current (DC) static with various magnitudes magnetic field and frequencies.
3. Results and discussion
To reveal the structure of BT–BFO–xLFO (x = 0.1–0.5) ceramics, the XRD patterns are shown in Fig. 1. As shown in Fig. 1(a), all samples display a pure perovskite structure with orthorhombic phase peaks. The (022) and (200) peaks are magnified in Fig. 1(b), and it can be seen that the peaks shift toward higher 2θ with an increase of x. This can be attributed to the ionic radius of La3+ (1.032 Å) is smaller than Ba2+ (1.35 Å). Rietveld refinements are carried out using FullProf software (Institut Laue-Langevin, France) to help us further understand the structural characteristics of the BT–BFO–xLFO (x = 0.1–0.5) ceramics; which are shown in Fig. 1(c) and S1.† The Rietveld refined XRD data was well fitted with orthorhombic structure (Pbnm space group). The variations in the lattice parameters obtained from the XRD data are shown in Table 1. For all of the refinements, small values are obtained for the reliability of the weight pattern (Rwp = 6.13–9.74%, i.e. Rwp < 15%) and the goodness-of-fit indicator (S = 1.13–1.55, i.e. S < 2), suggesting a good match between the observed and calculated patterns.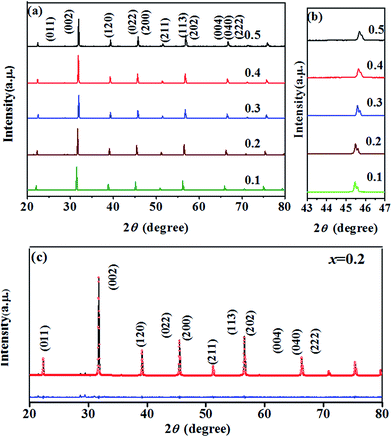 | ||
| Fig. 1 XRD patterns of the BT–BFO–xLFO (x = 0.1–0.5) ceramics sintered at 1300 °C in the 2q range of (a) 20–80° (b) 43–47° and (c) Rietveld refined of x = 0.2. | ||
| x | Lattice parameters | R factors (%) | |||
|---|---|---|---|---|---|
| a (Å) | b (Å) | c (Å) | Rwp | S | |
| 0.1 | 5.6482 | 5.6448 | 3.9904 | 8.02 | 1.42 |
| 0.2 | 5.6360 | 5.6339 | 3.9824 | 9.74 | 1.55 |
| 0.3 | 5.6241 | 5.6283 | 3.9758 | 7.72 | 1.19 |
| 0.4 | 5.6103 | 5.6070 | 3.9680 | 6.13 | 1.14 |
| 0.5 | 5.6036 | 5.5988 | 3.9584 | 6.13 | 1.13 |
To reveal the fracture surface of the BT–BFO–xLFO (x = 0.1–0.5) ceramics, the SEM images are shown in Fig. 2. The samples exhibit dense and homogeneous microstructures. To further confirm the crystal structure and grain size of the BT–BFO–xLFO ceramics, TEM has been used to characterization. Selected typical composition of LFO with 0.2, namely BT–BFO–0.2LFO. Fig. 3 shows the bright-field images and corresponding SAED patterns of BT–BFO–0.2LFO. It exhibits two types of grains: larger grains with the apparent average values in the range of 1–2 μm and the smaller grain size with the nanometer sizes, as shown in Fig. S3(a and b).† Even though their grains are different, their structure are the same just as shown in Fig. 3(b and d). The high-resolution TEM (HRTEM) image in Fig. 3(a) shows a uniform lattice fringe with a d-spacing of 0.401 nm, which is a good match to the (011) plane of the orthorhombic lattice. The interplanar spacing values (d) of the selected area electron diffraction (SAED) (Fig. 3(b) and (d)) patterns well matched with the standard values calculated from the XRD. These results confirm the orthorhombic structure of the BT–BFO–0.2LFO sample.
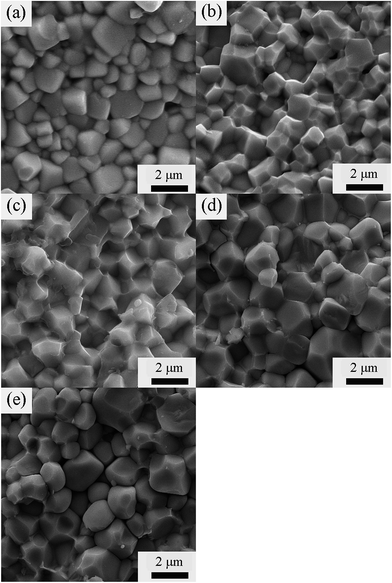 | ||
| Fig. 2 SEM images of the BT–BFO–xLFO ceramics sintered at 1300 °C with (a) x = 0.1, (b) x = 0.2, (c) x = 0.3, (d) x = 0.4, (e) x = 0.5. | ||
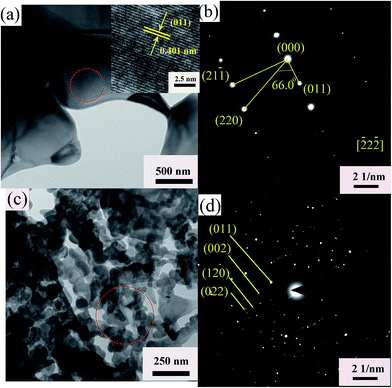 | ||
| Fig. 3 (a, c) TEM bright field images and (b, d) corresponding electron diffraction patterns of BT–BFO–0.2LFO ceramics. | ||
The relative dielectric constant εr and the dielectric loss tan![[thin space (1/6-em)]](https://www.rsc.org/images/entities/char_2009.gif) δ of the BT–BFO–xLFO (x = 0.1–0.5) ceramics are shown in Fig. 4. It is evident that both εr and tan
δ of the BT–BFO–xLFO (x = 0.1–0.5) ceramics are shown in Fig. 4. It is evident that both εr and tan![[thin space (1/6-em)]](https://www.rsc.org/images/entities/char_2009.gif) δ decreases with increasing frequency. In the low-frequency range, εr and tan
δ decreases with increasing frequency. In the low-frequency range, εr and tan![[thin space (1/6-em)]](https://www.rsc.org/images/entities/char_2009.gif) δ has higher values, but both gradually decreases as the frequency increased from 20 to 104 Hz. At frequencies above 104 Hz, the decrease in εr and tan
δ has higher values, but both gradually decreases as the frequency increased from 20 to 104 Hz. At frequencies above 104 Hz, the decrease in εr and tan![[thin space (1/6-em)]](https://www.rsc.org/images/entities/char_2009.gif) δ became slow and keep constant at 105 Hz for all compositions. These variations occurred due to the dipoles could easily change in the lower frequencies, but they did not have sufficient time to align at higher frequencies, thus resulting in the decreases in εr and tan
δ became slow and keep constant at 105 Hz for all compositions. These variations occurred due to the dipoles could easily change in the lower frequencies, but they did not have sufficient time to align at higher frequencies, thus resulting in the decreases in εr and tan![[thin space (1/6-em)]](https://www.rsc.org/images/entities/char_2009.gif) δ. When the frequency was 20 Hz, the initial dielectric constants of BT–BFO–0.4LFO and BT–BFO–0.5LFO are 2114 and 1741, respectively; however, they decrease quickly with increasing frequency. The ceramics with x = 0.1–0.3 showed much more stable dielectric constants. As shown in Fig. 4(b), the measured tan
δ. When the frequency was 20 Hz, the initial dielectric constants of BT–BFO–0.4LFO and BT–BFO–0.5LFO are 2114 and 1741, respectively; however, they decrease quickly with increasing frequency. The ceramics with x = 0.1–0.3 showed much more stable dielectric constants. As shown in Fig. 4(b), the measured tan![[thin space (1/6-em)]](https://www.rsc.org/images/entities/char_2009.gif) δ had low values of <1.0 for ceramic samples of all compositions from 104 Hz to 106 Hz.
δ had low values of <1.0 for ceramic samples of all compositions from 104 Hz to 106 Hz.
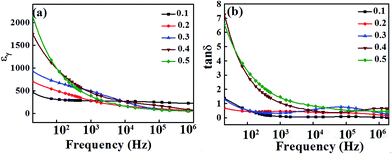 | ||
Fig. 4 (a) Relative dielectric constant εr and (b) dielectric loss tan![[thin space (1/6-em)]](https://www.rsc.org/images/entities/char_2009.gif) δ of BT–BFO–xLFO (x = 0.1–0.5) ceramics sintered at 1300 °C. δ of BT–BFO–xLFO (x = 0.1–0.5) ceramics sintered at 1300 °C. | ||
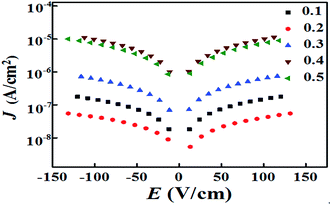
To reveal the electric insulation of the ceramics, the leakage current density (J) is shown in Fig. 5. The ceramic with x = 0.1 exhibited low J values of 10−6–10−7 A cm−2. For the ceramic with x = 0.2, the leakage-current density was 10−7–10−8 A cm−2, which was decreased almost one order of magnitude. However, for ceramic samples with x = 0.3–0.5, the transformation of Fe ions in LaFeO3 from Fe3+ to Fe2+ created oxygen vacancies, which resulted in high conductivity and J linearly increased to 10−5–10−6 A cm−2.
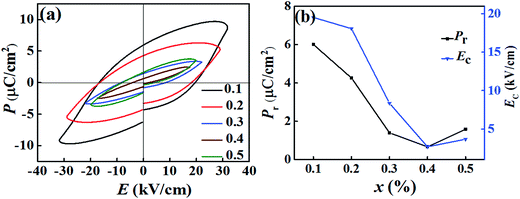
In order to study the ferroelectric behavior of the BT–BFO–xLFO (x = 0.1–0.5) ceramics, the polarization hysteresis (P–E) loops were measured at a frequency of 1 kHz, are shown in Fig. 6. It has been known that it is difficult to obtain well-saturated ferroelectric loops when the leakage currents are high. Therefore, our system was never left to reach full saturation and the polarization values generally remained low. The remnant polarization of the BT–BFO–xLFO (x = 0.1–0.5) ceramics decreased from 6.00 to 0.67 μC cm−2 as x increased from 0.1 to 0.5. During the measurements, higher fields were not applied because of the high leakage-current densities of the samples.
Substitution is known to be an effective way to enhance the ferromagnetic properties of BFO. To investigate the effect of substitution on the magnetic properties, magnetic-field (M–H) hysteresis loops of the BT–BFO–xLFO (x = 0.1–0.5) ceramics are shown in Fig. 7. All the ceramic samples exhibited typical magnetization hysteresis loops, suggesting that they simultaneously possessed ferromagnetism and ferroelectricity. Fig. 7(a) indicates that the ceramic with x = 0.1 exhibited weak ferromagnetism, and the observed remnant magnetization (Mr) and coercive field (Hc) were 0.008 emu g−1 and 277 Oe, respectively. For the ceramic with x = 0.4, the ferromagnetism was significantly higher, with Mr of 0.666 emu g−1 and Hc of 142 Oe. However, excess LFO degraded the ferromagnetism of the ceramics. For the ceramic with x = 0.5, Mr decreased to 0.300 emu g−1 and Hc had a value of 161 Oe. Generally speaking, the magnetic properties of LaFeO3 originate from the interactions between the magnetic moments of iron and the rare-earth atom La.26 When the amount of LFO was increased, the mismatch in ionic radii (Fe versus Ti) and the multiple valance states of Ba2+/La3+ or Fe3+/Ti4+ decrease the remnant magnetization.
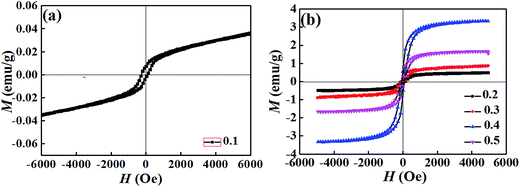 | ||
| Fig. 7 M–H loops of BT–BFO–xLFO (x = 0.1–0.5) ceramics sintered at 1300 °C with (a) x = 0.1, (b) x = 0.2–0.5. | ||
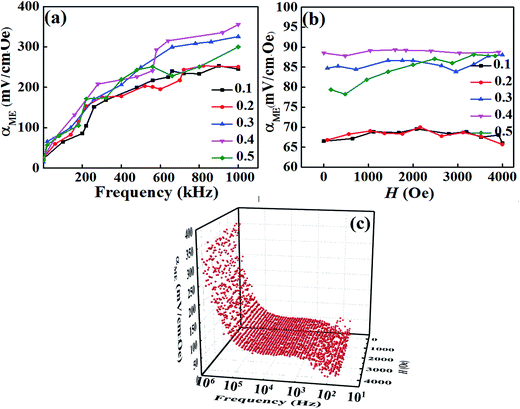
The observation of ferromagnetic and ferroelectric properties simultaneously indicate existing magnetoelectric coupling in this compound. Fig. 8 shows the magnetoelectric coefficient (αME) at various DC magnetic fields and frequencies for the BT–BFO–xLFO (x = 0.1–0.5) ceramics. The value of αME increased when the frequency increased from 0 to 1000 kHz, but it exhibited weak dependence on the magnetic field except x = 0.5. The 3D image of BT–BFO–0.4LFO ceramic in Fig. 8(c) exhibits the same tendency. In Fig. 8(a), the ceramic with x = 0.1 exhibited a low αME of 252 mV (cm−1·Oe−1) at the frequency 900 kHz, which can be ascribed to the poor ferromagnetic property (Fig. 7(a)). After the addition of more LFO (x = 0.4), the observed αME significantly increased to the maximum value of 354 mV (cm−1·Oe−1) at 1000 kHz and 1000 Oe. Compared with BFO–BT–0.1LFO, the αME value of BFO–BT–0.4LFO was 40.48% higher owing to the better ferroelectric and ferromagnetic properties. For the ceramic with x = 0.5, the observed αME was slightly lower, with a value of 300 mV (cm−1·Oe−1) at 1000 kHz and 1000 Oe. The sample exhibited weak ME behaviour because of the significantly degraded ferromagnetic property.
4. Conclusion
A large magnetoelectric coefficient αME of 354 mV (cm−1·Oe−1) associated with high remnant magnetization Mr of 0.666 emu g−1 is reported in BT–BFO–0.4LFO ceramics. LFO doping has significantly improved ferromagnetic and magnetoelectric properties. Certainly, the present strategy is transferable. We believe that it would inspire plentiful researches on tailoring performance by means of properly modified.Conflicts of interest
There are no conflicts to declare.Acknowledgements
This work was financially supported by the National Nature Science Foundation of China (No. 51474061).References
- W. Eerenstein, N. D. Mathur and J. F. Scott, Nature, 2006, 442, 759–765 CrossRef CAS PubMed.
- T. Kimura, T. Goto, H. Shintani, K. Ishizaka, T. Arima and Y. Tokura, Nature, 2003, 426, 55–58 CrossRef CAS PubMed.
- J. Zhai, Z. Xing, S. Dong, J. Li and D. Viehland, J. Am. Ceram. Soc., 2008, 91, 351–358 CrossRef CAS.
- M. J. Miah, M. N. I. Khan and A. K. M. A. Hossain, J. Magn. Magn. Mater., 2016, 401, 600–611 CrossRef CAS.
- L. Luo, L. Zhou, X. Zou, Q. Zheng and D. Lin, J. Mater. Sci.: Mater. Electron., 2015, 26, 9451–9462 CrossRef CAS.
- P. Fischer, M. Polomska, I. Sosnowska and M. Szymanski, J. Phys. C: Solid State Phys., 1980, 13, 1931–1940 CrossRef CAS.
- R. Palai, R. S. Katiyar, H. Schmid, P. Tissot, S. J. Clark, J. Robertson, S. A. T. Redfern, G. Catalan and J. F. Scott, Phys. Rev. B, 2008, 77, 014110 CrossRef.
- Y. P. Wang, L. Zhou, M. F. Zhang, X. Y. Chen, J. M. Liu and Z. G. Liu, Appl. Phys. Lett., 2004, 84, 1731–1733 CrossRef CAS.
- M. Tian, L. Zhou, X. Zou, Q. Zheng, L. Luo, N. Jiang and D. Lin, J. Mater. Sci.: Mater. Electron., 2015, 26, 8840–8847 CrossRef CAS.
- Q. R. Yao, Y. H. Shen, P. C. Yang, H. Y. Zhou, G. H. Rao, Z. M. Wang and J. Q. Deng, Ceram. Int., 2016, 42, 6100–6106 CrossRef CAS.
- L. Y. Zhang, J. Zhang, Y. F. Chang, G. L. Yuan, B. Yang, S. T. Zhang and X. Tan, J. Am. Ceram. Soc., 2016, 99, 2989–2994 CrossRef CAS.
- D. A. Rusakov, A. M. Abakumov, K. Yamaura, A. A. Belik, G. Van Tendeloo and E. Takayama-Muromachi, Chem. Mater., 2011, 23, 285–292 CrossRef CAS.
- W. L. Zheng, L. L. Zhang, Y. Lin, Z. Shi, F. Cao, G. L. Yuan and J. Yu, J. Mater. Sci.: Mater. Electron., 2016, 27, 12067–12073 CrossRef CAS.
- M. M. Kumar, S. Srinath, G. S. Kumar and S. V. Suryanarayana, J. Magn. Magn. Mater., 1998, 188, 203–212 CrossRef.
- Y. X. Wei, X. T. Wang, J. T. Zhu, X. L. Wang and J. J. Jia, J. Am. Ceram. Soc., 2013, 96, 3163–3168 CAS.
- H. Qin, H. Zhang, B. P. Zhang, L. Xu and P. Gouma, J. Am. Ceram. Soc., 2011, 94, 3671–3674 CrossRef CAS.
- S. O. Leontsev and R. E. Eitel, J. Am. Ceram. Soc., 2009, 92, 2957–2961 CrossRef CAS.
- M. Zhang, X. Y. Zhang, X. W. Qi, Y. Li, L. Bao and Y. H. Gu, Ceram. Int., 2017, 43, 16957–16964 CrossRef CAS.
- N. Jiang, M. Tian, L. Luo, Q. Zheng, D. Shi, K. H. Lam, C. Xu and D. Lin, J. Electron. Mater., 2015, 45, 291–300 CrossRef.
- J. S. Kim, C. I. Cheon, C. H. Lee and P. W. Jang, J. Appl. Phys., 2004, 96, 468–474 CrossRef CAS.
- J. S. Kim, C. I. Cheon, W. S. Oh and P. W. Jang, Phys. Status Solidi B, 2004, 241, 1629–1632 CrossRef CAS.
- E. Dogdibegovic, Q. Cai, W. J. James, W. B. Yelon, H. U. Anderson, J. B. Yang, X. D. Zhou and B. Raveau, J. Am. Ceram. Soc., 2016, 99, 2035–2039 CrossRef CAS.
- W. J. Zheng, R. H. Liu, D. K. Peng and G. Y. Meng, Mater. Lett., 2000, 43, 19–22 CrossRef CAS.
- A. Scholl, J. Stohr, J. Luning, J. W. Seo, J. Fompeyrine, H. Siegwart, J. P. Locquet, F. Nolting, S. Anders, E. E. Fullerton, M. R. Scheinfein and H. A. Padmore, Science, 2000, 287, 1014–1016 CrossRef CAS PubMed.
- S. Acharya, J. Mondal, S. Ghosh, S. K. Roy and P. K. Chakrabarti, Mater. Lett., 2010, 64, 415–418 CrossRef CAS.
- Z. X. Wei, Y. Wang, J. P. Liu, C. M. Xiao, W. W. Zeng and S. B. Ye, J. Mater. Sci., 2012, 48, 1117–1126 CrossRef.
Footnote |
| † Electronic supplementary information (ESI) available. See DOI: 10.1039/c7ra10563k |
| This journal is © The Royal Society of Chemistry 2017 |

