
 Open Access Article
 This Open Access Article is licensed under a Creative Commons Attribution-Non Commercial 3.0 Unported Licence
Red phosphor based on Eu3+-isoelectronically doped Ba2SiO4 obtained via sol–gel route for solid state lightning†
Airton G. Bispo Jr.ab,
Diego A. Ceccatoab,
Sergio A. M. Lima ab and
Ana. M. Pires*ab
ab and
Ana. M. Pires*ab
aSão Paulo State University (Unesp), School of Technology and Sciences, R. Roberto Simonsen, 305, Presidente Prudente, SP 19060-900, Brazil. E-mail: anapires@fct.unesp.br; Tel: +55 1832295748
bSão Paulo State University (Unesp), Institute of Biosciences, Humanities and Exact Sciences, São José do Rio Preto, SP 15054-000, Brazil
First published on 21st November 2017
Abstract
The present paper reports on the effect of Eu3+ concentration (1–5%, considering a charge compensation mechanism) on the structural, morphological and spectroscopic properties of Ba2SiO4 produced by using a novel approach that involves an adapted sol–gel route. XRD data showed that high crystalline and single phase doped Ba2SiO4 samples were prepared at lower calcination temperature (1100 °C) compared to the standard solid-state method (∼1300 °C). FTIR, Raman and DRS analyses indicated that the Ba2+ replacement by Eu3+ ions causes punctual structural defects in the Ba2SiO4 lattice, which particles observed by SEM imaging have irregular shape characteristics for the use of the acid-catalyzed sol–gel method. Optical bandgap values evaluated by DRS measurements of the red phosphors are smaller (∼4.5 eV) than that of the nominally pure matrix (∼5.8 eV), evidencing that Eu3+ ions increase Ba2SiO4 structural/electronic defects. The detailed analysis of the f–f Eu3+ narrow transitions in the photoluminescence spectra showed that doping ions occupy at least two non-equivalent sites without an inversion center in the Ba2SiO4 host. Moreover, the 5% doped sample also exhibited a third Eu3+ anomalous site assigned to the Eu3+–O2− associates, which has a spectral behavior distinct from Eu3+ occupying ordinary host lattice sites. Finally, the 4%-doped sample exhibited the highest relative emission intensity while the 5%-doped, the highest quantum efficiency (72.6%) which qualifies these materials as potential candidates to be used as red phosphors for solid state lightning.
Introduction
Nowadays the use of solid state devices for lighting is increasing drastically because of their advantages over incandescent and fluorescent light bulbs, i.e., high brightness, mercury-free composition, relatively small size, low power consumption and long lifespan.1–3 In this context, LED lights stand out due to their relative ease of device manufacture and versatility of application mainly in digital displays, liquid crystal devices, headlight vehicles, road lights, public and residential lighting.4–6 LED operation is based on spontaneous light emission in semiconductors originating from electron–hole recombination produced by the passage of electric current.7 Thus, luminescent nanostructured phosphors have taken an important role in the advance of solid devices technology because they exhibit great potential for application in high-performance displays like white LEDs (WLEDs).8,9 The commercially available WLEDs are based on two different design approaches (i) based on the white emission of the semiconductor or, (ii) based on a combination of colors emitted by different phosphors excited by the semiconductor. For the second approach, the combination of green, red and/or yellow phosphors plus a blue/near UV emission of the semiconductor gives the observer a sense of white light when they simultaneously emit.10 Y3Al5O12:Ce3+(YAG:Ce3+) and (Sr,Ba)SiO4:Eu2+ are reported in the literature as the main yellow phosphors, Lu3Al5O12:Ce3+(LuAG:Ce3+) and (Ba,Sr)SiO4:Eu2+ as the green ones, and (Sr,Ba)2Si5N8:Eu2+ and (Sr,Ca)SiAlN3:Eu2+ as the main red emitters.11 The most common WLED commercially available in the present days, is based on a combination of a blue LED and the yellow phosphor YAG:Ce3+.11 However, such device has poor color-rendering index (CRI) and low stability of the correlated color temperature (CCT). In this sense, the use of ultraviolet LEDs are emerging because the human eye does not see the UV light, solving the color-rendering index problem.12 Examples of UV LEDs include: GaN and AlN with bandgap equal to 3.4 eV (362 nm) and 6.2 eV (200 nm). The last one is suitable to excite Eu(III) phosphors as Ba2SiO4:Eu3+.13Materials based on silicates have been considered an especial class of compounds with great potential for application in optical devices like white LEDs, especially those doped with lanthanide ions, due to their high thermal and chemical stability, transparency for visible light, relative low phonon frequency, and ease preparation.14–16 For instance, Eu2+-doped Ba2SiO4 phosphors have been considered for LED application, but little attention has been paid for Eu3+-doped Ba2SiO4,11 since they cannot be efficiently excited by near UV or blue light. However, with the emergence of high energy UV LEDs chip in the last years, Eu3+-phosphors are being considered as LEDs components.13 Eu3+ ion is a red emitter and also may act as a structural probe in phosphors due to its well-known spectroscopic behavior exhibiting optical transitions that are usually narrow and sensitive to the crystal field around the ion.17–19 Eu3+-doped orthosilicate phosphors, such as Ba2SiO4 and BaZnSiO4, synthesized by conventional solid state reaction had already been investigated and showed interesting optical properties.20–22 However, reports on the use of Eu3+ in such systems is uncommon since Eu2+ ions are more suitable to substitute for divalent barium in silicate lattices synthesized under reducing atmosphere yielding a phosphor with green-bluish emission. In addition, the majority of reports involves phosphors obtained via solid state synthesis instead of the sol–gel methodology, which is considered a versatile and convenient low-temperature process to produce different type of materials, including the luminescent ones.23–25 For the best of our knowledge, there is no paper reported in the literature about the use of the sol–gel route to prepare Eu3+-doped orthosilicates, while several papers report on the obtainment of Eu2+-doped orthosilicates, such as the sub-microsized (Ba,Sr)2SiO4:Eu2+ phosphors prepared by the sol–gel/Pechini method and their solid solutions,26,27 and the Eu2+-doped M2SiO4 (M = Ca, Ba) phosphors obtained by a rapid microwave-assisted approach.28 Complementally, we have recently published a study showing a successful synthesis of barium- and europium-doped silica xerogel obtained via the sol–gel process, and its use as an electro catalytic sensor.29 Furthermore, we have also found out that this xerogel can be a suitable precursor for obtaining either doped or undoped Ba2SiO4 phase. However, one of the challenges to be overcome is the sol–gel route adjustment to yield single phased silicate red phosphor avoiding undesirable spurious phases, such as carbonate one. Therefore, considering the advantages of the sol–gel synthesis and the lack of information in the literature related to Eu3+-doped barium silicate, we report in this paper the synthesis of Ba2SiO4:Eu3+ red phosphor via the sol–gel route, and its morphological, structural and spectroscopic characterization aiming the improvement of its properties for use in optical devices, such as white LEDs.
Experimental
Pure Ba2SiO4 and Eu3+-doped Ba2SiO4 were synthesized via an adapted sol–gel route29 by using Ba(CH3COO)2 (VETEC, 99.9%), Eu2O3 (Aldrich, 99.99%), C8H20O4Si, (TEOS, Fluka, 99.9%), and CH3COOH (VETEC, 97%), as starting reactants. Europium acetate was prepared by dissolving europium oxide in stoichiometric quantities of hot acetic acid. For the synthesis of the gel, stoichiometric amount of barium and europium acetate were dissolved in 10 mL of acetic acid in order to obtain 2.0000 g of BaxEuySiO4. The Eu3+ concentration was isoelectronically varied from 1 to 5%, i.e., keeping the same overall charge in the Ba2SiO4 matrix in relation to the Ba2+ ion, according to the Ba2+, Eu3+ and SiO44− charges (3nEu3+ + 2nBa2+ = +4, where nBa2+ and nEu3+ are the mol number of Ba2+ and Eu3+, respectively). The calculated amounts of reagents and the detailed description of this calculus can be found in the ESI, Table ES1.† Then, a stoichiometric amount of TEOS dissolved in 10 mL of isopropyl alcohol was added. Finally, 0.4 mL of deionized water was introduced to initiate hydrolysis reactions. Acetic acid was used as both solvent and catalyst. The mixture was kept under stirring for 4 h at room temperature until gel formation; the gel was thermally treated at 100 °C in a static air atmosphere for 2 hours to allow solvent evaporation resulting in the xerogel phases. Then, xerogel precursor samples were pre-calcinated at 450 °C in a circulating air atmosphere with a heating ramp of 10 °C min−1 for 2 hours, and then, calcinated at 1100 °C in a circulating air atmosphere with a heating ramp of 10 °C min−1 for 2 hours. The calcination temperature was previously determined by thermal analysis measurements.29 A non-doped sample was synthesized as a control.All samples were structurally characterized by X-ray diffraction (XRD) using a SIEMENS diffractometer model D5000, CuKα radiation (λ = 1.5405 Å), a 2θ range of 20–50°, an increment of 0.02° and integration time of 1 s. The crystallite size of all produced powder samples was evaluated via Scherrer's method described in the ESI.†
Samples were also molecularly and morphologically investigated by Fourier Transform Infrared Spectroscopy (FTIR) using a Shimadzu Spectrometer IRAffinity-1 model and the samples were prepared in KBr pellets, Raman spectroscopy using a micro-Raman spectrograph Renishaw, in-Via model, with a 514 nm laser and scanning electron microscopy (SEM) using a Carls Zeiss model EVO LS15 microscope with a detector of secondary electrons (SE) in high vacuum and constant temperature.
The optical behavior of all samples was checked by diffuse reflectance spectroscopy in the UV-Vis region (DR) using a spectrometer Cary 500 Scan model (UV-VIS-NIR spectrophotometer) and also by photoluminescence measurements at room temperature carried out in a Horiba Jobin Yvon spectrometer Fluorolog-3 with a Xe lamp (450 W) source with double excitation monochromator. Emission lifetime was evaluated using a phosphorimeter equipped with Xe (5 J per pulse) lamp.
Results
The X-ray patterns of undoped and Eu3+-doped (1–5%) samples calcined at 1100 °C, Fig. 1(a), correspond to the single-phase orthorhombic Ba2SiO4 (Pnam) (JCPDS 26-1403, number 62) crystalline phase. With regard of the limit detection of this technique, no diffraction peaks characteristic of the europium, barium, or silicon oxides were detected, which corroborate for the fact that Eu3+ ion is inserted into the Ba2SiO4 lattice. Interplanar distance, full width at half maximum and crystallite size data for all samples are shown in Table 1. Since no significant shifts for interplanar distances are observed, it is possible to suggest that Eu3+ ions probably are occupying Ba2+ sites in Ba2SiO4 network. The low FWHM values confirm the formation of highly crystalline material for all samples, showing that the sol–gel method was efficient to the synthesis of well-crystallized Ba2SiO4:Eu3+ under lower calcination temperature when compared to other routes such as solid-state reactions reported by A. M. Pires et al. (1200 °C for 12 hours),21 Z. Wang et al. (1300 °C for 3 hours),22 and M. Zhang et al. (1573 K for 6 hours).30 The crystallite size values shown in Table 1 are comparable to the one of other oxide compounds prepared by sol–gel method with high annealing temperatures (>1000 °C).31,32 For some samples it is observed a preferential growth of certain crystallographic planes, indicating that the crystallites are not spherical. The crystallite size does not vary for the (1 2 1) plan, it increases when the Eu3+ concentration increases for the (2 1 1) plan and it increases for the samples with 1, 4 and 5% for the plan (0 3 1). These modifications can be correlated to the defects generated in the Ba2SiO4 lattice.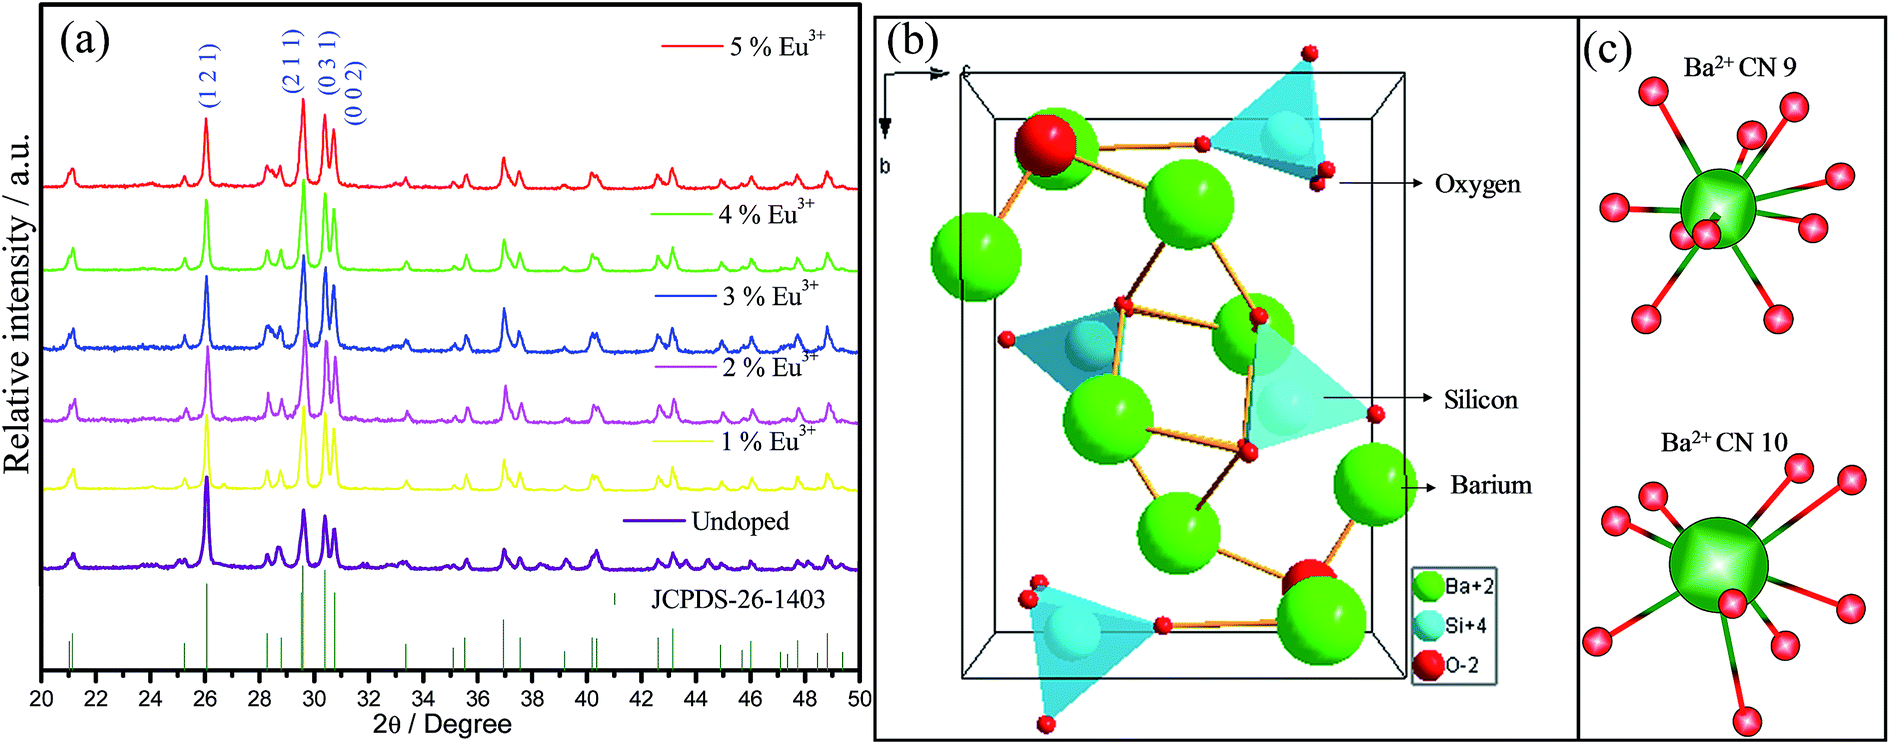 | ||
| Fig. 1 (a) Powder X-ray diffractograms of all samples obtained via the sol–gel route from xerogel precursors calcinated at 1100 °C for 2 hours. (b) Ba2SiO4 unit cell representation, based on the CIF file available on Inorganic Crystal Structure Database (ICSD); (c) representation of the two Ba2+ ion sites, with coordination number of 9 and 10. | ||
| Plan | d/Å | FWHM/° | Crystallite size/nm | d/Å | FWHM/° | Crystallite size/nm |
|---|---|---|---|---|---|---|
| 5% Eu3+ | 4% Eu3+ | |||||
| (1 2 1) | 3.41 | 0.166 | 49 | 3.41 | 0.165 | 49 |
| (2 1 1) | 3.01 | 0.215 | 41 | 3.01 | 0.208 | 40 |
| (0 3 1) | 2.93 | 0.183 | 55 | 2.94 | 0.180 | 45 |
![[thin space (1/6-em)]](https://www.rsc.org/images/entities/char_2009.gif) |
||||||
| 3% Eu3+ | 2% Eu3+ | |||||
| (1 2 1) | 3.42 | 0.167 | 49 | 3.41 | 0.166 | 49 |
| (2 1 1) | 3.01 | 0.215 | 39 | 3.01 | 0.224 | 37 |
| (0 3 1) | 2.93 | 0.193 | 42 | 2.93 | 0.197 | 41 |
|
||||||
| 1% Eu3+ | Undoped | |||||
| (1 2 1) | 3.41 | 0.166 | 49 | 3.41 | 0.168 | 49 |
| (2 1 1) | 3.01 | 0.209 | 39 | 3.01 | 0.223 | 37 |
| (0 3 1) | 2.94 | 0.180 | 46 | 2.93 | 0.188 | 44 |
|
||||||
| Ba2SiO4 (JCPDS 26-1403) | ||||||
| (1 2 1) | 3.41 | — | — | |||
| (2 1 1) | 3.01 | — | — | |||
| (0 3 1) | 2.94 | — | — | |||
The Ba2SiO4 lattice structure and the Ba2+ and Si4+ sites are illustrated in Fig. 1(b). This schematic representation is in accordance with K. A. Denault et al.33 that described the Ba2SiO4 structure as having two coordination sites for Ba2+ ion, the largest one with coordination number (CN) 10, and the smallest structurally distorted with CN 9. The CN 10 site forms a chain along c-axis while the 9-coordinated sites form chains of Ba2+ ions along the b-axis.34 Thus, Eu3+ ions must occupy both sites with CN 9 and 10. Due to the charge compensation mechanism considered in the present work, it is feasible to say that the Eu3+ ions non-equivalently replace Ba2+ ions. Two Eu3+ ions are needed to substitute three Ba2+ ions and, as consequence, one vacancy defect of V′′Ba with two negative charges is formed, and two positive defects of EuBa˙ are created, as it is shown in eqn (1).35
 | (1) |
The V′′Ba vacancies cause a local expansion in the Ba2SiO4 lattice due to the repulsion of the oxi negative charges, and the  defects cause a local compression in the lattice due to the increase of the positive charge in that site. This compression also occurs because Eu3+ ions are smaller than Ba2+, as shown in Table 2. However, even that Eu3+ is smaller than Ba2+, the substitution is favored since the difference (Dr) between both ions radii is smaller than 30%.21 Due to the large difference between the ionic radii of Eu3+ and Si4+ (∼215%), the substitution of Si4+ by Eu3+ is unlikely.
| Cation | Radii/pm (CN) | Dr/% | Bond (CN) | Bond distance/pm |
|---|---|---|---|---|
| Ba | 166 (10) | Ba–O (10) | 298.3 | |
| Ba | 161 (09) | Ba–O (09) | 282.4 | |
| Si | 40 (04) | Si–O | 163.2 | |
| Eu | 126 (09) | 21.1% | ||
| Eu | 131 (10) | 21.1% |
Since both size and shape of phosphor materials are of great importance for their potential applications, the morphology of the phosphors has been elucidated using scanning electron microscopy. SEM images of phosphors viewed in Fig. 2 show that all samples, independently on the presence, or amount of doping ion, exhibit the formation of aggregate particles with irregular shape. The doping does not lead to appreciable modification in the particle shape or size, but for the doped samples, nanowires on the particle surface are noted, as it can be seen in the magnified SEM images showed in the ESI, Fig. ES1.† These nanowires increase the particle surface area, enhancing the surface defect concentration, since more superficial sites with incomplete coordination sphere can be formed, which cause great influence in the spectroscopic properties of the material, as will be presented latter on. Many authors have attributed the degree of agglomeration and irregular morphology to the sol–gel method catalyzed by acid.36–38 The grain size viewed in SEM images is much higher than the crystallite size obtained from XRD indicating that the agglomerated particles observed in the SEM images are formed by an arrangement of several nanocrystallites. Also, energy-dispersive X-ray spectroscopy (EDS), Fig. ES2,† confirm the presence of the elements Ba, Eu and Si on the particles surface and the chemical mapping performed by EDS, Fig. ES3,† shows their homogeneous distribution in an agglomerate of particles.
 | ||
| Fig. 2 Scanning electron microscopy images of undoped and Eu3+-doped Ba2SiO4 prepared by sol–gel method. | ||
FTIR spectra for the prepared Eu3+-doped and undoped Ba2SiO4 samples are shown in Fig. 3. They exhibit bands assigned to the vibrational mode related to the silicate tetrahedron. In orthosilicate structures, SiO44− complex anions are not linked but surrounded by Ba2+ cations and the chemical bond distance between Si and O is shorter than the distance between metal and oxygen. Therefore, internal modes for [SiO4] are almost independent of external vibrations. In orthosilicate structures [SiO4] internal modes are split because of their site symmetry (crystal field splitting) and unit-cell space symmetry (Davydov's splitting), which depends on the mixed anion–cation vibrations whereas crystal field splitting depends on anion internal force field change.39 [SiO4] tetrahedron has four genuine vibrational modes represented in the eqn (2).39
| Γvib = 1A1 + 1E + +2F2 | (2) |
 | ||
| Fig. 3 FTIR spectra of undoped and Eu3+-doped Ba2SiO4 in KBr pellets. | ||
Two genuine vibration modes are allowed by the selection rule for IR spectroscopy:(ν3) asymmetric stretching and (ν4) deformation, both F2 modes (∼916 and ∼497 cm−1). The (ν1) symmetric stretching and (ν2) deformation, A1 and E modes, respectively, are not allowed by the selection rules, yet A1 mode is detected in the spectra with relatively low intensity (∼822 cm−1), due to symmetry distortion. In addition carbonate group vibrational modes are also observed in all IR spectra and they can be assigned to the presence of carbonate ions on the surface of the particles despite of the fact that no carbonate phase is observed in XRD data, considering the technique detection limit of 1 wt% and the carbonate degree of crystallinity. Taking into account that the particles exhibit an active surface during the cooling step after the calcination process, the particles can react with atmospheric CO2 to form carbonate. Besides that, this carbonate should not be an amorphous phase formed during the synthesis because the baselines in XRD are well defined, indicating the absence of any cluster of amorphous material in the final product.
Still considering FTIR spectra in Fig. 3, it is observed that the undoped silicate exhibits a small shift for νas (∼916 cm−1), νs (∼826 cm−1) and δ (∼509 and ∼497 cm−1) [SiO4] bands compared to the doped samples. These small shifts suggest the existence of uniform stresses in the network, which are generally associated with defects in the material, confirming the proposition of defects that arise from the doping. These defects can cause a shortening of the Si–O bond around Ba2+ vacancies and an enlargement around Eu3+ sites, which is responsible for the observed vibrational modes displacements in relation to the undoped sample.40 However, as the amount of europium is very lower than the amount of Ba2+ and SiO4, these defects are local and do not cause extended deformation in the Ba2SiO4 lattice, since the same number of vibrational modes was observed after the doping. Furthermore, the rigid second coordination sphere of the Eu3+ ion counteracts the expansions or compressions in the Eu3+ sites. The impacts of the defects around Eu3+ ions will be better discussed using the Judd–Ofelt intensity parameters in the PL results.
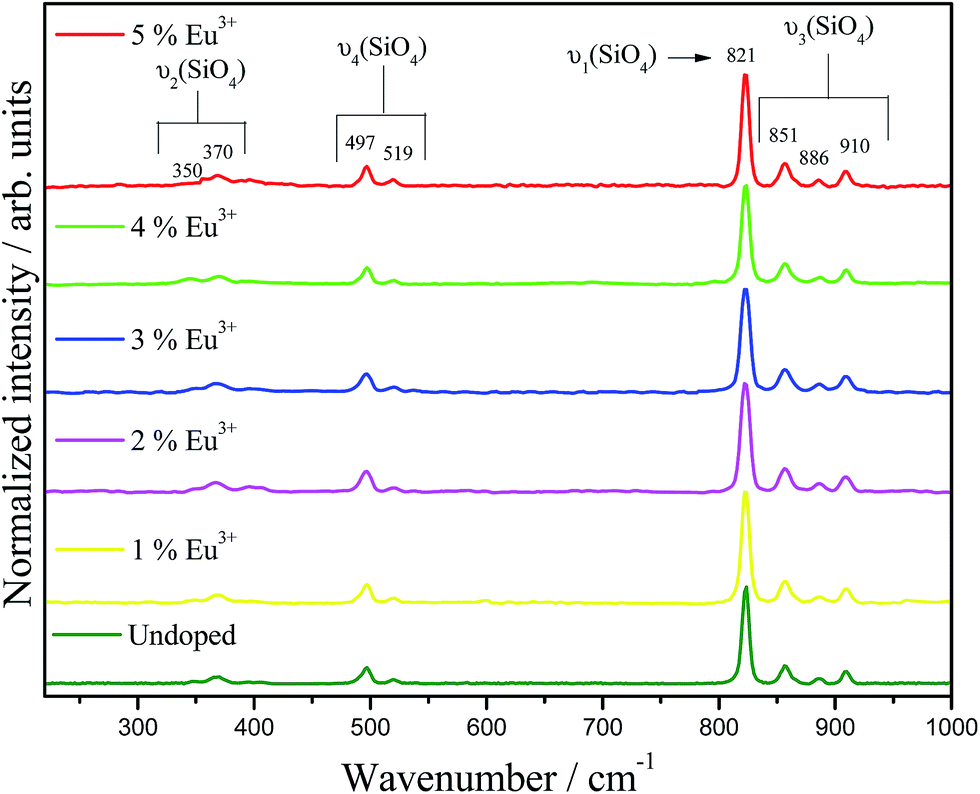
Raman spectra for undoped and doped-Ba2SiO4 samples are shown in Fig. 4. The bands observed at 910, 886, 851, 821, 519, 597, 370, and 350 cm−1 are assigned to the vibrational modes related to the silicate tetrahedron.39 Also, the absence of bands at 559, 425, 385, 339, and 289 cm−1 characteristics of Eu2O3 confirms the formation of a solid solution.41 Full width at half maximum, band area, position and height for the (ν1) νs (821 cm−1) and (ν3) νas (910, 886, and 851 cm−1) vibrational modes are listed in the ESI, Table ES2.† These bands do not exhibit shifts when the dopant is inserted in the matrix. However, the full width at half maximum, band area and height for the Eu-doped phosphors are different when compared to the undoped matrix. These modifications can be assigned to soft structural defects caused by the doping.
 | ||
| Fig. 4 Room temperature Raman spectra of Ba2SiO4:Eu3+ phosphors. Laser 514 nm. | ||
UV-Vis diffuse reflectance (DRS) spectra for undoped and Eu3+-doped Ba2SiO4 samples are viewed in Fig. 5(a), and also a magnification from 310 to 500 nm range is provided in Fig. 5(b). Doped samples show Eu3+ ion characteristic absorption lines at 320, 362, 395 and 467 nm assigned to the transitions from the ground state 7F0 to the 5HJ, 5D4, 5L6 and 5D2 excited states, respectively. In addition, a smooth broad band observed at 360 nm is assigned to Ba2SiO4 absorption,42 and it can be related to the presence of traps or intrinsic defects in the matrix. These defects may be generated, among other causes, by the thermal decomposition of organic material or by products of the sol–gel synthesis during the Ba2SiO4 lattice formation or through the calcination of samples.43 In addition, for the doped samples, the region corresponding to the matrix band, that is better viewed in Fig. 5(b), has its reflectance decreased, which means a greater absorption in relation to the undoped sample, except for the 5%-doped sample. This behavior indicates that Eu3+ is contributing for the formation of defects in the Ba2SiO4 lattice, corroborating with FTIR and Raman data. A careful analysis of Fig. 5(b) revels that for the sample doped with 4, 3, 2 and 1%, the defect band intensity is constant and decreases for the sample doped with 5%. Therefore, it is possible to conclude that the sample with 5% of doping ions shows the lowest concentration of defects in the network. Therefore it is possible to conclude that the sample with 4% of doping ions shows the higher concentration of defects in the network. Another effect that can contribute to doped-phosphors defect formation increasing is the superficial defects, as evidenced by SEM images, Fig. 2.
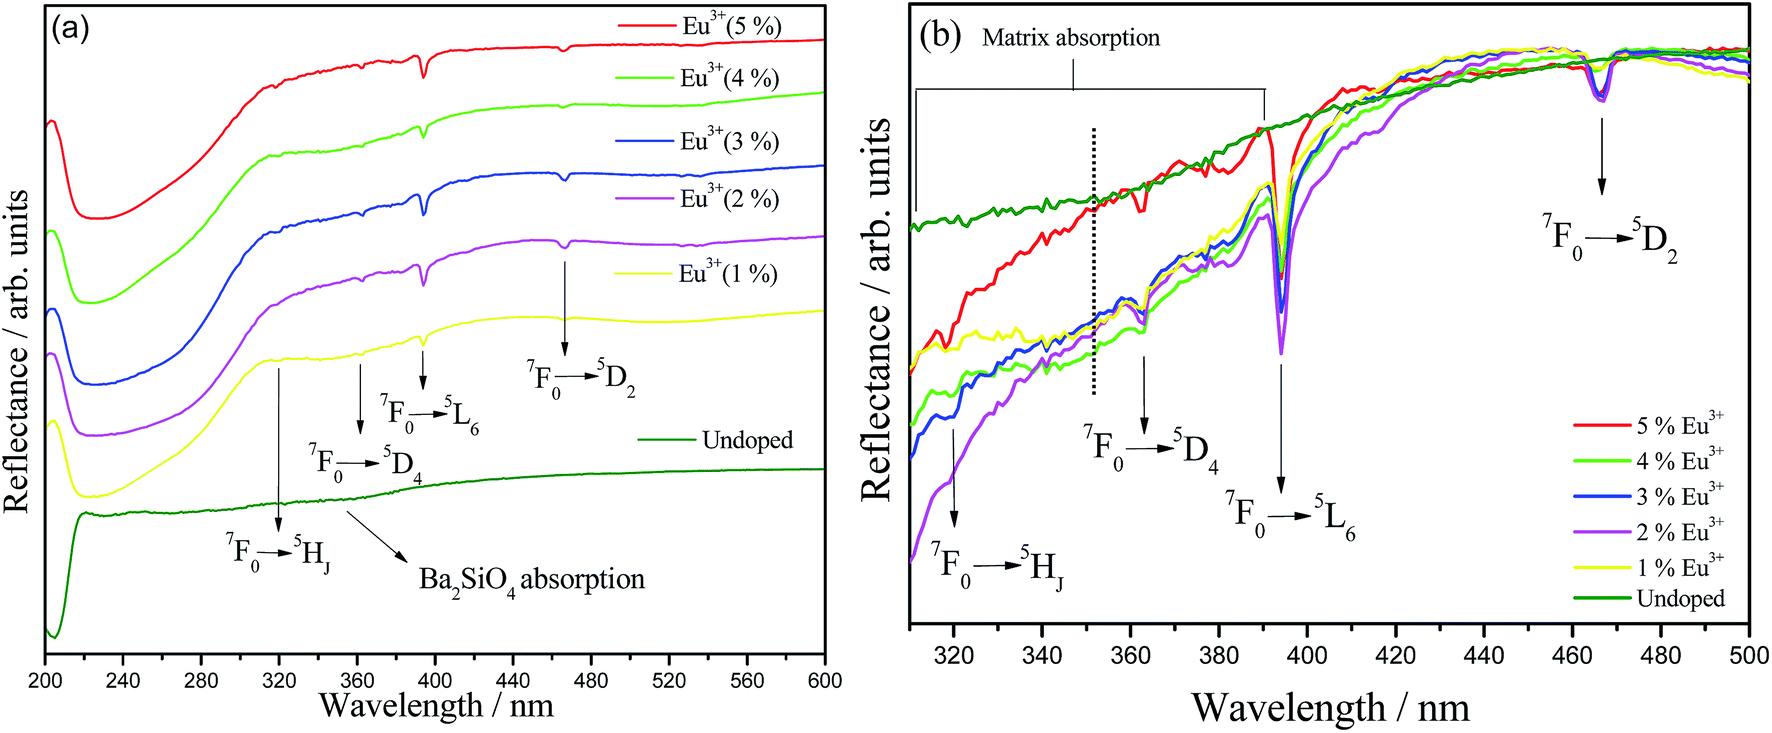 | ||
| Fig. 5 (a) UV-Vis diffuse reflectance spectra of undoped and Eu3+-doped Ba2SiO4 prepared by sol–gel method. (b) Magnification of the region between 310–500 nm. | ||
The DR spectra also exhibit a strong and sharp absorption in the higher energy region with maximum near 225 nm related to transitions of the valence band (VB) and conduction band (CB) that corresponds to the bandgap of the material. Zhang et al. reported diffuse reflectance measurements for Ba2SiO4 synthesized via solid state and the DR spectrum profile recorded by them matches with those showed here for samples obtained via the sol–gel route, except for slight differences that arise from the discrete morphology related to each synthetic methodology that directly affects sample reflection profile.42
Bandgap values of the Eu3+ doped and undoped Ba2SiO4 samples were also evaluated by using diffuse reflectance data through a graphic of (αhν)n versus the energy of the incident photon (h), where n equals 2 for direct transition and 0.5 for indirect transition.44 The value of α is the ratio of the absorption and scattering coefficients according to the Kubelka–Munk's approximation,45 eqn (3).
 | (3) |
| Sample | Bandgap/eV |
|---|---|
| Ba2SiO4:Eu3+(5%) | 4.62 |
| Ba2SiO4:Eu3+(4%) | 4.80 |
| Ba2SiO4:Eu3+(3%) | 4.42 |
| Ba2SiO4:Eu3+(2%) | 4.38 |
| Ba2SiO4:Eu3+(1%) | 4.75 |
| Undoped | 5.82 |
The excitation and emission spectra at room temperature of all europium(III) doped barium silicate samples are viewed in Fig. 6(a) and (b), respectively. A broad Eu3+–O2− charge transfer band (CT) is observed below 300 nm in all excitation spectra as well as the expected narrow lines with lower relative intensity related to the f–f Eu3+ transitions that are forbidden by Laporte's parity selection rule. Also, the phosphors can efficiently be excited by UV light source, being able to be used in UV LED devices. The emission spectra under 393 nm excitation, that corresponds to the 7F0 → 5L6 Eu3+ transition, exhibit the set of 5D0 → 7F0,1,2,3,4 transitions in the red region attributed to the Eu3+ in low-symmetry sites.47 The sample doped with 4% has the highest relative emission, indicating that above this nominal doping percentage the quenching by concentration takes place. With the increase in Eu3+ concentration, the distance between these ions decreases within the crystalline lattice, leading to an increase in the probability of energy transfer between the emitting centers. Thus, increasing the chances of a defect in the network being close to an europium center resulting in the deactivation through a non-radiative process.
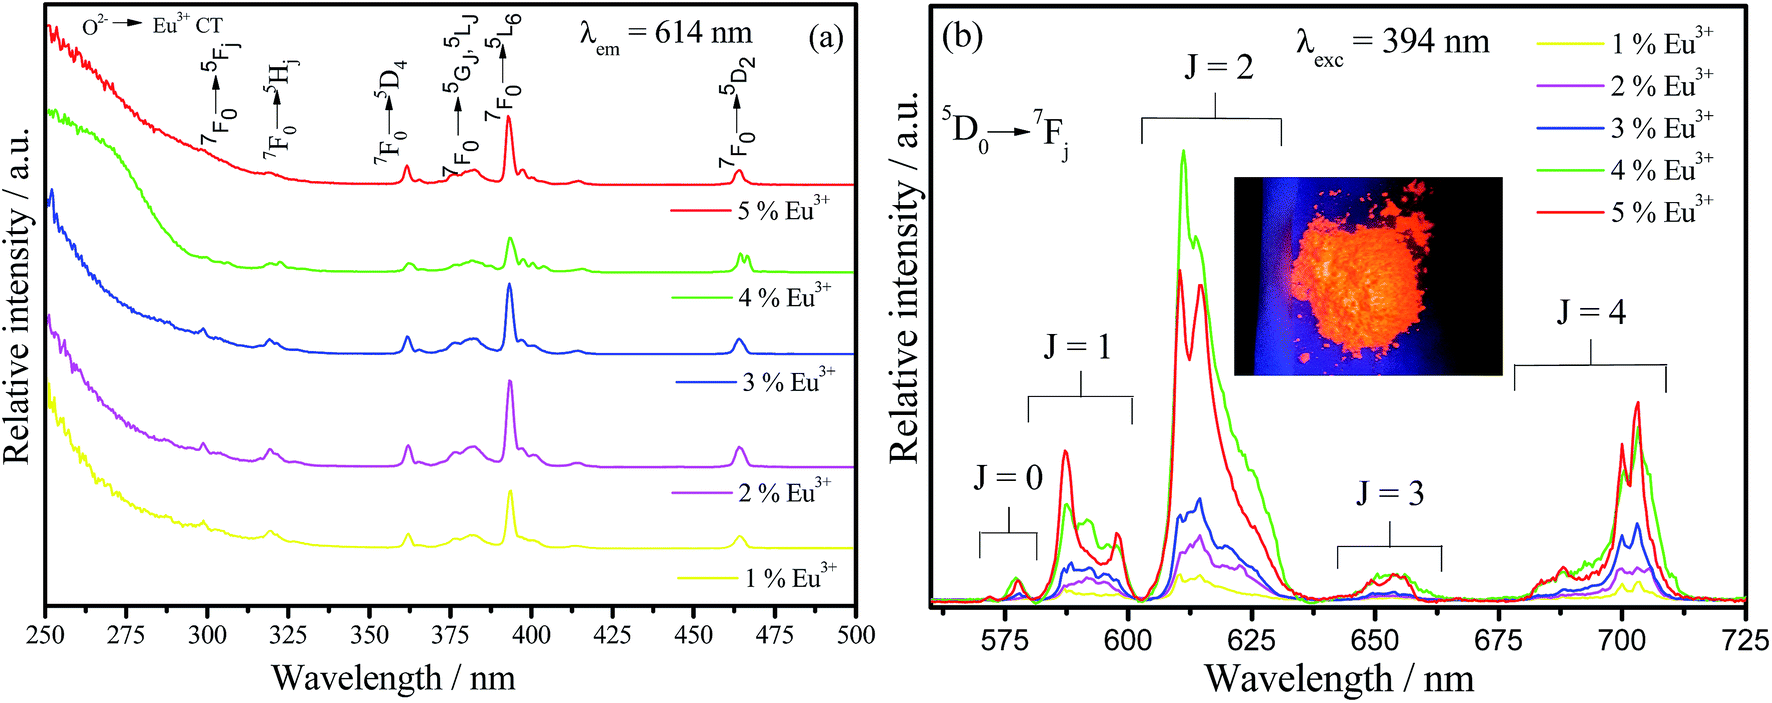 | ||
| Fig. 6 Excitation (a) and emission (b) spectra of Ba2SiO4:Eu3+ powder samples measured at room temperature. Inset (b) is a photograph of the 4% doped sample under 270 nm UV light. The emission spectra at 250 nm are shown in Fig. ES6, in the ESI.† | ||
The presence of the 5D0 → 7F0 transition in the emission spectra for all Eu3+ percentages indicates that this ion is inserted in at least one site without inversion center since this transition, according to the symmetry selection rules is forbidden when Eu3+ is occupying sites with inversion center. In order to elucidate the Eu3+ ion occupation in the Ba2SiO4 host, we measured some excitation spectra at 77 K within the range of the 5D0 → 7F0(0–0) transition by fixing the emission wavelengths related to the different 5D0 → 7F2 components, these spectra are shown in Fig. ES7.† For all samples, independently on the Eu3+ percentage, it is verified at least two maximum in the investigated range associated to 0–0 transition components. Thus, the presence of more than one 0–0 component confirms that Eu3+ is inserted in at least two non-equivalent sites without inversion center.
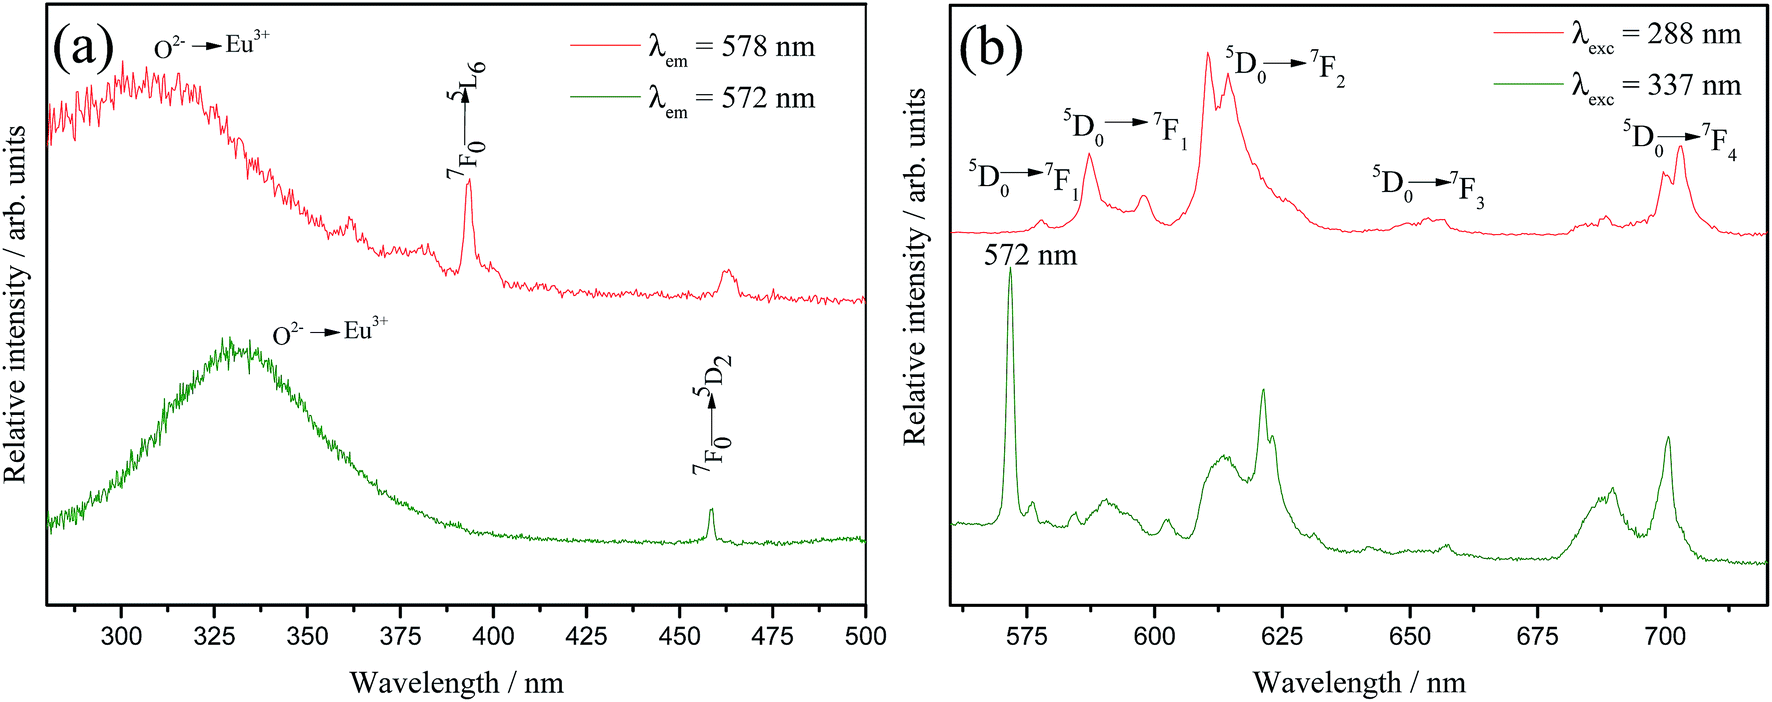
On the other hand, a detailed inspection in Fig. 6(b) reveals that just the 5% doped sample emission spectrum shows an anomalous profile. The region between 570 and 579 nm displays three components that can be associated to 0–0 transitions, one at 572 nm and the others at 577 and 579 nm. This profile is very similar to the one reported by A. M. Pires et al. (1997)20 for Eu3+-doped Ba2SiO4 obtained from solid state route. In that case, emission spectrum exhibited two groups of transitions that have been related to the 5D0 → 7F0, each group were assigned to two different emission centers, one of them characteristic of Eu3+ occupying Ba2+ sites and therefore, coordinated to the oxy ions belonging to the matrix structure, and the other one to the so called Eu3+–O2− associates located in the interstices originated from a charge compensating mechanism due to the different oxidation states of Ba2+ and Eu3+. However, in our case, it is not expected a charge compensation by oxi ions since we are using a charge compensation mechanism during the doping calculation. In order to evaluate this anomalous behavior, selective excitation spectra, Fig. 7(a), were performed at 77 K for the sample doped with 5% of Eu3+ fixing the emission in the different 0–0 components. When the emission wavelength is fixed in the anomalous 0–0 position (572 nm), Fig. 7(a), a charge transfer band (CT band) is observed at considerably lower energy (337 nm) when compared to the values for the Eu3+ in others lattices.48 However, this CT band position (337 nm) is coincident with the one reported by A. M. Pires et al.20 that was assigned to Eu3+–O2− associates. In addition, the emission spectrum under 337 nm excitation, Fig. 7(b) exhibits an anomalous transition at 572 nm with the highest intensity in the spectrum that is attributed to a 0–0 transition originated in an europium ion located in a lattice interstice and associated with an oxy ion not bounded to silicon.20 On the other hand, when the emission is fixed at 579 nm, which is related to the Eu3+ occupying Ba2+ sites in the network, the CT band is located in the expected higher energy position, with maximum at 288 nm. Recently, K. Fiaczyk et al. discussed some peculiarities of Eu3+ luminescence in Sr2GeO4.49 In this work authors claim that the presence of this Eu3+–O2− associates are formed not only by the charge compensation mechanism, but also when host materials are rather loosely packed and/or contain chains constituted by the M–O polyhedral, and unfilled spaces that can locate oxy ions in its interstices. Therefore, in our case, it is feasible to correlate the arising of the Eu3+–O2− associates to this explanation since that the Ba2SiO4 matrix is indeed loosely packed containing Ba–O polyhedral chains with unfilled spaces, as previously reported in literature.26 Furthermore, the dynamic air atmosphere applied during the calcination step increase the O2 concentration in the reactive environment, favoring the inclusion of extra oxi ions into the Ba2SiO4 lattice.
 | ||
| Fig. 7 Selective excitation (a) and emission (b) spectra of the sample Ba2SiO4:Eu3+(5%) measured at 77 K. | ||
To evaluate the anomalous intensity of 0–0 transition observed in Fig. 7(b), it is necessary to use an extension of Judd–Ofelt theory proposed by B. G. Wybourne50 and M. C. Downer51 and also approached by K. Fiaczyk et al. for evaluate Eu3+–O2− associates in Sr2GeO4.49 For this, it is necessary to consider that since the oxi ions not belonging to SiO4 tetrahedra may be located randomly in the host lattice, only a small fraction of Eu3+ ions encounters these oxi ions in their first coordination sphere, and only Eu3+–O2− associates would show the low-energy CT transitions. This explains why this anomalous emission is only observed for the sample with the highest europium concentration. From this extended Judd–Ofelt theory, some specific symmetries can cause an increase of the 0–0 transition due to a slight contribution of the crystalline field Hamiltonian that occurs just when the charge transfer level has low energy. It appears that even a small linear contribution to the Hamiltonian crystal field may enhance the 0–0 transition probability if only the energy of CT state is low enough.49,52 This effect occurs by a third order electric dipolar mechanism, which increase the intensity of 0–0 transition in relation to the other 0–J ones. However, the CT transition energy is just lowered when the Eu3+ ions are bounded to easily polarizable oxi ions and their electrons are not involved into other bonds. In our system these oxy ions with high polarizable environment are those not belonging to the Ba2SiO4 lattice, and therefore introduced into the lattice interstices during the phase formation. Thus, these oxy ions with high polarizable environment decrease the CT energy and as consequence, when the excitation occurs at this CT specific position, the third order electric dipolar mechanism takes place, increasing the 0–0 intensity in relation to the other 0–J transitions.49 However, the Eu3+–O2− associate concentration in the Ba2SiO4 matrix is lower than that of Eu3+ sites replacing Ba2+, causing little influence in the Ba2SiO4 vibrational structure.
The intensity parameters Ω2 and Ω4 were also evaluated for all Eu3+ doped samples from the emission spectra measured at room temperature considering the method described by C. A. Kodaira et al.53 and they are summarized in Table 4. The 0–2 and 0–4 transitions are related to Ω2 and Ω4, respectively, and the 0–1 transition is taken as reference, for this transition being allowed by magnetic dipole and its intensity does not vary with external electric field changes caused by the crystal/ligand field. Considering the integrated areas below the transitions 5D0 → 7FJ with J = 2, J = 4, and J = 1 it is possible to write:
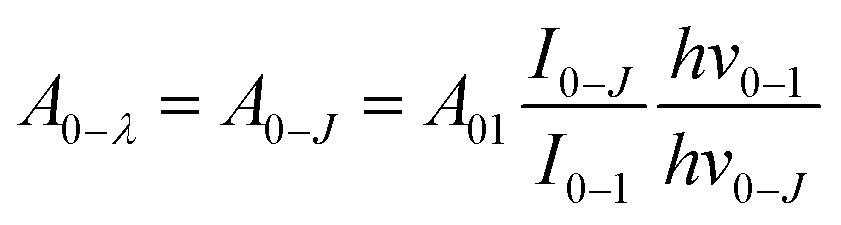 | (4) |
 | (5) |
 are 0.0032 for Ω2 and 0.0023 for Ω4;53 e is the electron charge, h and ε0 are the Planck's and vacuum permittivity constants, respectively; c is the speed of light in vacuum; A01 is the Einstein's coefficient for spontaneous emission which value can be estimated considering the expression A01 = 14.65n3 in s−1 (ref. 54) taken into account the refractive index (n) that in this case equals 1.7 and so the correspondent A01 value is 71.97 s−1; the term I0–J is the area under the curve related to the 5D0 → 7FJ transitions obtained from the spectral data and x is the Lorentz local field correction, given by the expression n(n2+2)2/9.55 The Ω2 parameter may be associated with Eu3+ site distortions because the electric dipole 5D0 → 7F2 transition relative intensity is dependent on the Eu3+ local symmetry.56 Also, Ω2 values are straightly related to the Eu–O angular deformations.57 In this way, the relative intensity of this hypersensitive transition increases with the decrease of Eu3+ local symmetry and site distortion.53 On the other hand, the Ω4 parameter is influenced by the electron density of the ligands (L) around Eu3+.58 The Ω4 parameter is less sensitive to small angular changes, but it is more sensitive to the separation between the metal ion and the ligand donor.57 So, the relatively low values of Ω2 intensity parameters for all samples showed in Table 4 indicate that the chemical environment around Eu3+ is relatively symmetric, since the values are lower compared to other systems that Eu3+ ions are in low symmetry sites.59 These relative low values are expected when we compare the emission intensity of the 0–1 and 0–2 transitions.
| Ba2SiO4 | Ω2a (pm2) | Ω4a (pm2) | τ1b (ms) | A1 | τ2b (ms) | A2 | R2c | 〈τ〉 (ms) | Atotal (s)−1 | Aradd (s)−1 | ηe (%) |
|---|---|---|---|---|---|---|---|---|---|---|---|
| a Values calculated from emission spectra under λexc = 250 nm.b Lifetime values calculated fixing excitation wavelength at 250 nm and emission wavelength at 614 nm (5D0 → 7F2).c Goodness of fit coefficient for bi-exponential.d Radiative rate calculated from emission spectra under λexc = 250.e Quantum efficiency calculated from the average lifetime values, and the emission spectra under λexc = 250 nm. | |||||||||||
| 5% Eu3+ | 5.1 | 4.3 | 0.12 | 7.9 × 10⁵ | 1.76 | 9.2 × 10⁵ | 0.99 | 1.66 | 602 | 437 | 72.6 |
| 4% Eu3+ | 6.2 | 6.1 | 0.14 | 2.5 × 10⁵ | 1.59 | 1.0 × 10⁵ | 0.99 | 1.34 | 746 | 509 | 68.2 |
| 3% Eu3+ | 6.2 | 7.2 | 0.25 | 5.4 × 10⁵ | 1.51 | 6.9 × 10⁵ | 0.99 | 1.29 | 901 | 530 | 58.8 |
| 2% Eu3+ | 6.4 | 5.6 | 0.17 | 4.0 × 10⁶ | 1.34 | 2.1 × 10⁶ | 0.99 | 1.11 | 901 | 501 | 55.6 |
| 1% Eu3+ | 5.9 | 5.9 | 0.19 | 3.2 × 10⁶ | 1.57 | 1.8 × 10⁶ | 0.99 | 1.33 | 752 | 500 | 66.5 |
In order to understand the intensity parameters behavior, it is necessary to evaluate the symmetry around Eu3+ ions with CN 9 and 10. In the literature it is shown that different kinds of barium-containing silicates usually have symmetric sites, especially those with CN 10,60 justifying the low Ω2 values for the system. Also, L. Lin et al.61 performed a detailed structural study for the same material doped with another lanthanide, the Ce3+ doped-Ba2SiO4 phosphor, in which the Ce3+ substitution causes a decrease in the average bond length of 0.994% and a bond angle average deviation of ±0.185°. In this context, we can assume that the site deformation around Eu3+ ions is very low, justifying the low Ω2 values and suggesting that the main contribution to the structural defects observed by FTIR, Raman and DRS comes from the barium vacancy defects. Samples doped with 1, 2, 3 and 4% have similar values of Ω2, however, the Ω2 value for the 5% doped sample is quite lower due to the presence of the Eu3+–O2− associate. The transition mechanism for these associates is different, as mentioned before, favoring the 0–0 transition in detriment of the all other 0–J transitions. The decrease in the 0–2 band intensity results in a decrease of the calculated Ω2 value.
The low Ω4 values for all samples compared to other systems58,59 show the low polarizable environment around Eu3+ ions, suggesting a low covalence degree for the Eu–O bond. The Ω4 parameter is the lowest for the 5%-doped phosphor, due to the decrease of the 0–4 transition intensity caused by the presence of the Eu3+–O2− associate. The other differences in the Ω4 values must be correlated to small differences in the Eu–O bond distance which directly influence the electron density around Eu3+ ions.
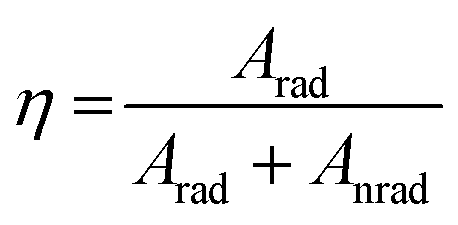
Emission lifetime measurements were performed at room temperature for the Eu3+-doped Ba2SiO4 samples, and the obtained curves, Fig. ES8,† were adjusted by using a multi-exponential fit that yielded two experimental lifetime values listed in Table 4. These lifetime values were used to estimate the quantum efficiency also included in Table 4. The quantum efficiency of an emitter state (η) is defined as the ratio between the radiative (Arad) and the total contributions (radiative and non-radiative, Anrad), as represented in eqn (6).62
 | (6) |
 | (7) |
 | (8) |
 | (9) |
The average lifetime <τ> values listed in Table 4 for all samples lies in the 1.01–1.80 ms range, which are in agreement with lifetime values related to the 5D0 excited state for Eu3+-doped Ba2SiO4 reported by A. M. Pires et al.21 The fact that all samples have at least two distinct lifetimes values confirms that the emission is starting from Eu3+ occupying at least two different non-equivalent sites. In addition, lifetime varies non-linearly with the variation of Eu3+ concentration due to the generation of intermediate energy levels, such as the defects mentioned before, that mediates the energy transfer mechanisms affecting the 5D0 decay rates.64
The prepared Ba2SiO4:Eu3+ phosphors, especially the one doped with 5%, show a relative high quantum yield of luminescence (η) when compared to other host lattices such as CaSiO3:Eu3+(η ∼ 33%),65 Zn2SiO4:Eu3+(η ∼ 30%),66 and BaAl2O4:Eu3+(η ∼ 70%)67 whereas Eu3+ is also replacing cations oxidation state of +2. Furthermore, to the best of our knowledge, the Eu3+ quantum efficiency in the Ba2SiO4 matrix was not reported yet. Finally, it is important to highlight that the CIE (International Commission on Illumination) chromaticity diagrams68 built for all the produced phosphors (see Fig. ES9†) guarantee high red color purity, in special related to the one doped with 4% which chromaticity coordinate values are x = 0.67 and y = 0.32, with 100% of color purity at 394 nm.
Conclusion remarks
In summary, Eu3+-doped Ba2SiO4 single-phase powder red phosphor was successfully synthesized using softer condition through a novel approach based on an adapted sol–gel methodology than the standard solid-state route that requires higher temperatures and longer synthesis time. Besides that, a detailed spectroscopic study not reported yet was provided for this system by using Eu3+ as spectroscopic probe in order to optimize structural and optical properties of the phosphor aiming light emitting diodes application. Under 250 nm excitation, the phosphors exhibit an intense red emission due to the Eu3+ f–f transitions, and the 4%-doped sample shows the highest relative emission intensity and the 5%-doped the highest quantum efficiency (72.6%), what make of these two samples the most suitable for use in WLED application under UV excitation.Conflicts of interest
There are no conflicts to declare.Acknowledgements
The authors are thankful to the Brazilian agencies FAPESP, CNPq and CAPES for the financial research support. Airton G. B. Junior is particularly grateful to the São Paulo research Foundation (FAPESP) for the award of some scholarships (Grant No. 2012/13876-9, 2015/10394-1, and 2016/20421-9). Laboratório de Microscopia Eletrônica de Varredura (FCT-UNESP), research group in sol–gel (UNIFRAN), Laboratório de Filmes Nanoestruturados e Espectroscopia (FCT-UNESP), and Laboratório de compósitos e cerâmicas funcionais (FCT-UNESP).References
- J. H. Oh, S. J. Yang, Y. Sung and Y. R. Do, Opt. Express, 2012, 20, 20276 CrossRef PubMed.
- H. Ji, L. Wang, M. S. Molokeev, N. Hirosaki, R. Xie, Z. Huang, Z. Xia, O. M. ten Kate, Li. Liub and V. V. Atuchin, J. Mater. Chem. C, 2016, 4, 6855 RSC.
- N. Guo, C. Jia, J. Li, Y. Zhao, R. Ouyang and W. Lu, RSC Adv., 2015, 5, 46517 RSC.
- J. Liu, H. Lian, H. J. Sun and C. Shi, Chem. Lett., 2005, 34, 1340 CrossRef CAS.
- H. Pan, X. Li, J. Zhang, L. Guan, H. Su and F. Teng, Mater. Lett., 2015, 155, 106 CrossRef CAS.
- C. Sun, Y. Chang, Y. Wang, C. Chen, Y. Lo and H. Cheng, J. Disp. Technol., 2015, 11, 261 CrossRef CAS.
- E. F. Schubert and J. K. Kim, Science, 2005, 208, 1274 CrossRef PubMed.
- N. A. Fromer and M. S. Diallo, J. Nanopart. Res., 2013, 15, 2044 CrossRef.
- F. Xie, Z. Dong, D. Wen, J. Yan, J. Shi, J. Shi and M. Wu, Ceram. Int., 2015, 41, 9610 CrossRef CAS.
- Y. K. Su, S. J. Chang, S. C. Wei and S. Chen, IEEE Trans. Device Mater. Reliab., 2005, 5, 277 CrossRef CAS.
- L. Chen, C. Lin, C. Yeh and R. Liu, Materials, 2010, 3, 2172 CrossRef CAS.
- X. Bai, G. Caputo, Z. Hao, V. T. Freitas, J. Zhang, R. L. Longo, O. L. Malta, R. A. S. Ferreira and N. Pinna, Nat. Commun., 2014, 5, 5702 CrossRef CAS PubMed.
- S. Ye, F. Xiao, Y. X. Pan, Y. Y. Ma and Q. Y. Zhang, Mater. Sci. Eng., R, 2010, 71, 1 CrossRef.
- S. H. M. Poort, H. M. Reijnhoudt, H. G. T. Van Der Kuip and G. Blasse, J. Alloys Compd., 1996, 241, 175 CrossRef.
- L. C. Ferracin, M. R. Davolos and L. A. O. Nunes, J. Lumin., 1997, 72, 185 CrossRef.
- Y. Tang, S. Hu, C. C. Lin, N. C. Bagkar and R. Liu, Appl. Phys. Lett., 2007, 90, 151108 CrossRef.
- P. Haro-González, M. Karlsson, S. M. Gaita, C. S. Knee and M. Bettinelli, Solid State Ionics, 2013, 247, 94 CrossRef.
- C. E. Secu, R. F. Negrea and M. Secu, Opt. Mater., 2013, 35, 2456–2460 CrossRef CAS.
- G. Gasparotto, M. A. Cebim, M. S. Goes, S. A. M. Lima, M. R. Davolos, J. A. Varela, C. O. Paiva-Santos and M. A. Zaghete, J. Appl. Phys., 2009, 106, 063509 CrossRef.
- A. M. Pires, M. R. Davolos and O. M. L. Malta, J. Lumin., 1997, 72, 244 CrossRef.
- A. M. Pires and M. R. Davolos, Chem. Mater., 2001, 13, 21 CrossRef CAS.
- Z. Wang, S. Guo, Q. Li, X. Zhang, T. Li, P. Li, Z. Yang and Q. Guo, Phys. B, 2013, 411, 110 CrossRef CAS.
- B. Ritter, T. Krahl, K. Rurack and E. Kemnitz, J. Mater. Chem. C, 2014, 2, 8607–8613 RSC.
- F. Gao, Y. Sheng, Y. Song, K. Zheng, C. Lin, H. Zhang, Q. Huo and H. Zou, J. Sol-Gel Sci. Technol., 2014, 71, 313 CrossRef CAS.
- J. E. Ghoul, K. Omri, S. A. Gómez-Lopera and L. E. Mir, Opt. Mater., 2014, 36, 1034–1039 CrossRef.
- J. K. Han, M. E. Hannah, A. Piquette, J. B. Talbot, K. C. Mishra and J. McKittrick, J. Lumin., 2013, 133, 184 CrossRef CAS.
- J. K. Han, M. E. Hannah, A. Piquette, J. B. Talbot, K. C. Mishra and J. McKittrick, ECS J. Solid State Sci. Technol., 2012, 1, 98 CrossRef.
- A. Birkel, N. A. DeCino, N. C. George, K. A. Hazelton, B. Hong and R. Seshadri, Solid State Sci., 2013, 19, 51 CrossRef CAS.
- P. A. Raymundo-Pereira, D. A. Ceccato, D. A. G. B. Junior, M. F. S. Teixeira, S. A. M. Lima and A. M. Pires, RSC Adv., 2016, 6, 104529 RSC.
- M. Zhang, J. Wang, Q. Zhang, W. Ding and Q. Su, Mater. Res. Bull., 2007, 42, 33 CrossRef CAS.
- G. Xia, S. Zhou, J. Zhang, S. Wang, Y. Liu and J. Xu, J. Cryst. Growth, 2005, 283, 257 CrossRef CAS.
- C. H. Park, S. J. Park, B. Y. Yu, H. S. Bae, C. H. Kim, C. H. Pyun and H. G. Yan, J. Mater. Sci. Lett., 2000, 19, 335 CrossRef CAS.
- K. A. Denault, J. Brgoch, S. D. Kloß, M. W. Gaultois, J. Siewenie, K. Page and R. Seshadri, ACS Appl. Mater. Interfaces, 2015, 7, 7264 CAS.
- J. S. Kim, P. E. Jeon, J. C. Choi and H. L. Park, Solid State Commun., 2005, 133, 187 CrossRef CAS.
- S. Yao, L. Xue and Y. Yan, Ceram.-Silik., 2011, 55, 251 CAS.
- S. Chen, S. L. Liu, M. Gu, C. Ni, B. Liu and S. Huang, J. Lumin., 2013, 140, 1 CrossRef CAS.
- D. Theyvaraju, S. Muthukumaran and M. Ashokkumar, J. Mater. Sci.: Mater. Electron., 2013, 24, 5189 CrossRef CAS.
- H. F. N. Oliveira, R. B. Trinca and Y. Gushikem, Quim. Nova, 2009, 32, 1346 CrossRef.
- M. Handke and M. Urban, J. Mol. Struct., 1982, 79, 353 CrossRef CAS.
- A. C. S. Silva, G. G. Souza, M. A. L. Nobre and A. M. Pires, J. Mater. Sci., 2010, 45, 4216 CrossRef CAS.
- M. V. Abrashev, N. D. Todorow and J. Geshew, J. Appl. Phys., 2014, 116, 103508 CrossRef.
- M. Zhang, J. Wang, Q. Zhang, W. Ding and Q. Su, Mater. Res. Bull., 2007, 42, 33 CrossRef CAS.
- C. Barthou, J. Benoit, P. Benalloul and A. A. Morell, J. Electrochem. Soc., 1994, 141, 524 CrossRef CAS.
- A. B. Murphy, Sol. Energy Mater. Sol. Cells, 2007, 91, 1326 CrossRef CAS.
- P. Kubelka and F. Munk, Z. Tech. Phys., 1931, 15, 593 Search PubMed.
- S. Z. Karazhanov, P. Ravindran, P. Vajeeston, A. Ulyashin, H. Fjellvag and B. G. Svensson, J. Appl. Phys., 2009, 106, 123701 CrossRef.
- W. T. Carnall, G. L. Goodman, K. Rajnak and R. S. Rana, J. Chem. Phys., 1989, 90, 3443 CrossRef CAS.
- D. Van Der Voort, G. J. Dirksen and G. Blasé, J. Phys. Chem. Solids, 1992, 53, 219 CrossRef CAS.
- K. Fiaczyk and E. Zych, RSC Adv., 2016, 6, 91836 RSC.
- B. G. Wybourne, J. Chem. Phys., 1968, 48, 2596 CrossRef.
- M. C. Downer, G. W. Burdick and D. K. Sardar, J. Chem. Phys., 1988, 89, 1787–1797 CrossRef CAS.
- X. Y. Chen and G. K. Liu, J. Solid State Chem., 2005, 178, 419–428 CrossRef CAS.
- C. A. Kodaira, H. F. Brito, O. L. Malta and O. A. Serra, J. Lumin., 2003, 101, 11 CrossRef CAS.
- A. P. Duarte, M. Gressier, M. Menu, J. Dexpert-Ghys, J. M. A. Caiut and S. J. L. Ribeiro, J. Phys. Chem. C, 2012, 116, 505 CAS.
- A. M. Pires, M. R. Davolos and E. B. Stucchi, Int. J. Inorg. Mater., 2001, 3, 785 CrossRef CAS.
- W. T. Carnall, Handbook on the physics and chemistry of rare earths, 1979, vol. 3, p. 171 Search PubMed.
- R. T. Moura, A. N. C. Neto, R. L. Longo and O. L. Malta, J. Lumin., 2016, 170, 420 CrossRef CAS.
- T. Grzyb and S. Lis, Inorg. Chem., 2011, 50, 8112 CrossRef CAS PubMed.
- A. M. Pires, M. R. Davolos and E. B. Stucchi, Int. J. Inorg. Mater., 2001, 3, 785 CrossRef CAS.
- N. C. George, K. A. Denault and R. Seshadri, Annu. Rev. Mater. Res., 2014, 43, 481 CrossRef.
- L. Lin, L. X. Huang, R. Shi, W. Zhou, Y. Huang, J. Zhong, Y. Tao, J. Chen, L. Ning and H. Liang, RSC Adv., 2017, 7, 25685 RSC.
- O. L. Malta, S. J. L. Ribeiro, M. Faucher and P. Porcher, J. Phys. Chem. Solids, 1991, 52, 587 CrossRef CAS.
- Y. Ma, H. Wang, W. Liu, Q. Wan, J. E. Xu and Y. Tang, J. Phys. Chem. B, 2009, 113, 14139 CrossRef CAS PubMed.
- R. A. S. Ferreira, M. Nolasco, A. C. Roma, R. L. Longo, O. L. Malta and L. D. Carlos, Chem.–Eur. J., 2012, 18, 12130 CrossRef CAS PubMed.
- L. Zhou and B. Yan, J. Phys. Chem. Solids, 2008, 69, 2877 CrossRef CAS.
- L. Dacanin, S. R. Lukic, D. M. Petrovic, M. Nikolic and M. D. Dramicanin, Phys. B, 2011, 406, 2319–2322 CrossRef CAS.
- R. J. Wiglusz and T. Grzyb, Opt. Mater., 2013, 36, 539–545 CrossRef CAS.
- P. A. Santa-cruz and F. S. Teles, Spectra Lux Software. Versão 1.0 RENAMI, U. Federal de Pernambuco, 2003 Search PubMed.
Footnote |
| † Electronic supplementary information (ESI) available. See DOI: 10.1039/c7ra10494d |
| This journal is © The Royal Society of Chemistry 2017 |