 Open Access Article
Creative Commons Attribution 3.0 Unported Licence
Sensitive detection of cardiac troponin T based on superparamagnetic bead-labels using a flexible micro-fluxgate sensor†
Lei Guo *a,
Zhen Yangb,
Shaotao Zhia,
Zhu Fenga,
Chong Leia and
Yong Zhou*a
aKey Laboratory for Thin Film and Microfabrication of Ministry of Education, Research Institute of Micro/Nano Science and Technology, Shanghai JiaoTong University, Dong chuan Road 800, Shanghai 200240, China. E-mail: g2252330@sjtu.edu.cn; yzhousjtu@gmail.com
bSchool of Physics and Electronic Engineering, Xinyang Normal University, Xinyang 464000, China
First published on 10th November 2017
Abstract
In this study, we describe an innovative micro-fluxgate immunosensor based on superparamagnetic Dynabeads for the detection of cardiac troponin T (cTnT), an important biomarker for cardiovascular diseases. The fluxgate sensor developed in this study uses a double layer of Co-based amorphous ribbons as a sensing element and three-dimensional solenoid copper coils to control the sensitive core. The system was fabricated through a standard micro-fabrication process, including thick photoresist lithography and electroplating. Superparamagnetic Dynabeads were employed as recognition tags and double polyclonal antibody pairs combined using streptavidin–biotin binding were employed to specifically capture and label the cTnT coupled with magnetic beads on a separate Au film-coated wafer via a classical sandwich immunoassay process. Series optimization of the assay parameters was performed to achieve optimal detection parameters. Under optimal conditions, the detection and quantification of cTnT was performed by sensing the magnetic signal of the cTnT-labeled Dynabeads with the micro-fluxgate sensor. The resulting biosystem successfully detected cTnT with satisfactory sensitivity, reproducibility, stability, and specificity. A minimum detectable limit of 0.01 ng mL−1 was achieved with a linearity range of 0.01–10 ng mL−1, demonstrating the high sensitivity of this novel system. In addition to the superior detection performance, the proposed sensor is convenient to manipulate, entirely lab-free, provides a quick result, and is portable. These factors suggest that this system has the potential to be applied as a point-of-care diagnostic tool for cardiovascular disease.
1. Introduction
Cardiovascular diseases are frequent causes of visits to emergency medical departments and are a major cause of mortality and morbidity worldwide.l,2 The rapid, simple, and accurate diagnosis of acute coronary syndromes, such as acute myocardial infarction (AMI), is essential for saving the patient's life. The monitoring of cardiac biomarkers is vital in the treatment of cardiovascular diseases as it helps deliver an accurate prognosis and facilitate the selection of effective therapies.3,4 Acute events in cardiovascular diseases have been successfully diagnosed by monitoring established biochemical markers, such as creatine kinase MB, myoglobin, and cardiac troponins I and T.2–6 Cardiac troponin T (cTnT) is widely used as a specific biomarker for myocardial tissue and is considered as the “gold standard” for the serological diagnosis and prognosis of AMI due to its high sensitivity and specificity.6–8 During myocardial infarction, cTnT is immediately released into the bloodstream. Therefore, the rapid and accurate monitoring of this biomarker could improve the quality of patient care.At present, enzyme-linked immunosorbent assays and chemiluminescence are generally utilized as quantitative immunoassay methods for the detection of cTnT. However, these methods are often time-consuming or entirely lab-based, which is clearly inappropriate for performing rapid diagnoses in the context of a cardiac emergency.9 Alternative methods based on optic,10 electrochemistry,11 fluorescence12 and piezoelectric13–15 transduction have been widely reported for lab-free cTnT detection. However, these techniques also suffer from several problems: (i) expensive, difficult to be reused and cause seriously waste. (ii) Require sophisticated or expensive instrumentation, highly trained professionals to operate. (iii) Difficult to miniaturize and therefore non-transferrable to point-of-care platforms. Consequently, effective methods with high sensitivity, rapid response, cheap price and easy manipulation are still in high demand for the detection of cTnT.
Recently, magnetic biosensors based on superparamagnetic bead labels have attracted the attention of scholars worldwide due to their application potential in the development of high-sensitivity biomolecular monitoring systems. Compared with other immunosensing techniques, magnetosensor-based biosystems are easily operated, conveniently reused, provide a fast response, are entirely lab-free and highly sensitive. This means that magnetic immunosensors can be considered as a potential tool for point-of-care biomolecular monitoring systems. Until now, much effort has been made in the development of a next-generation bioanalytical system incorporating magnetosensors. Numerous magnetic sensors, such as magneto-resistive sensors,16,17 magnetic impedance,18 hall sensors,19,20 spin-valves21 and superconducting quantum interference devices22 have been reported as biosensors for biomagnetic field detection.
As one of the most important and well-developed magnetic detection technologies, fluxgate sensors are widely applied for weak magnetic field measurement due to their high sensitivity, reliability, cheap price, fast scanning speed, and wide measurement range. However, conventional fluxgate sensors are fabricated via mechanically winding coils on the magnetic sensing elements, resulting in numerous drawbacks such as large size, heaviness, and poor long-term stability, which make the devices less suitable for biomagnetic detection where compact size and portability are always in demand. Micro-fluxgate sensors fabricated though standard micro-electro-mechanical system (MEMS) technology can overcome these barriers. MEMS-based fluxgate sensors possess many advantages over traditionally fabricated fluxgate sensors, such as smaller size, lower power consumption, lower weight, better long-term stability, and compatibility with integrated circuits and lab-on-chip technology. Thus, micro-fluxgate sensors are a promising detection unit for point-of-care platforms for use in on-site biomagnetic field monitoring.
In previous studies, the MEMS-fluxgate sensors have been employed for superparamagnetic particles detection by Lei et al.23,24 and an extremely low detectable limit of 100 particles was achieved. Furthermore, in the reported patent of our group, a theoretical hypothesis of fluxgate biosensor was considered for serum tumor marker detection.25 These results indicated the application potential of fluxgate sensors in biomagnetic measurement. However, there is a paucity of studies investigating the detection of the cTnT antigens based on fluxgate sensors and magnetic particles-labels. In an effort to develop an innovative cardiac emergency monitoring system with the advantages of fluxgate sensors, we developed a simple, portable, easily manipulated, and sensitive detection biosystem based on micro-MEMS fluxgate sensors and superparamagnetic bead-labels for the quantitative detection of cTnT. We fabricated a micro-fluxgate sensor with a double layer of Co-based amorphous ribbon as a sensing element and combined using three-dimensional solenoid copper coils as control unit via MEMS technology. Superparamagnetic beads were strategically employed as recognition tags and double polyclonal antibody pairs combined using streptavidin–biotin binding were employed to capture and label the cTnT conjugated with the magnetic beads on a separate Au film-coated wafer via a classical sandwich immunoassay process. Assay parameter optimization was performed to improve the detection performance. Quantitative analysis of cTnT was performed by detecting the stray magnetic field of cTnT-labeled superparamagnetic Dynabeads with the micro-fluxgate sensor. Under optimal conditions, our system exhibited excellent sensitivity, reproducibility, stability, and specificity. A minimum detectable limit of 0.01 ng mL−1 for cTnT was achieved with a linearity range of 0.01–10 ng mL−1, i.e., a biosystem with extremely high sensitivity was developed. On account of the detection performance and other advantages of this system, such as miniaturization, quick response, and lab-free operation, our sensor can be considered as a potential tool for the development of a point-of-care diagnostic system for cardiovascular disease.
2. Experimental
2.1 Device fabrication
The ESI† section provides details of the fabrication of the micro-devices utilized in this work (Fig. S1 and S2†). It is worth mentioning that the fluxgate sensor utilized in this work contains a double layer Co-based amorphous ribbon as a sensing element to obtain a superimposed output signal from the sensor towards the externally tested magnetic field,26 thus improving the sensitivity and detection performance of our system for cTnT analysis. Three-dimensional solenoid Cu coils (one pick-up coil and two excitation coils) were applied to control the magnetic-sensitive elements of the sensor. The pick-up coil is located vertically and between the two excitation coils. The Au film-coated wafer applied for the immobilization of cTnT was fabricated on a separate glass substrate from sensor substrate using MEMS technology. The wafer was then cut into micro-substrates with an Au film (5 × 3 mm2) on each of them. The fabricated micro-devices utilized in this work are shown in Fig. 1.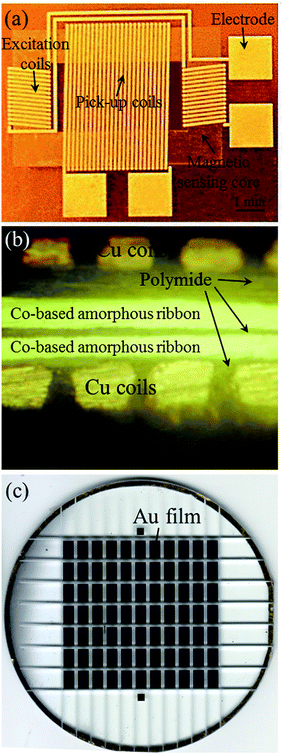 | ||
| Fig. 1 (a) Photograph of the micro-fluxgate sensor, (b) the cross section image of the sensor, (c) photograph of the Au film (5 × 3 mm2) substrates. | ||
2.2 Reagents
Dynabeads® M-280 Streptavidin were purchased from Invitrogen Co. Ltd (Shanghai, China). These are uniform, superparamagnetic beads with a 2.8 μm diameter and streptavidin monolayer covalently coupled to the hydrophilic surface. Human native cTnT antigen, mouse anti-human cTnT polyclonal antibody and biotinylated mouse cTnT polyclonal antibody were also purchased from Invitrogen Co. Ltd (Shanghai, China). Phosphate buffer tablets (pH 7.4) were purchased from Medicago AB (Uppsala, Sweden). Phosphate-buffered saline (PBS, pH 7.4) was prepared with phosphate buffer tablets and deionized water. We purchased 11-mercaptoundecanoic acid (11-MUA) and 1-ethyl-3-[3-dimethylaminopropyl]carbodiimide (EDC) hydrochloride from Aladdin Chemistry Co. Ltd (Beijing, China). We purchased N-hydroxysulfosuccinimide sodium salt (NHS) from Medpep Co. Ltd. (Shanghai, China). Bovine serum was purchased from Yuanmu Co. Ltd (Shanghai, China). Human serum were utilized for real sample tests to demonstrate the potential of our method in practical applications. The human serum were obtained from supernatant extraction of human blood samples after standing for more than 4 hours, and the blood samples were taken from healthy adult man. All these experiments were performed in compliance with the relevant laws and institutional guidelines of China. The study protocol was approved by the Shanghai Jiao Tong University Ethics Committee, and operated in accordance with the Declaration of Helsinki. Informed consents were obtained from all human participants.2.3 Antibody-conjugation to magnetic beads
We washed 200 μL of Dynabeads® M-280 Streptavidin (1 mg mL−1) twice with PBS buffer and deionized water, then resuspended them in 200 μL of deionized water. Biotinylated polyclonal cTnT antibody (3 mg mL−1, 200 μL) was subsequently added to the washed beads and incubated for 1 h at room temperature to be immobilized onto the beads. An external magnet was used to separate MB-antibody to remove and re-disperse excess unbound antibodies. UV-vis absorption spectra were utilized to check that the magnetic beads were conjugated with the antibodies. Fig. 2 presents the UV-vis absorption spectra of the magnetic bead suspension, antibody solution, and anti-MB suspension. A broad absorption peak can be observed at approximately 490 nm in the spectrum of the magnetic beads suspension and an absorption peak at 320 nm in the spectrum of the antibody solution. In the spectrum of the antibody-MB suspension, two absorption peaks are located at 324 and 480 nm, corresponding to the absorption peak of the magnetic beads suspension and antibody suspension. This result demonstrated that the cTnT antibody was successfully immobilized on the surface of the magnetic beads though streptavidin–biotin binding. SEM images and EDS analysis was also utilized to determine the structure of the superparamagnetic beads with and without antibody-conjugation (Fig. S3† in detail). However, due to the huge size difference between the magnetic beads and the antibodies, no clear difference can be found in the magnetic beads before and after antibody-conjugation from the SEM characterizations.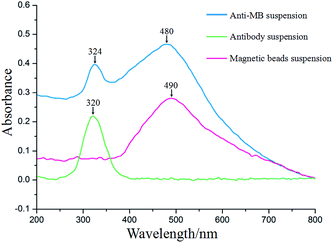 | ||
| Fig. 2 UV-vis absorption spectra of the magnetic beads suspension, antibody solution, and anti-MB suspension. | ||
2.4 Modification of cTnT antibodies on the Au film substrate
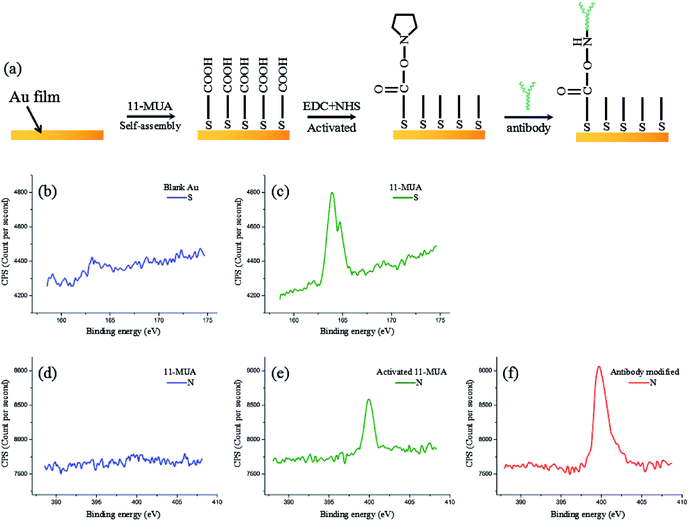
We used 11-MUA on the self-assembled layers, which were dropped onto the Au film substrate to form the 11-MUA molecular membranes through Au–S covalent bonds. Then, the Au film was incubated in a solution of 0.2 mol L−1 EDC and 0.05 mol L−1 NHS to activate the COOH group of 11-MUA at room temperature for 1 h. We then washed the layers in PBS solution. After drying, the cTnT polyclonal antibody was modified on the Au film substrate by incubating the wafer in 2 mg mL−1 antibody solutions for 1 h at room temperature. Fig. 3(a) shows the schema of the modification process and XPS analysis of each modification procedure (Fig. 3(b)–(f)). Fig. 3(b) and (c) show clear peaks at the binding energy of S after modifying 11-MUA on the Au film, which confirms that the self-assembled monolayers were modified on the Au film. Then, obvious increases in N were found in samples after the EDC + NHS activation of 11-MUA (Fig. 3(d) and(e)). Finally, a further dramatic increase in the binding energy of N was seen after the modification of cTnT antibodies (Fig. 3(e) and (f)). Since the basic components of anti-cTnT antibodies are acids mostly composed of N, this indicated that the cTnT antibodies were successfully modified on the Au film.2.5 Preparation of cTnT samples
Different amounts of cTnT antigen were spiked into 200 μL of bovine serum for the preparation of imitation serum samples with different cTnT concentrations (0.01 ng mL−1, 0.05 ng mL−1, 0.1 ng mL−1, 1 ng mL−1, 10 ng mL−1) to mimic real sample detection in complex media.2.6 Assay method for cTnT analysis based on the new system
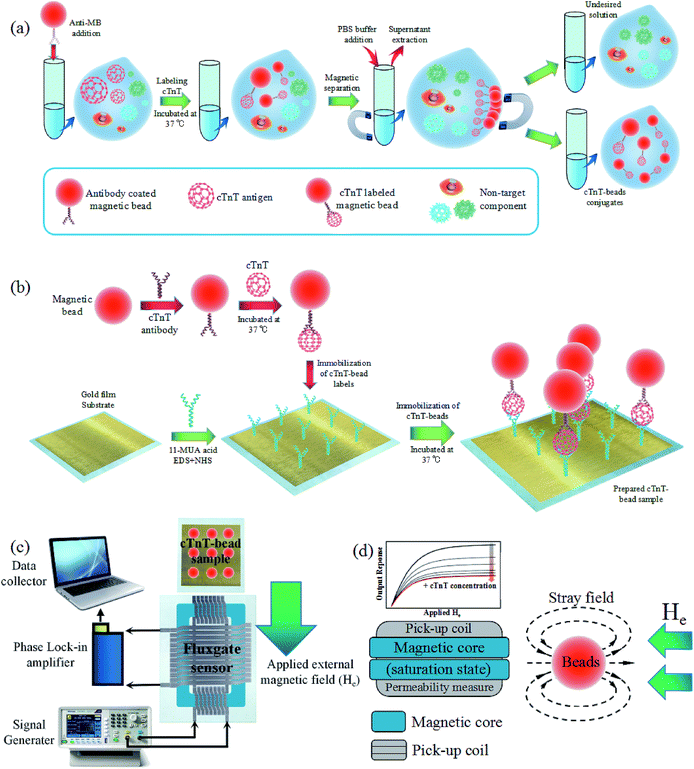
We spiked 40 μL of polyclonal anti-cTnT antibody-coated superparamagnetic Dynabeads (600 μg mL−1) into 40 μL of the prepared cTnT imitation serum samples and incubated at 37 °C for 40 min in order to selectively label the cTnT antigen through the coupling of cTnT to primary polyclonal antibodies coated on the surface of the magnetic particles. We used an excess of magnetic beads during this process to ensure that the maximum amount of cTnT could interact with the antibodies on the surface of the beads. After incubation, the cTnT-bead complexes were enriched and separated into 10 μL PBS solution through intermittent magnetic separation using a permanent magnet to remove the undesired component in the sample (Fig. 4(a)), thus ensuring the accuracy of the test results without background interference. The separated cTnT-bead solution was then dropped onto the Au film-coated micro-wafer and incubated for another 40 min at 37 °C to facilitate the containment of the cTnT-bound beads on the polyclonal antibody-modified Au film through the conjugating of cTnT to the modified secondary cTnT antibodies (Fig. 4(b)). Then the wafer with cTnT-beads was washed with PBS solution to remove excess magnetic particles that did not undergo immunoreactions to eliminate the interference of the undesired magnetic signal caused by excess beads.The detection and quantification of cTnT was performed by placing the micro-wafer with the captured cTnT-bead complexes at the front of the new micro-fluxgate sensor, as shown in Fig. 4(c). During the test, an external static magnetic field parallel to the axis of the pick-up coils of the micro sensor was provided to obtain better interval sensitivity of the sensor and the tested labelled magnetic bead samples were magnetized by the applied magnetic field, causing the beads to emit a stray field in which they were detectable. The basic working mechanism of the fluxgate sensor is as follows. The soft magnetic material of the Co-based amorphous ribbon used as the sensing element periodically enters the magnetic saturation state in response to the excitation current generated in the excitation coils. At the saturation point, the permeability of the sensing element changes significantly in response to the minor variation in the external tested magnetic field. In the cTnT detection case, when the superparamagnetic labelled bead samples were placed in front of the sensor and exposed to the applied external field, a stray magnetic field mostly unidirectional and opposite to the applied external field was induced due to the superparamagnetic nature of the magnetic beads (Fig. 4(d)). Consequently, this induced stray field of the beads may have decreased the effective field experienced by the sensing element of the sensor, potentially decreasing the output response of the sensor system. Through the difference in output response, we determined the level of the magnetic particles-labeled cTnT in the sample.
3. Results and discussion
3.1 Optimization of the test conditions of the fluxgate sensor system
The sensitivity of the micro-fluxgate sensor is characterized as it determines the minimum detection limit within the biosystem. Intensity measurement of the external magnetic field (He) was initially performed with the fabricated micro-fluxgate sensor without any samples. Fig. 5 shows the output voltages of the detection system with the excitation coils driven by AC currents with varying effective values.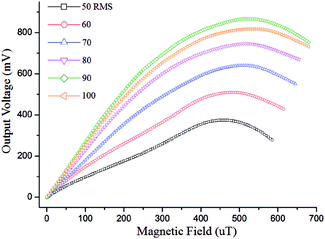 | ||
| Fig. 5 Relationship between sensor sensitivity and excitation current. RMS = root mean square current. | ||
As shown in Fig. 5, the sensitivity of our sensor increased with increasing excitation current up to 90 mA and then decreased as the excitation current continued to increase beyond this point. This was mainly due to the fact that an excitation current that is too great can increase eddy current loss in the magnetic sensitive element of the sensor,27 decreasing the output response of the system. In line with this, the following parameter was selected for the detection experiments: an excitation root mean square (RMS) current of 90 mA, which was proven to be an optimal condition for the detection sensitivity of the fabricated sensor. Under this condition, a maximum second harmonic signal (1.683 mV μT−1) was achieved. The same excitation conditions, i.e. excitation RMS current of 90 mA, were used in the following experiments in this paper.
3.2 Optimization of assay parameters for cTnT immunoassay
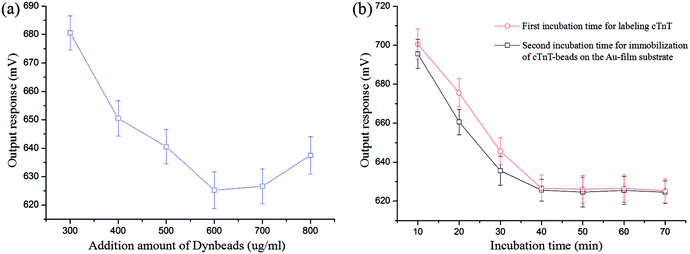
To obtain better performance for cTnT analysis, a series of optimization experiments, including the amount of magnetic particles added during the labeling process and the incubation time for labeling and immobilization of the cTnT, were conducted using 10 ng mL−1 of cTnT.As illustrated in Fig. 6(a), the output response of our system initially decreased with increasing amounts of superparamagnetic Dynabeads during the cTnT labeling process until it reached a maximum at 600 μg mL−1, indicating saturated binding between the magnetic beads and cTnT. After the amount of Dynabeads exceeded 600 μg mL−1, the output signal exhibited an uptrend, probably due to the presence of too many Dynabeads causing aggregation subsequently reducing the number of available cTnT labeling sites on the beads.28 Hence, 600 μg mL−1 of superparamagnetic Dynabeads was chosen as the appropriate amount for the labeling process.
The incubation time greatly affected the analytical performance of the proposed biosystem. Fig. 6(b) shows that the output voltage of our sensor decreased with increasing incubation time and reached a plateau at 40 min for both the cTnT labeling process and the cTnT-Dynabead conjugates immobilization process. This means that the binding of the cTnT antigen and polyclonal antibody was saturated at 40 min and a shorter incubation time would affect the extent of the immunoreaction, resulting in lower sensor response. Thus, 40 min was selected as the optimum time in the two incubation steps.
3.3 Detection sensitivity and linearity for cTnT assay
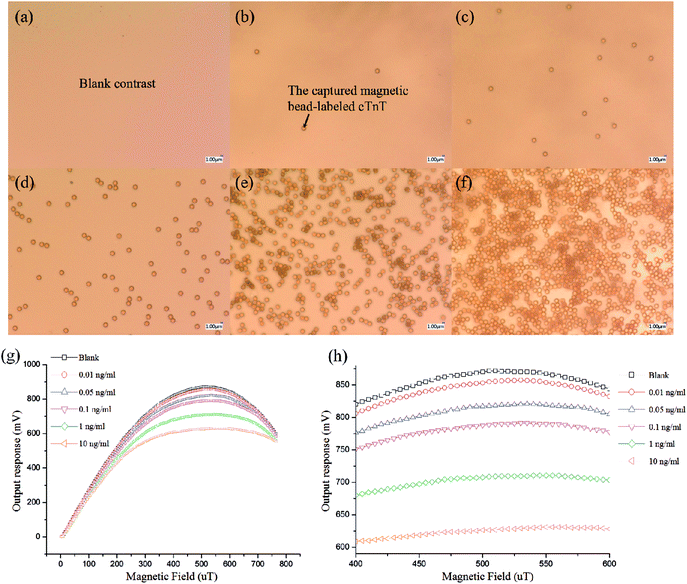
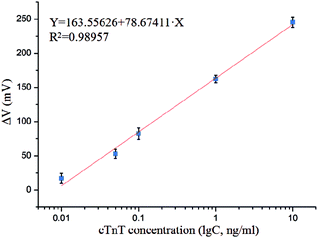
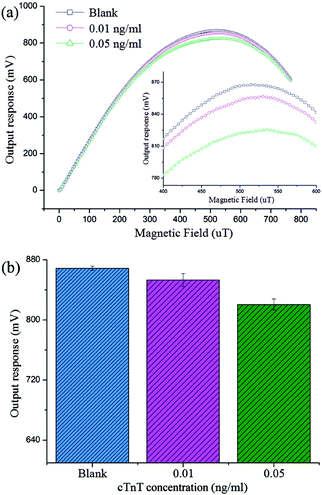
Under optimal conditions, the photographs of cTnT coupled with superparamagnetic Dynabead samples in different concentrations are shown in Fig. 7(a)–(f), where the quantities of Dynabeads can be seen to obviously increase with increasing cTnT concentration. Fig. 7(g) and (h) shows the output response of our system toward various cTnT samples. As described above, due to the stray field of the cTnT-labeled magnetic beads decreasing the effective field experienced by the micro-sensor, an overall decrease in output voltage was observed in the presence of cTnT samples and the response time of this biosystem was <5 s. A minimum detection limit of 0.01 ng mL−1 cTnT was successfully achieved by our system, indicating that this system represents an ultra-sensitive detection method for cTnT based on micro-fluxgate sensors and superparamagnetic Dynabead labels. Moreover, Fig. 7(g) shows that at a low external magnetic field range (less 400 μT), minor variations were found in the output signal of the sensor system, mainly due to the low magnetic susceptibility of the magnetic beads under low external fields. However, in external magnetic fields >600 μT, the difference between the output voltage at different sample concentrations also decreased, mainly due to the stray field of magnetic beads becoming strongly overwhelmed under large external magnetic fields. The maximum difference in the output signal of our sensor can be found around the applied field of 500 μT and no interactions between any two curves were observed in the field range of 400–600 μT (Fig. 7(h)), indicating that each concentration of sample can be clearly distinguished by our system.Fig. 8 indicates the relationship of output to cTnT concentrations. A straightforward linear relationship between the cTnT concentration and ΔV of the biosystem can be observed. The linear regression equation could be expressed as follows: ΔV = 163.55626 + 78.67411 × X (X= lg![[thin space (1/6-em)]](https://www.rsc.org/images/entities/char_2009.gif) C, ng mL−1) with a correlation coefficient of 0.98957. ΔV represents the degree of output change, ΔV = (Vno − Vsample), where Vno and Vsample are the output signal in the absence and presence of cTnT. This can be utilized for further quantitative analysis. Moreover, we compared the performance of this system to that of recently reported methods (shown in Table 1). Our sensing system boasts a very low detection limit with a relatively wide linear range. The previously reported gold nanoparticles-based piezoelectric sensor and nanoparticle-based chemiluminescence technique show much higher sensitivity than the present system. However, the piezoelectric sensing system is based on piezoelectric transduction, which is always associated with the need for sophisticated and expensive instrumentation, professional and technical personnel, difficulties in miniaturization. The nanoparticle-based chemiluminescence methods are based on enzyme-linked immunosorbent assays, which are entirely lab-based and non-transferrable to point-of-care platforms. Our proposed method is simple, easy to manipulate, can be miniaturized, and involves no requirement for a lab. Furthermore, since the micro-sensor utilized in this work can be easily fabricated via MEMS and is compatible with lab-on-chip technology, it can be easily integrated into an electronic biochip for in situ analysis of cTnT, particularly in the context of point-of-care platforms.
C, ng mL−1) with a correlation coefficient of 0.98957. ΔV represents the degree of output change, ΔV = (Vno − Vsample), where Vno and Vsample are the output signal in the absence and presence of cTnT. This can be utilized for further quantitative analysis. Moreover, we compared the performance of this system to that of recently reported methods (shown in Table 1). Our sensing system boasts a very low detection limit with a relatively wide linear range. The previously reported gold nanoparticles-based piezoelectric sensor and nanoparticle-based chemiluminescence technique show much higher sensitivity than the present system. However, the piezoelectric sensing system is based on piezoelectric transduction, which is always associated with the need for sophisticated and expensive instrumentation, professional and technical personnel, difficulties in miniaturization. The nanoparticle-based chemiluminescence methods are based on enzyme-linked immunosorbent assays, which are entirely lab-based and non-transferrable to point-of-care platforms. Our proposed method is simple, easy to manipulate, can be miniaturized, and involves no requirement for a lab. Furthermore, since the micro-sensor utilized in this work can be easily fabricated via MEMS and is compatible with lab-on-chip technology, it can be easily integrated into an electronic biochip for in situ analysis of cTnT, particularly in the context of point-of-care platforms.
| Materials and methods | Detection technique | Concentration range (ng mL−1) | Detection limit (ng mL−1) | Ref. |
|---|---|---|---|---|
| Nanostructured film based on carbon nanotubes | Electrochemical | 0.033–10 | 0.033 | 29 |
| Piezoelectric immunosensor based on gold particles | Piezoelectric | 0.0015–0.5 | 0.0015 | 14 |
| Nanoparticle-based chemiluminescence technique | Chemiluminescence | 0.002–10 | 0.002 | 30 |
| Aminobenzoic acid film-based immunoelectrode | Amperometric | 0.016–0.5 | 0.016 | 31 |
| Nano-gap-electrode device | Surface potential | 0.1–10 | 0.1 | 32 |
| Surface plasmon resonance sensor | Optimal | 0.05–4.5 | 0.05 | 33 |
| Fluxgate sensor based on magnetic particles | Magnetism | 0.01–10 | 0.01 | Here |
3.4 Specificity, reproducibility, and stability
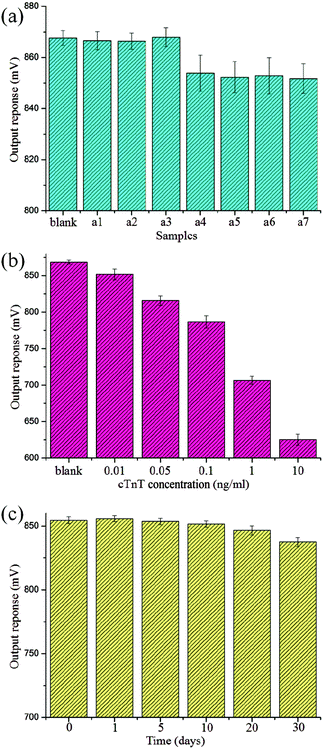
The specificity of this new biosystem for cTnT detection was tested via an interference experiment by incubating the Au film substrate with other interfering markers. The assay was performed under the same experimental procedures and the ratio between the target analyte and the interfering agent was 1![[thin space (1/6-em)]](https://www.rsc.org/images/entities/char_2009.gif) :
:![[thin space (1/6-em)]](https://www.rsc.org/images/entities/char_2009.gif) 10. As shown in Fig. 9(a), when the system was exposed to an interfering agent only, the output response of our sensor was as weak as when exposed to a blank sample. When cTnT coexisted with these interfering agents, the output voltage decreased greatly and no significant difference was found compared to the response to cTnT only. The results indicate a highly selective and specific detection capability for cTnT antigens.
10. As shown in Fig. 9(a), when the system was exposed to an interfering agent only, the output response of our sensor was as weak as when exposed to a blank sample. When cTnT coexisted with these interfering agents, the output voltage decreased greatly and no significant difference was found compared to the response to cTnT only. The results indicate a highly selective and specific detection capability for cTnT antigens.
To monitor the reproducibility of this method, five repeated measurements for each concentration of sample were performed under an external magnetic field of 500 μT. The results are shown in Fig. 9(b); a relative standard deviation of 0.97% for five successive measurements (1 ng mL−1) was observed, indicating satisfactory reproducibility.
Stability is also a very important factor for assessing the immunosensor. As shown in Fig. 9(c), the response of the new sensor retained approximately 98.01% of its initial value after storage at 4 °C in a refrigerator for 30 d. These results suggest that the stability of the immunosensor was excellent.
3.5 Real samples detection of cTnT in human serum
The detection of real samples is crucial before a biosensor can be considered for practical application. Consequently, we conducted a simple experiment by placing the cTnT antigens into native human serum samples, and then tested these serum samples using the immunoassay method described above. The human serum were obtained from supernatant extraction of human blood samples after standing for more than 4 hours, and the blood samples were taken from healthy adult man. The experiments were performed within the guidelines of relevant laws and institutional guidelines of China. The study was approved by the Shanghai Jiao Tong University Ethics Committee, and operated in accordance with the Declaration of Helsinki. Informed consents were obtained from all human participants. As can be clearly seen in Fig. 10, an detection limit of 0.01 ng mL−1 concentration cTnT was still successfully detected by our sensor system for human serum tests under the same assay parameters discussed in our paper, demonstrating the potential of our sensor in practical applications.4. Conclusion
We developed a sensitive assay system based on a flexible micro-fluxgate sensor and an immunomagnetic bead immunoassay for the quantitative detection of cTnT antigens. In the proposed biosystem, immunomagnetic microbeads were utilized as recognition tags for selectively labeling cTnT through the specific conjugation of cTnT to anti-cTnT polyclonal antibodies. A separate Au film substrate was applied as an immunoplatform for immobilization of the cTnT coupled with magnetic bead conjugates using a modified self-assembled anti-cTnT antibody layer combined via streptavidin–biotin binding. The detection and quantification of the immobilized cTnT-bead complexes was implemented by detecting the stray field of cTnT-labeled magnetic beads under an applied external magnetic field using the micro-fluxgate sensor. The resulting system successfully achieved the detection of cTnT with desirable sensitivity, stability, reproducibility, and selectivity. A minimum detection limit as low as 0.01 ng mL−1 of cTnT was achieved with a linearity range of 0.01–10 ng mL−1, suggesting that the proposed biosystem exhibits high sensitivity. Compared to recently reported cTnT detection methods, which require sophisticated instrumentation, professional and technical personnel to operate, or are entirely lab-based, the method proposed in this study is simple, readily manipulated, and entire lab-free in addition to being highly sensitive. On account of the detection performance and other advantages such as stability, reproducibility, and portability, this biosensing system can be considered as a potential candidate for the in situ analysis of cTnT, particularly in point-of-care platforms.Conflicts of interest
There are no conflicts to declare.Acknowledgements
This work is supported by The National Natural Science Foundation of China (No. 61273065), National Science and Technology Support Program (2012BAK08B05), Natural Science Foundation of Shanghai (13ZR1420800), Support fund of Shanghai Jiao Tong University (AgriX2015005), Support fund of Joint research center for advanced aerospace technology of Shanghai Academy of Spaceflight Technology-Shanghai Jiao Tong University (USCAST2015-2), Support fund of Aerospace Technology (15GFZ-JJ02-05), Natural Science Foundation of Henan Province (162300410233), Nanhu Scholars Program for Young Scholars of XYNU, the Analytical and Testing Center in Shanghai Jiao Tong University, the Center for Advanced Electronic Materials and Devices in Shanghai Jiao Tong University.References
- S. P. Whelton, J. W. Mcevoy, M. Lazo, J. Coresh, C. M. Ballantyne and E. Selvin, Diabetes Care, 2017, 40, 261 CrossRef PubMed.
- J. Liu, D. Wang, Y. Xiong, B. Liu, Z. Hao and W. Tao, PLoS One, 2016, 11(2), e0148444 Search PubMed.
- H. Mannoji, F. Hayashi, T. Kubota, Y. Ikeda, H. Ishibashi-Ueda and S. Kato, Intern. Med., 2016, 55(21), 3215 CrossRef PubMed.
- A. Mehdiani, P. Akhyari, H. Kamiya, J. Ahlers, E. Godehardt and A. Albert, Acta Cardiol., 2017, 1 Search PubMed.
- S. Singal, A. K. Srivastava, S. Dhakate, A. M. Biradar and Rajesh, RSC Adv., 2015, 5(92), 74994–75003 RSC.
- L. Cullen, M. Than and W. F. Peacock, J. Am. Coll. Cardiol., 2014, 64(6), 632–633 CrossRef PubMed.
- A. H. B. Wu and L. Ford, Clin. Chim. Acta, 1999, 284(2), 161–174 CrossRef CAS.
- M. Ostermann, S. Ayis, E. Tuddenham, J. Lo, K. Lei and J. Smith, Shock, 2017, 47(6), 702 CrossRef CAS PubMed.
- C. Zong, D. Zhang, H. Yang, S. Wang, M. Chu and P. Li, Microchim. Acta, 2017, 184(9), 3197–3204 CrossRef CAS.
- R. F. Dutra and L. T. Kubota, Clin. Chim. Acta, 2007, 376(1), 114–120 CrossRef CAS PubMed.
- N. R. Shanmugam, A. P. Selvam, T. W. Barrett, S. C. Kazmierczak, M. N. Rana and S. Prasad, Future Sci. OA, 2015, 1(3), 1–10 Search PubMed.
- K. S. Song, S. B. Nimse, M. D. Sonawane, Y. Lin, Z. Zhou and T. Kim, Analyst, 2017, 142, 3816–3821 RSC.
- K. Wong-Ek, O. Chailapakul, N. Nuntawong, K. Jaruwongrungsee and A. Tuantranont, Biomed. Tech., 2010, 55(5), 279–284 CrossRef CAS PubMed.
- R. A. S. Fonseca, J. Ramosjesus, L. T. Kubota and R. F. Dutra, Sensors, 2011, 11(11), 10785–10797 CrossRef CAS PubMed.
- A. B. Mattos, T. A. Freitas, V. L. Silva and R. F. Dutra, Sens. Actuators, B, 2012, 161(1), 439–446 CrossRef CAS.
- G. Kokkinis, S. Cardoso and F. Keplinger, Sens. Actuators, B, 2017, 241, 438–445 CrossRef CAS.
- E. K. Wujcik, H. Wei, X. Zhang, J. Guo, X. Yan and N. Sutrave, RSC Adv., 2014, 4, 43725–43745 RSC.
- L. Guo, S. Zhi and X. Sun, Sens. Actuators, B, 2017, 247, 1–10 CrossRef CAS.
- M. Volmer and M. Avram, Microelectron. Eng., 2013, 108(108), 116–120 CrossRef CAS.
- D. Issadore, Y. I. Park and H. Shao, Magnetic sensing technology for molecular analyses, Lab Chip, 2014, 14, 2385–2397 RSC.
- A. Chicharo, F. Cardoso and S. Cardoso, IEEE Trans. Magn., 2014, 50, 1–4 CrossRef.
- P. E. Magnelind, Y. J. Kim, A. N. Matlashov, S. G. Newman, P. L. Volegov and M. A. Espy, Supercond. Sci. Technol., 2014, 27(4), 044031 CrossRef.
- J. Lei, C. Lei, T. Wang, Z. Yang and Y. Zhou, J. Micromech. Microeng., 2013, 23(9), 095005 CrossRef.
- J. Lei, T. Wang, C. Lei and Y. Zhou, Appl. Phys. Lett., 2013, 102(2), 166–170 Search PubMed.
- Y. Zhou, C. Lei and J. Lei, CN Pat., CN102937649A, 2013.
- C. Lei, J. Lei, Z. Yang and Y. Zhou, Microsyst. Technol., 2013, 19(2), 167–172 CrossRef CAS.
- J. Lei, C. Lei and Y. Zhou, Measurement, 2012, 45(3), 535–540 CrossRef.
- X. Zhang and S. N. Ding, ACS Sens., 2016, 1(4), 358–365 CrossRef CAS.
- S. L. R. Gomes-Filho, A. C. M. S. Dias, M. M. S. Silva, B. V. M. Silva and R. F. Dutra, Microchem. J., 2013, 109(14), 10–15 CrossRef CAS.
- W. Shen, D. Tian, H. Cui, D. Yang and Z. Bian, Biosens. Bioelectron., 2011, 27(1), 18–24 CrossRef CAS PubMed.
- A. B. Mattos, T. A. Freitas, L. T. Kubota and R. F. Dutra, Biochem. Eng. J., 2013, 71(2), 97–104 CrossRef CAS.
- H. T. Hsueh and C. T. Lin, Biosens. Bioelectron., 2016, 79, 636–643 CrossRef CAS PubMed.
- R. F. Dutra, R. K. Mendes, V. L. D. Silva and L. T. Kubota, J. Pharm. Biomed. Anal., 2007, 43(5), 1744–1750 CrossRef CAS PubMed.
Footnote |
| † Electronic supplementary information (ESI) available. See DOI: 10.1039/c7ra10355g |
| This journal is © The Royal Society of Chemistry 2017 |

