 Open Access Article
Creative Commons Attribution 3.0 Unported Licence
Hydrothermal synthesis and Cl2 sensing performance of porous-sheets-like In2O3 structures with phase transformation†
Pei Li *,
Chenglong Cai,
Tiedong Cheng and
Yanguo Huang
School of Electrical Engineering and Automation, Jiangxi University of Science and Technology, Ganzhou 341000, China. E-mail: lipei8143706@163.com; Tel: +86-797-8312059
First published on 1st November 2017
Abstract
A facile hydrothermal route was employed to synthesize the porous-sheets-like In2O3 structures without any surfactant and template. The morphologies of the porous-sheets-like In2O3 structures consisted of many thin sheets with length of 40–120 nm, and the amount of Fe-doped significantly affected the overall morphologies and the phase transformation of In2O3. Furthermore, the formation mechanism of the porous-sheets-like In2O3 structure is investigated, which revealed that the doping of Fe plays a significant role in the self-assembled and oriented attachment mechanism of In2O3, and the phase transformation of In2O3 (the pure bcc-In2O3 was transformed into the pure rh-In2O3) also contributed to the formation of the porous-sheets-like In2O3 structure. Finally, the gas sensing characteristics of the products were studied. The results demonstrated that the sensor based on porous-sheets-like In2O3 structures (the coexistence of bcc-In2O3 and rh-In2O3) exhibited a much higher response (54.7 ± 5.3 for 5 ppm Cl2) to Cl2 than those pure bcc-In2O3 without Fe (S1) and pure rh-In2O3 (S5 and S6) samples, so the phase transformation influences on the gas sensing performance of In2O3. The porous-sheets-like In2O3 structures (S4) had the biggest surface area (42.5 m2 g−1), which contributed to the improvement of the gas sensing characteristics, the gas sensing mechanism were also studied.
Introduction
As n-type semiconductors with a wide band gap (Eg = 3.6 eV),1 In2O3 has been proven to be a highly sensitive material for the detection of both reducing and oxidizing gases, such as trimethylamine (N(CH3)3),2 C2H5OH,3 HCHO,4 CH3COCH3,5 CO,6 O3,7 H2S,8 Cl2,9 and NO2,10 et al. To enhance the functional properties of In2O3, the size, shape, surface chemistry, defect, and dispersion should be designed carefully. In particular, high surface area and nano-scale dimensions are the key factors to determine the gas response for application as gas sensors.11–13 Up to now, In2O3 nano-/microstructure with different morphologies, such as nanocrystals,14–16 1D nanowires/nanobelts,17,18 2D thin films,19,20 2D nanosheets,21 3D hierarchical structures,22–24 3D nanotowers25,26 have been developed. And 2D nanosheets are considered to be the most effective and promising candidates as gas sensors due to their unique structures with low density and high surface area.27Meanwhile, doping is another simple and feasible approach to improve sensing performance by the way of catalytic effect, decreasing grain size, facilitating adsorption of gas, and so on.28–30 For example, Zhang et al. found that the self-assembled hierarchical Au-loaded In2O3 hollow microspheres with superior ethanol sensing properties which is up to 9 times compared with the pure In2O3.31 Ding et al. indicate that the Ag doped In2O3 (1%) is almost 23 times higher than that of the sensor based on pure In2O3 toward 1 ppm NO2.32 Moreover, the doping metal nanoparticles also can be integrated into the original hierarchical nanostructures, and the morphology would affect directly on the redox reaction at its surface by the doping elements. Wei et al. presented with the increase of Ce doping amount, the average sizes of the flower-like spheres were decrease, and the boundaries of as-prepared In2O3 microstructures gradually become more and more unconspicuous.33 Li et al. found that by introduce of Fe, the flower-like structures (pure In2O3) collapsed into thin sheet-based structures (Fe doped In2O3).21
In2O3 has two phases: cubic In2O3 (bcc-In2O3) and rhombohedral In2O3 (rh-In2O3).34,35 The stable form of In2O3 is body-centered cubic bixbyite-type crystal (bcc-In2O3), while the metastable corundum-type In2O3 (rh-In2O3) is rhombohedral.36 The corundum In2O3 exhibits more stable conductivity than that of the cubic counterpart.37 The rh-In2O3 transformed into the bcc-In2O3 phase under certain physical and chemical conditions, if the change of crystal structure can reduce the free energy of the system, which may affects the morphology and the gas sensing characteristic of In2O3.
Herein, we report a facile hydrothermal route for the phase transformation of In2O3 structures (the pure bcc-In2O3 was transformed into the coexistence of bcc-In2O3 and rh-In2O3, then transformed into the pure rh-In2O3) with doped an appropriate amount of Fe. The morphologies of the porous-sheets-like In2O3 structures consisted of many thin sheets with length of 40–120 nm. The obtained nanomaterials were analyzed by scanning electron microscopy (SEM), transmission electron microscopy (TEM) characteristic techniques, ICP-MS instrument, and N2 adsorption/desorption tests. The gas sensing properties of the resulting materials have also been investigated. The introduction of a small quantity of Fe in the reaction system was found to weigh heavily in the phase transformation of In2O3 structures, which affected the gas sensing properties of Cl2.
Material and methods
Materials
The chemical reagents indium nitrate hydrate (In(NO3)3·4.5H2O), ferric nitrate hydrate (Fe(NO3)3·9H2O), polyvinyl pyrrolidone (PVP), ethylene glycol were of analytical grade and used without further purification. All the chemical reagents were purchased from Shanghai Chemical Co.Synthesis
In a typical synthesis, 10 mL ethylene glycol was added into 30 mL distilled water under constantly strong stirring for 15 min. Then, 1.5 mmol of In(NO3)3·4.5H2O, 0.1500 g polyvinyl pyrrolidone, and different amounts of Fe(NO3)3·9H2O were added into distilled water under constantly strong stirring. After being stirred for another 30 min, the solutions were transferred into 60 mL Teflon-lined stainless steel autoclaves. The autoclaves were heated at 140 °C for 12 h, and then cooled down to room temperature naturally. The reddish brown precipitates were separated by centrifugation, then washed with distilled water and anhydrous ethanol for several times, respectively, and dried at 80 °C for 6 h. Finally, porous-sheets-like Fe-doped In2O3 structures were obtained after a thermal treatment at 500 °C for 2 h. We refer to these samples as S1, S2, S3, S4, S5 and S6, representing pure In2O3, and the In/Fe molar ratios of 15![[thin space (1/6-em)]](https://www.rsc.org/images/entities/char_2009.gif) :
:![[thin space (1/6-em)]](https://www.rsc.org/images/entities/char_2009.gif) 1, 12
1, 12![[thin space (1/6-em)]](https://www.rsc.org/images/entities/char_2009.gif) :
:![[thin space (1/6-em)]](https://www.rsc.org/images/entities/char_2009.gif) 1, 9
1, 9![[thin space (1/6-em)]](https://www.rsc.org/images/entities/char_2009.gif) :
:![[thin space (1/6-em)]](https://www.rsc.org/images/entities/char_2009.gif) 1, 7
1, 7![[thin space (1/6-em)]](https://www.rsc.org/images/entities/char_2009.gif) :
:![[thin space (1/6-em)]](https://www.rsc.org/images/entities/char_2009.gif) 1, and 5
1, and 5![[thin space (1/6-em)]](https://www.rsc.org/images/entities/char_2009.gif) :
:![[thin space (1/6-em)]](https://www.rsc.org/images/entities/char_2009.gif) 1, respectively.
1, respectively.
Characterization
The phase structure and purity of the as-synthesized products were examined by X-ray diffraction (XRD; X'pert PRO MPD, Philips, Eindhoven, The Netherlands) with Cu-Kα radiation (λ = 1.5406 Å) at 40 kV, 30 mA over the 2θ range 20–70°. The morphology of the obtained samples was investigated by using field emission scanning electron microscopy (FE-SEM; JSM-6701F, JEOL, Tokyo, Japan), and high resolution transmission electron microscopy (HRTEM; Tecnai F30G2, FEI, Hillsboro, OR, USA) operated at 300 kV accelerating voltage. The chemical state is examined by high-resolution X-ray photoelectron spectroscopy (XPS) on a spectrometer (ESCALAB250Xi, Thermo Fisher Scientific, Waltham, MA, USA) with a monochromatic Al Kα source. An Agilent 7500a model ICP-MS system (Agilent Technologies, State of California, USA) was used for simultaneous multielement detection of Fe ions. The ICP-MS instrument is a Babington nebulizer with a double pass quartz spray chamber, the frequency RF generator is 10 MHz; the output power is 1220 W; the flow rate for Ar gas, auxiliary gas and nebuliser gas is 20 L min−1, 0.9 L min−1 and 1–1.2 L min−1, respectively; the sample uptake rate is 400 μL min−1; the integration time is 0.1 s; and the wavelength is 206.200 nm. The porous characterization of the In2O3 structures was obtained by full analysis of N2 adsorption/desorption tests (V-Sorb 2800P, Gold APP Instruments Corporation, Beijing, China). The AC impedance spectroscopy was measured with a precision impedance analyzer (4294A, Agilent, Santa Clara, CA, USA).Gas sensor fabrication and measurements
The basic fabricated process is the same of reference.38 The as-obtained In2O3 products were slightly grinded with α-terpineol in an agate mortar to form a gas sensing paste. The paste was coated on an alumina tube with Au electrodes and platinum wires, dried under IR light for several minutes in air, and then sintered at 500 °C for 2 h. A Ni–Cr alloy crossing alumina tube was used as a heating resistor which ensured both substrate heating and temperature control. In order to improve their stability, the gas sensors were aged at 300 °C for 240 h in air.The gas sensing properties were tested by using a gas response instrument (HW-30A, Hanwei Ltd, Zhengzhou, China). The gas sensing properties of the In2O3 structures were tested in a glass test chamber, and the volume of the test chamber was 15 L. In the measuring electric circuit of the gas sensor, a load resistor was connected in series with a gas sensor. The circuit voltage Vc was 5 V, and the output voltage (Vout) was the terminal voltage of the load resistor RL. The working temperature of the sensor was adjusted by varying the heating voltage Vh. When a given amount of tested gas was injected into the chamber, the resistance of the sensor changed. As a result, the output voltage changed. The gas response (S) is defined as eqn (1) and (2):
For an oxidizing gases:
| Response = Rg/Ra | (1) |
For a reducing gases:
| Response = Ra/Rg | (2) |
Results and discussion
Crystalline structure and morphology
Fig. 1a shows the XRD patterns of the pure In2O3 and Fe-doped In2O3 structures of S1, S2, S3, S4, S5 and S6 (from bottom to top). All the strong and sharp diffraction peaks marked by a diamond can be readily indexed to a cubic lattice [space group Ia![[3 with combining macron]](https://www.rsc.org/images/entities/char_0033_0304.gif) (206)] of pure In2O3 according to the Joint Committee on Powder Diffraction Standards (JCPDS) data card no. 06-0416. All diffraction peaks marked by a circle can be readily indexed to a rhombohedral lattice [space group R
(206)] of pure In2O3 according to the Joint Committee on Powder Diffraction Standards (JCPDS) data card no. 06-0416. All diffraction peaks marked by a circle can be readily indexed to a rhombohedral lattice [space group R![[3 with combining macron]](https://www.rsc.org/images/entities/char_0033_0304.gif) c(167)] of pure In2O3 according to the JCPDS data card no. 22-0336. The XRD results show that with the increasing of Fe concentration, the pure bcc-In2O3 (S1) tended to be transformed into the coexistence of bcc-In2O3 and rh-In2O3 (S2, S3 and S4), and then transformed into the pure rh-In2O3 (S5 and S6).
c(167)] of pure In2O3 according to the JCPDS data card no. 22-0336. The XRD results show that with the increasing of Fe concentration, the pure bcc-In2O3 (S1) tended to be transformed into the coexistence of bcc-In2O3 and rh-In2O3 (S2, S3 and S4), and then transformed into the pure rh-In2O3 (S5 and S6).
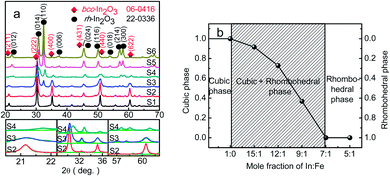 | ||
| Fig. 1 (a) XRD patterns of pure In2O3 and Fe-doped In2O3 structures, and (b) relative concentration of the bcc-In2O3 phase with respect to the rh-In2O3 phase as a function of In/Fe molar ratios. | ||
According to the three Gaussian profiles fitting of the curves,39 the intensities were determined for the bcc-In2O3 (400), bcc-In2O3 (440), and rh-In2O3 (012), rh-In2O3 (110) peaks. The relative phase concentration of the bcc-In2O3 phase in respect of the rh-In2O3 phase was estimated from profile fitting. The fractions of bcc-In2O3 (bcc) and rh-In2O3 (rh) phases were determined using the relations of eqn (3) and (4):
 | (3) |
| rh = (1 − bcc) | (4) |
As expected, the bcc-In2O3 phase fraction decreased with the decreasing of In/Fe molar ratios, as shown in Fig. 1b. Pure bcc-In2O3 phase was presence without Fe doped, while the coexistence of bcc-In2O3 and rh-In2O3 appeared by introducing of Fe (the In/Fe molar ratios were 15![[thin space (1/6-em)]](https://www.rsc.org/images/entities/char_2009.gif) :
:![[thin space (1/6-em)]](https://www.rsc.org/images/entities/char_2009.gif) 1, 12
1, 12![[thin space (1/6-em)]](https://www.rsc.org/images/entities/char_2009.gif) :
:![[thin space (1/6-em)]](https://www.rsc.org/images/entities/char_2009.gif) 1 and 9
1 and 9![[thin space (1/6-em)]](https://www.rsc.org/images/entities/char_2009.gif) :
:![[thin space (1/6-em)]](https://www.rsc.org/images/entities/char_2009.gif) 1), with further increasing of Fe content (the In/Fe molar ratios were 7
1), with further increasing of Fe content (the In/Fe molar ratios were 7![[thin space (1/6-em)]](https://www.rsc.org/images/entities/char_2009.gif) :
:![[thin space (1/6-em)]](https://www.rsc.org/images/entities/char_2009.gif) 1 and 5
1 and 5![[thin space (1/6-em)]](https://www.rsc.org/images/entities/char_2009.gif) :
:![[thin space (1/6-em)]](https://www.rsc.org/images/entities/char_2009.gif) 1), sole rh-In2O3 phase was presence. When the In/Fe molar ratio was 9
1), sole rh-In2O3 phase was presence. When the In/Fe molar ratio was 9![[thin space (1/6-em)]](https://www.rsc.org/images/entities/char_2009.gif) :
:![[thin space (1/6-em)]](https://www.rsc.org/images/entities/char_2009.gif) 1 (S4), the bcc-In2O3 fraction was 36.8%, while the intensity of the rh-In2O3 reflection was 63.2%, indicating the presence of the coexistence of bcc-In2O3 and rh-In2O3. The degree of bcc-In2O3 remained unchanged throughout the two-phase region, only the relative amounts of the bcc-In2O3 and rh-In2O3 phases changed.
1 (S4), the bcc-In2O3 fraction was 36.8%, while the intensity of the rh-In2O3 reflection was 63.2%, indicating the presence of the coexistence of bcc-In2O3 and rh-In2O3. The degree of bcc-In2O3 remained unchanged throughout the two-phase region, only the relative amounts of the bcc-In2O3 and rh-In2O3 phases changed.
The cell parameters for bcc-In2O3 and rh-In2O3 and the size of the crystallites determined with the Scherrer formula were listed in Table 1. As can be seen, the above calculated lattice constants compare well with the literature values of a = b = c = 10.118 Å (bcc-In2O3, JCPDS 06-0416), and a = b = 5.487 Å, c = 14.510 Å (rh-In2O3, JCPDS 22-0336). The size of the crystallites were 12.62, 11.97, 13.63, 10.84, 12.90, 13.11 nm for S1, S2, S3, S4, S5 and S6, respectively.
| Sample | bcc-In2O3 (cell parameters) | rh-In2O3 (cell parameters) | D (nm) | Theoretical In/Fe (molar ratio) | Actual Fe3+ contents (wt%) | |
|---|---|---|---|---|---|---|
| a = b = c (Å) | a = b (Å) | c (Å) | ||||
| S1 | 10.0956 | — | — | 12.62 | — | — |
| S2 | 10.1109 | 5.4406 | 14.3219 | 11.97 | 15![[thin space (1/6-em)]](https://www.rsc.org/images/entities/char_2009.gif) : :![[thin space (1/6-em)]](https://www.rsc.org/images/entities/char_2009.gif) 1 1 |
1.20 |
| S3 | 10.1201 | 5.4542 | 14.3207 | 13.63 | 12![[thin space (1/6-em)]](https://www.rsc.org/images/entities/char_2009.gif) : :![[thin space (1/6-em)]](https://www.rsc.org/images/entities/char_2009.gif) 1 1 |
1.49 |
| S4 | 10.1268 | 5.4623 | 14.3560 | 10.84 | 9![[thin space (1/6-em)]](https://www.rsc.org/images/entities/char_2009.gif) : :![[thin space (1/6-em)]](https://www.rsc.org/images/entities/char_2009.gif) 1 1 |
1.97 |
| S5 | — | 5.4590 | 14.3614 | 12.90 | 7![[thin space (1/6-em)]](https://www.rsc.org/images/entities/char_2009.gif) : :![[thin space (1/6-em)]](https://www.rsc.org/images/entities/char_2009.gif) 1 1 |
2.46 |
| S6 | — | 5.4516 | 14.4008 | 13.11 | 5![[thin space (1/6-em)]](https://www.rsc.org/images/entities/char_2009.gif) : :![[thin space (1/6-em)]](https://www.rsc.org/images/entities/char_2009.gif) 1 1 |
3.41 |
The concentration of Fe element in Fe-doped In2O3 structures was determined by using ICP-MS instrument, as shown in Table 1. The results indicate that the Fe3+ content (wt%) is very low in different amounts of Fe-doped samples, and the Fe3+ content increased with the decreasing of In/Fe molar ratios. The actual Fe3+ contents were 0, 1.20%, 1.49%, 1.97%, 2.46%, 3.41% (wt%) for S1, S2, S3, S4, S5 and S6, respectively.
Fig. 2a–f shows the SEM images of the pure bcc-In2O3, the coexistence of bcc-In2O3 and rh-In2O3 structures, and the pure rh-In2O3 structures. They indicate that Fe doping plays an important role in controlling the phase transformation and the morphology of In2O3. As shown in Fig. 2a, pure bcc-In2O3 consists of cubes with a size of 80–400 nm. Upon the introduction of Fe, the morphology of In2O3 changed into a mixture of cubes and porous thin sheets. With the increase of the amount of Fe doping, the number of cubes decreased, while the number of porous thin sheets increased, as shown in Fig. 2b–f. As depicted in Fig. 2b, very few porous thin sheets were present in S2 sample, with a size of 30–50 nm. Upon further increasing the Fe doping concentration (S3–S6), the amount and the size of cubes decreased sharply, while most of the In2O3 nanostructures consisted of porous thin sheets with larger size. When the In/Fe molar ratio was 9![[thin space (1/6-em)]](https://www.rsc.org/images/entities/char_2009.gif) :
:![[thin space (1/6-em)]](https://www.rsc.org/images/entities/char_2009.gif) 1 (S4), as shown in Fig. 2d, a mass of porous thin sheets was appeared, with length of 40–120 nm, meanwhile, there existed very few cubes with length of 70 nm. On further increasing the Fe doping amount (S5 and S6), sole rh-In2O3 phase was presence. As can been seen from Fig. 2(e and f), some of the porous thin sheets agglomerated and grown into larger flakes, the size of the flakes increased further to 0.6–1 mm, which may destroy the morphology and affect the Cl2 sensing performance of In2O3.
1 (S4), as shown in Fig. 2d, a mass of porous thin sheets was appeared, with length of 40–120 nm, meanwhile, there existed very few cubes with length of 70 nm. On further increasing the Fe doping amount (S5 and S6), sole rh-In2O3 phase was presence. As can been seen from Fig. 2(e and f), some of the porous thin sheets agglomerated and grown into larger flakes, the size of the flakes increased further to 0.6–1 mm, which may destroy the morphology and affect the Cl2 sensing performance of In2O3.
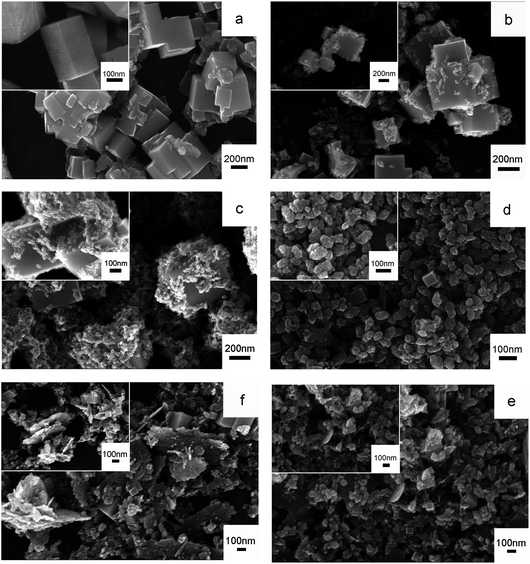 | ||
| Fig. 2 SEM images of (a) S1, (b) S2, (c) S3, (d) S4, (e) S5 and (f) S6 (inset: high-magnification SEM images of S1–S6). | ||
Transmission electron microscopy (TEM) is then employed to gain further insight into the porous-sheets-like Fe-doped In2O3 structures. Fig. 3a shows the TEM image of the porous-sheets-like In2O3 structures (S4), it shows that the diameter of the porous thin sheets is 50–100 nm, which is consistent with the value estimated in the SEM image (Fig. 2d). The corresponding HRTEM image (Fig. 3b) exhibits well-defined lattice fringes, and two kinds of lattice spacing can be observed. The lattice spacing of 0.291 nm corresponds to the (222) plane of bcc-In2O3, and the lattice spacing of 0.396 nm corresponds to the (012) plane of rh-In2O3.
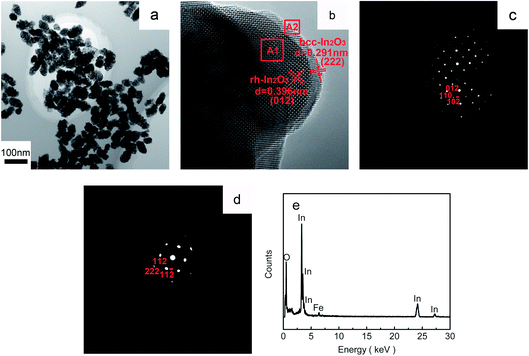 | ||
| Fig. 3 (a) TEM and (b) HRTEM images of the porous-sheets-like Fe-doped In2O3 (S4); SAED patterns taken from the corresponding areas marked (c) A1 and (d) A2; and (e) the EDX spectrum of S4. | ||
Fig. 3c and d show the SAED patterns taken from the corresponding marked areas of A1 and A2, respectively. Fig. 3c indicates that the porous-sheets-like Fe-doped In2O3 grows along the [012] direction for rh-In2O3, while Fig. 3d demonstrates that the crystals grew along the [222] direction for bcc-In2O3, which is consistent with the values estimated from the HRTEM image (Fig. 3b). The EDX spectroscopy (Fig. 3e) shows that the porous-sheets-like Fe-doped In2O3 structures are elementally composed of In, Fe and O. The atomic ratio for In, Fe and O calculated from the EDX analysis was In/Fe/O = 31.01![[thin space (1/6-em)]](https://www.rsc.org/images/entities/char_2009.gif) :
:![[thin space (1/6-em)]](https://www.rsc.org/images/entities/char_2009.gif) 1.66
1.66![[thin space (1/6-em)]](https://www.rsc.org/images/entities/char_2009.gif) :
:![[thin space (1/6-em)]](https://www.rsc.org/images/entities/char_2009.gif) 67.31 (atomic ratio).
67.31 (atomic ratio).
To further investigate the chemical state of the containing elements in the porous-sheets-like Fe-doped In2O3 structures (S4), the XPS data were collected and are presented in Fig. 4. The fully scanned spectra (Fig. 4a) shows the survey spectrum of Fe-doped In2O3, which indicates that the surface area of the synthesized material has elements of In, O, C and Fe. The C element is ascribed to adventitious carbon-based additives and the C 1s, whose banding energy peak locating at 284.6 eV, is used as reference for calibration.16 The high resolution XPS spectrum of O 1s in Fig. 4b could be resolved to two Gaussian function peaks with the energy of 530.3 eV and 531.5 eV,32 which are attributed to two kinds of oxygen species on the surface of the material. The O 1s core level spectrum recorded on the sample was a little asymmetric, because of α peaks are associated with lattice oxygen of In2O3 and the β peaks are arisen from the surface hydroxyl oxygen of In2O3.31 The In 3d spectrum (shown in Fig. 4c) has two strong peaks at binding energy of 444.6 and 452.0 eV. They can be respectively indexed to the characteristic spin–orbit split states of In 3d5/2 and In 3d3/2 originated from In–O in In2O3 lattice,40 indicating an In oxidation state of +3. Fig. 4d shows the high-resolution XPS spectrum of Fe 2p. It reveals the doublet Fe 2p3/2 and 2p1/2 with binding energies of 710.9 and 724.8 eV, respectively. Both peaks are accompanied by satellite structures with higher binding energy (approximately 8 eV), which is characteristic of the Fe3+ species.41 The XPS analysis results show the atomic ratio for In, Fe and O was In/Fe/O = 31.15![[thin space (1/6-em)]](https://www.rsc.org/images/entities/char_2009.gif) :
:![[thin space (1/6-em)]](https://www.rsc.org/images/entities/char_2009.gif) 1.58
1.58![[thin space (1/6-em)]](https://www.rsc.org/images/entities/char_2009.gif) :
:![[thin space (1/6-em)]](https://www.rsc.org/images/entities/char_2009.gif) 67.27 (atomic ratio). Hence, we have successfully synthesized Fe-doped In2O3 structures.
67.27 (atomic ratio). Hence, we have successfully synthesized Fe-doped In2O3 structures.
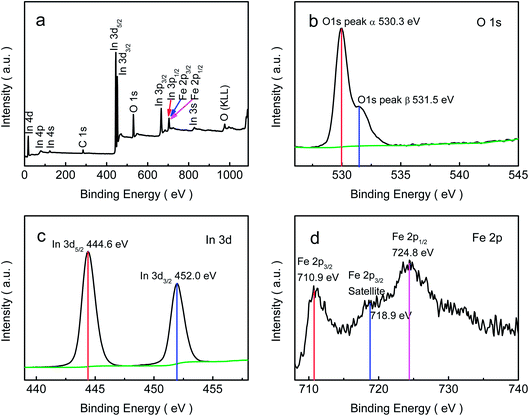 | ||
| Fig. 4 XPS spectra of the porous-sheets-like Fe-doped In2O3 (S4): (a) fully scanned spectra, (b) O 1s, (c) In 3d, (d) Fe 2p. | ||
Determination of specific surface area and porosity
Fig. 5a and ESI Fig. A(1–5)† show the N2 adsorption/desorption isotherms of the pure In2O3 and Fe-doped In2O3 structures. According to the IUPAC classification, the similar N2 adsorption/desorption isotherms of the six samples can be classified as a type IV isotherm, with a hysteresis loop where desorption required definitively higher energy than adsorption. The isotherms of the porous-sheets-like Fe-doped In2O3 (S4) show a hysteresis loop at a relatively high pressure indicating the largest surface area. The amount of N2 adsorbed was higher for S4 (459.8 cm3 g−1) than S1 (178.8 cm3 g−1), S2 (232.5 cm3 g−1), S3 (323.9 cm3 g−1), S5 (402.3 cm3 g−1), or S6 (366.3 cm3 g−1).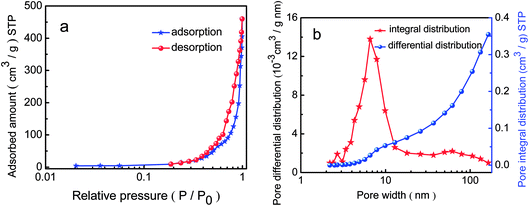 | ||
| Fig. 5 N2 adsorption–desorption curves (a) and the pore size distribution (b) of the porous-sheets-like Fe-doped In2O3 (S4). | ||
The pore size distributions are reported in Fig. 5b, apparently, the pore size of the porous-sheets-like Fe-doped In2O3 (S4) concentrate between 2 and 10 nm. The results suggest that a small pore size distribution and uniform pore structure were obtained. The steepness of desorption branch verified the uniformity of the pore diameter with narrow distribution. Moreover, it is evident that both small and large pore diameters were in the mesopore region. The pores in the porous-sheets-like Fe-doped In2O3 structure also has been proved by the SEM image (Fig. 2d) and the TEM image (Fig. 3a).
Phase transformation mechanism and formation mechanism of the porous-sheets-like Fe-doped In2O3 structures
We found that the concentration of Fe-doped determine both crystal phase and morphology of In2O3 in the final products.According to some literatures,38,42,43 the two phases of In2O3 (bcc-In2O3 and rh-In2O3) will transform to each other when sufficient energy is made available, although the rh-In2O3 is the so-called metastable states and the bcc-In2O3 is stable states. In certain physical and chemical conditions, if the change of crystal structure reduced the free energy of the system, the polymorphism transformation was inevitable. The added Fe3+ ions changed the growth rate in the crystal plane of bcc-In2O3 phase, so the displacive transformation of bcc-In2O3 structure happened and transformed into the rh-In2O3 phase. In result, some bcc-In2O3 phase is transformed into the rh-In2O3 phase, with further increasing of Fe content, sole rh-In2O3 phase was presence. XRD patterns of the samples obtained at different In/Fe molar ratios of 0, 15![[thin space (1/6-em)]](https://www.rsc.org/images/entities/char_2009.gif) :
:![[thin space (1/6-em)]](https://www.rsc.org/images/entities/char_2009.gif) 1, 12
1, 12![[thin space (1/6-em)]](https://www.rsc.org/images/entities/char_2009.gif) :
:![[thin space (1/6-em)]](https://www.rsc.org/images/entities/char_2009.gif) 1, 9
1, 9![[thin space (1/6-em)]](https://www.rsc.org/images/entities/char_2009.gif) :
:![[thin space (1/6-em)]](https://www.rsc.org/images/entities/char_2009.gif) 1, 7
1, 7![[thin space (1/6-em)]](https://www.rsc.org/images/entities/char_2009.gif) :
:![[thin space (1/6-em)]](https://www.rsc.org/images/entities/char_2009.gif) 1, and 5
1, and 5![[thin space (1/6-em)]](https://www.rsc.org/images/entities/char_2009.gif) :
:![[thin space (1/6-em)]](https://www.rsc.org/images/entities/char_2009.gif) 1 reveals the tendency of phase transformation, which is shown in Fig. 1a. Without Fe, the obtained sample was bcc-In2O3 (S1), when In/Fe molar ratios was increased to 15
1 reveals the tendency of phase transformation, which is shown in Fig. 1a. Without Fe, the obtained sample was bcc-In2O3 (S1), when In/Fe molar ratios was increased to 15![[thin space (1/6-em)]](https://www.rsc.org/images/entities/char_2009.gif) :
:![[thin space (1/6-em)]](https://www.rsc.org/images/entities/char_2009.gif) 1–9
1–9![[thin space (1/6-em)]](https://www.rsc.org/images/entities/char_2009.gif) :
:![[thin space (1/6-em)]](https://www.rsc.org/images/entities/char_2009.gif) 1 (S2, S3 and S4), the prepared samples were mixture of bcc-In2O3 and rh-In2O3, and upon the increase of the amount of Fe, relative amounts of the rh-In2O3 increased. Pure rh-In2O3 was obtained when In/Fe molar ratios reached to 7
1 (S2, S3 and S4), the prepared samples were mixture of bcc-In2O3 and rh-In2O3, and upon the increase of the amount of Fe, relative amounts of the rh-In2O3 increased. Pure rh-In2O3 was obtained when In/Fe molar ratios reached to 7![[thin space (1/6-em)]](https://www.rsc.org/images/entities/char_2009.gif) :
:![[thin space (1/6-em)]](https://www.rsc.org/images/entities/char_2009.gif) 1 and 5
1 and 5![[thin space (1/6-em)]](https://www.rsc.org/images/entities/char_2009.gif) :
:![[thin space (1/6-em)]](https://www.rsc.org/images/entities/char_2009.gif) 1 (S5 and S6).
1 (S5 and S6).
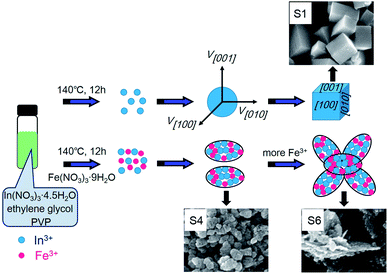
The formation mechanism of the porous sheets-like Fe-doped In2O3 structures was also proposed. The whole growth process was illustrated in the scheme of Fig. 6. The concentration of Fe-doped also determine the morphology of In2O3, and the corresponding SEM images are shown in Fig. 2a–f. Without Fe (S1), cubes were formed. By increasing the In/Fe molar ratios to 15![[thin space (1/6-em)]](https://www.rsc.org/images/entities/char_2009.gif) :
:![[thin space (1/6-em)]](https://www.rsc.org/images/entities/char_2009.gif) 1 (S2), some porous thin sheets appeared with large number of cubic. Upon further increasing the Fe doping concentration of (S3–S6), the amount of cubes decreased sharply, while most of the In2O3 sample consisted of porous thin sheets. However, more Fe resulted in the agglomeration of the porous thin sheets (S5 and S6). These experimental results reveal that the amount of Fe affects the morphology.
1 (S2), some porous thin sheets appeared with large number of cubic. Upon further increasing the Fe doping concentration of (S3–S6), the amount of cubes decreased sharply, while most of the In2O3 sample consisted of porous thin sheets. However, more Fe resulted in the agglomeration of the porous thin sheets (S5 and S6). These experimental results reveal that the amount of Fe affects the morphology.
Without Fe, the obtained sample was pure bcc-In2O3, the bcc-In2O3 was simply enclosed by {001} faces because these faces have the slowest growth rate and lowest surface energy. The cubic shape is consistent with the cubic crystal structure of In2O3.44 In the In2O3 cubic structure, the {001} family of planes contain three equivalent planes, (100), (010), and (001), which are perpendicular to the three directions [100], [010], and [001], respectively. The In2O3 nanocrystallites grow in all three directions at an equal speed.45,46 Consequently, the cubic morphology of the product enclosed with crystal faces of {001} is obtained (S1 in Fig. 2a).
After the doping of Fe, the bcc-In2O3 structure was transformed into the rh-In2O3 phase. During the hydrolyzation process of rh-In2O3, the generation rate of the In(OH)3 nanoparticles was slow in solution. The relative slow generation rate of In(OH)3 is favorable for the subsequent growth of 2D nanosheets-like-structures along with the determined direction. Then, these primary nanoparticles self-assembly by oriented attachment aggregated into sheets (S2–S6 in Fig. 2b–f). As the larger ionic radius induces the higher diffusion barrier, the diffusion coefficient is lower with a bigger radius.47 Because of the larger size of indium ions (In3+: 80 pm, Fe3+: 64 pm), the diffusion of iron ions through the In2O3–Fe interface is faster than that of indium ions to the In2O3–Fe interface, the gradual inward diffusion of iron ions leads to the increase of the overall size of the porous thin sheets. So, with increasing of Fe-added amount, the diameter of porous thin sheets increased, as shown in Fig. 2b–d. With further increasing of Fe-doped amount (S5 and S6), the diameter of porous thin sheets continues to increase, some of the porous thin sheets agglomerated and grown into larger flakes, as shown in Fig. 2e and f.
Gas sensing properties
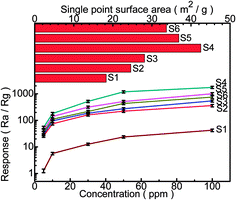
Fig. 7 displays the plots of gas response versus the gas concentration when the sensors based on the samples with different amounts of Fe were exposed to Cl2 with the concentration ranging from 5 to 100 ppm at 300 °C. The results show that the response increased for each sensor with the increasing of the concentration of Cl2. The sensors based on Fe-doped structures exhibit a much higher response than those based on the pure In2O3 structures (S1), and the In/Fe molar ratio 9![[thin space (1/6-em)]](https://www.rsc.org/images/entities/char_2009.gif) :
:![[thin space (1/6-em)]](https://www.rsc.org/images/entities/char_2009.gif) 1 (S4) sensor has the highest response. The appropriate addition of Fe would be beneficial to the improvement of the gas sensing properties, but superabundant addition may reduce the available adsorption sites and worse the gas sensing properties. It reveals that the porous-sheets-like Fe-doped In2O3 structures (S4) sensor has the highest response which can reach 54.7 ± 5.3, 180.3 ± 18.8, 517.3 ± 52.2, 1186.8 ± 117.1, 1752.5 ± 169.9 for 5, 10, 30, 50, and 100 ppm Cl2, respectively. Therefore, the following study of the selectivity was focused on the S4 sensor.
1 (S4) sensor has the highest response. The appropriate addition of Fe would be beneficial to the improvement of the gas sensing properties, but superabundant addition may reduce the available adsorption sites and worse the gas sensing properties. It reveals that the porous-sheets-like Fe-doped In2O3 structures (S4) sensor has the highest response which can reach 54.7 ± 5.3, 180.3 ± 18.8, 517.3 ± 52.2, 1186.8 ± 117.1, 1752.5 ± 169.9 for 5, 10, 30, 50, and 100 ppm Cl2, respectively. Therefore, the following study of the selectivity was focused on the S4 sensor.
The single point surface area was clearly the largest for S4 (42.5 m2 g−1) than S1 (18.3 m2 g−1), S2 (24.6 m2 g−1), S3 (28.1 m2 g−1), S5 (36.9 m2 g−1), or S6 (33.7 m2 g−1), which is shown in Fig. 7. The increase in surface area for S4 is due to its porous-sheets-like structural features, which was evidenced by the SEM images, TEM images and the pore size distribution (BET). With the support of the pores in the surface of the porous-sheets-like structures, the BET specific surface became larger. The larger the surface area, the easier the mass transport of Cl2 in the material. So, the porous-sheets-like Fe-doped In2O3 (S4) possess excellent gas sensing characteristics.
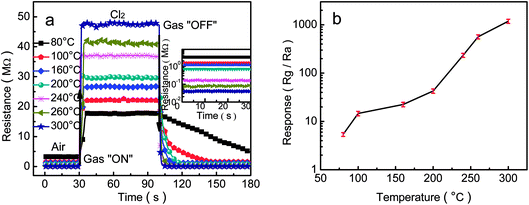
As we know, the gas-sensing properties of a sensor have an important relationship with the operating temperature. To find the optimum detection temperature of the sensors based on the porous-sheets-like Fe-doped In2O3 structures (S4), we investigated the sensor responses to 50 ppm Cl2 at the operating temperature from 80 °C to 300 °C, as indicated in Fig. 8a. From which it can be obviously observed accompanied by the increasing operating temperature, the response values of the sensor increasing. It is mainly owing to activation energy barrier of chem-sorption and surface reactions overcome by the increasing thermal energy.48 Such behaviour can be understood by considering the role of the kind of adsorption oxygen and the characteristic of Cl2, the oxygen adsorption depends on the particle size, large specific area of the material, and the operating temperature of the sensor.49 In2O3 is typical of the performance of a surface-controlled gas sensor. With increasing the temperature in ambience, the state of oxygen adsorbed on the surface of the as-prepared porous-sheets-like In2O3 structures material. The species of physical adsorption oxygen (O2− (ads)) or chemical adsorption oxygen (O− (ads), O22− (ads)) depends on the material,50,51 while the surface adsorbed oxygen changes with the change of the operating temperature. When the working temperature is lower (<160 °C), most of the adsorbed oxygen is O2− (ads), indicated as physical adsorption; with the increase of the working temperature (160 °C < T < 300 °C), the O2− (ads) is transformed into the O− (ads), showed as the chemical adsorption. The reaction rate of chemical oxygen adsorption (O− (ads)) is higher than the physical adsorption (O2− (ads)).52 As the amount of adsorbed oxygen increase with the operation temperature, the responses increase with operating temperature. When the Cl2 was injected in the test chamber, the Cl2 was adsorbed on the surface of the gas sensing materials, and then reacted with the oxygen adsorbed on the surface of the In2O3, leading to an increase in sensor resistance.
Moreover, it can be seen from Fig. 8b that the response increased with the operating temperature, when the operating temperature was 300 °C, the response was 1186.8 ± 117.1 for 50 ppm Cl2. Therefore, we chose 300 °C as the operating temperature for the subsequent detections of the porous-sheets-like Fe-doped In2O3 structures.
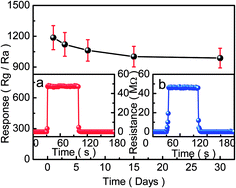
Under the optimum operating temperature of 300 °C, the typical response/recovery curve of the porous-sheets-like Fe-doped In2O3 structures (S4) to various concentrations of Cl2 (5–100 ppm) is displayed in Fig. 9a. This response transient indicated that the interaction between the porous-sheets-like Fe-doped In2O3 structures and Cl2 was reversible with a fast equilibration time. The porous-sheets-like Fe-doped In2O3 structures (S4) exhibited excellent response in the range of 5–100 ppm Cl2. With the increase of the Cl2 concentration, the responses of the sensor become higher. At low concentration, such as 5 ppm, the sensors have good response (S = 54.7 ± 5.3), indicating that a high gas response can be achieved in detecting low concentration Cl2 using the porous-sheets-like Fe-doped In2O3 structures as sensing material. Furthermore, the sensor showed a quick response and short recovery time. When exposed to 50 ppm Cl2, the response and recovery time (defined as the time required to reach 90% of the final equilibrium value) is 2 s and 5 s, respectively, indicating the fast response and quick recovery of the porous-sheets-like Fe-doped In2O3 structures (S4) sensor, as shown in Fig. 9b.
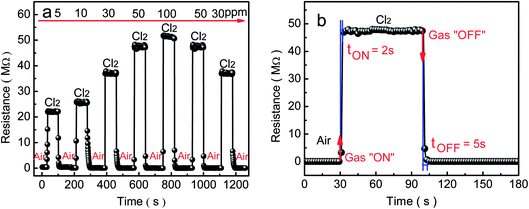 | ||
| Fig. 9 Gas response of the sensor based on the porous-sheets-like Fe-doped In2O3 structures (S4) exposed to Cl2 at (a) concentrations ranging from 5 to 100 ppm at 300 °C and (b) 50 ppm. | ||
The selectivity is a very important parameter of a gas sensor, the response of a sensor has a significant relationship with the adsorption and reaction of gas molecules on the materials surface.53 Fig. 10 displays the histogram of the response of porous-sheets-like Fe-doped In2O3 structures (S4) based sensors to eight kinds of tested gases with a concentration of 50 ppm at 300 °C. The tested gases or vapours include toluene, acetone, ammonia, nitrogen dioxide, hydrogen sulfide, formaldehyde, and gasoline, respectively. The porous-sheets-like Fe-doped In2O3 structures (S4) sensor showed the highest response to Cl2 (1186.8 ± 117.1), while its response to toluene, acetone, ammonia, nitrogen dioxide, hydrogen sulfide, formaldehyde, gasoline is 3.5 ± 0.3, 1.8 ± 0.1, 5.3 ± 0.5, 101.9 ± 11.2, 8.1 ± 0.8, 7.2 ± 0.7, and 6.4 ± 0.6, respectively. Clearly, the gas response to Cl2 is significantly higher than that to the other tested gases, with a magnitude about 11.6–659.3 times greater to 50 ppm Cl2 than that for the other tested gases under the same concentration. The above results indicates the porous-sheets-like Fe-doped In2O3 structures (S4) sensor has good selectivity to Cl2 at 300 °C.
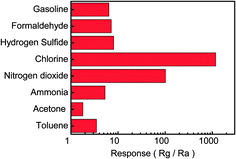 | ||
| Fig. 10 Selectivity of the porous-sheets-like Fe-doped In2O3 structures (S4) sensor to Cl2 with a concentration of 50 ppm at 300 °C. | ||
The stability of the porous-sheets-like Fe-doped In2O3 structures (S4) sensor to Cl2 with a concentration of 50 ppm at 300 °C is shown in Fig. 11. The sensor was stored in air and kept working at 300 °C for subsequent sensing property tests after the first measurement. The results show that the response decreased over time, but the response was still very high even after 30 days, indicating a good stability in a natural environment.
Based on the above results, it is reasonable to believe that the porous-sheets-like Fe-doped In2O3 structures (S4) sensor is potentially applicable to detecting the Cl2 concentration in our living environment, due to its high response, short response–recovery time, excellent selectivity and good stability.
Gas sensing mechanism
The gas sensing mechanism of the porous-sheets-like Fe-doped In2O3 structures was also discussed.Firstly, the as-prepared porous-sheets-like In2O3 structures adsorbs oxygen from the air and captures free electrons from the conduction band which causes the chemisorbed negatively charged oxygen ions (O2−, O− and O2−) and electron-depleted region generated on the surface, thus leading to the formation of a thick space charge layer and an increase of surface band bending. However, only O2−, O− could be formed when the temperature is lower than 300 °C.54 Then it would result an increase on the resistance. These adsorption processes can be expressed as eqn (5) and (7).
| O2 (gas) ⇔ O2 (ads) | (5) |
| O2 (ads) + e− → O2− (ads) | (6) |
| O2− (ads) + e− → 2O− (ads) | (7) |
When Cl2 is introduced in this condition, as the highly reactive oxidizing gas, Cl2 intensely capture electrons from the conduction band due to its higher electrophilic property, and reacted with the adsorbed oxygen species leading to the formation of adsorbed Cl− (ads), while the electron-depleted region is then further thickened. As a result, the resistance of the In2O3 sensor greatly increases. For the resistance increase, Cl2 molecule is negatively adsorbed on In2O3 to attract electrons from In2O3 (eqn (8)). On the other hand, Cl2 molecule is substituted with adsorbed oxygen (O2−(ads)) or lattice oxygen (Ox2−) to release electrons into In2O3 for resistance decrease (eqn (9) and (10)).55
Resistance increase:
 | (8) |
Resistance decrease:
 | (9) |
 | (10) |
The above reactions decrease the carrier concentration and electron mobility on the sensor surface, which led to the increase of depletion layer width accompanied by an increase in resistance. The electron transfer between In2O3 and Fe also led to the formation of an accumulation layer on the surface of the porous-sheets-like Fe-doped In2O3 structures. On the other hand, the trapped electrons were released to the porous-sheets-like Fe-doped In2O3 structures by Cl2 after the supply of Cl2 was stopped, leading to a decrease of the resistance.
The enhanced sensing performance of the porous-sheets-like Fe-doped In2O3 structures can be ascribed to its large BET surface area. The porous-sheets-like Fe-doped In2O3 structures could provide more available active surface areas because of the unique porous microstructure and its own good physicochemical properties, thus enhancing the reaction between Cl2 and the adsorbed oxygen at the optimum operating temperature of sensor. The porous microstructure also increased the BET surface area of Fe-doped In2O3 structures. As the porous-sheets-like Fe-doped In2O3 structures (S4) had the largest BET surface area (42.5 m2 g−1), the sensor could absorb more Cl2, the resistance's increasing and the resistance's decreasing became more notable, which can enhance its sensing performance.
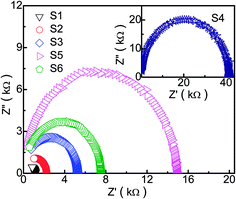
In order to observe clearly dielectric response of the pure In2O3 and Fe-doped In2O3, AC impedance spectroscopy of In2O3/Fe sensor with different amounts of Fe doping in the frequency range of 100 Hz to 10 MHz at 300 °C (50 ppm Cl2) are shown in Fig. 12. Upon the introduction of Fe, the diameter of semicircle of AC impedance spectroscopy enlarged, the impedance increased, too. The AC impedance spectroscopy of the sensor based on S4 shows the largest semicircle (the inserted in Fig. 12), which is far larger than the value of sensors based on S1, S2, S3, S5, and S6. This is mainly due to the largest surface area of the S4 sample, which leading to the largest resistance. With further increasing of Fe doping concentration, the surface area decrease, and the resistance declined. It agrees well with SEM images, N2 adsorption/desorption curve and the BET surface area value. More details of the enhancing effect of the porous-sheets-like Fe-doped In2O3 structures on sensing properties need further investigation.
Conclusions
A facile hydrothermal route for the phase transformation of In2O3 structures (the pure bcc-In2O3 was transformed into the pure rh-In2O3) without any surfactant and template was discussed. SEM images showed the molar ratio of In/Fe profoundly affected the morphologies of the In2O3/Fe composites and the porous-sheets-like Fe-doped In2O3 structures was obtained when the molar ratio of In/Fe was 9![[thin space (1/6-em)]](https://www.rsc.org/images/entities/char_2009.gif) :
:![[thin space (1/6-em)]](https://www.rsc.org/images/entities/char_2009.gif) 1 (S4). A possible growth mechanism of the porous-sheets-like Fe-doped In2O3 structures has been proposed. The gas sensing measurements demonstrated that the porous-sheets-like Fe-doped In2O3 structures (S4) sensor exhibited the highest response of 54.7 ± 5.3 for 5 ppm Cl2 at 300 °C. That is due to the large specific surface area of the porous-sheets-like Fe-doped In2O3 structures. Moreover, the sensor showed quick response–recovery behaviour, excellent selectivity and stability. Therefore, it is expected that this facile route to prepare the porous-sheets-like Fe-doped In2O3 structures would be an ideal candidate for applications in Cl2 sensors.
1 (S4). A possible growth mechanism of the porous-sheets-like Fe-doped In2O3 structures has been proposed. The gas sensing measurements demonstrated that the porous-sheets-like Fe-doped In2O3 structures (S4) sensor exhibited the highest response of 54.7 ± 5.3 for 5 ppm Cl2 at 300 °C. That is due to the large specific surface area of the porous-sheets-like Fe-doped In2O3 structures. Moreover, the sensor showed quick response–recovery behaviour, excellent selectivity and stability. Therefore, it is expected that this facile route to prepare the porous-sheets-like Fe-doped In2O3 structures would be an ideal candidate for applications in Cl2 sensors.
Conflicts of interest
There are no conflicts to declare.Acknowledgements
This work was supported by the Science Foundation of Department of Education of JiangXi Province (No. GJJ150677), the National Natural Science Foundation (61463020).Notes and references
- F. L. Gong, H. Z. Liu, C. Y. Liu, Y. Y. Gong, Y. H. Zhang, E. Meng and F. Li, 3D hierarchical In2O3 nanoarchitectures consisting of nanocuboids and nanosheets for chemical sensors with enhanced performances, Mater. Lett., 2016, 163, 236–239 CrossRef CAS.
- C. S. Lee, I. D. Kim and J. H. Lee, Selective and sensitive detection of trimethylamine using ZnO-In2O3 composite nanofibers, Sens. Actuators, B, 2013, 181, 463–470 CrossRef CAS.
- F. Huang, W. Yang, F. He and S. T. Liu, Controlled synthesis of flower-like In2O3 microrods and their highly improved selectivity toward ethanol, Sens. Actuators, B, 2016, 235, 86–93 CrossRef CAS.
- W. H. Zhang, W. C. Zhang, B. Chen, R. Shao, R. F. Guan, W. D. Zhang, Q. F. Zhang, G. H. Hou and L. Yue, Controllable biomolecule-assisted synthesis and gas sensing properties of In2O3 micro/nanostructures with double phases, Sens. Actuators, B, 2017, 239, 270–278 CrossRef CAS.
- M. Karmaoui, S. G. Leonardi, M. Latino, D. M. Tobaldi, N. Donato, R. C. Pullar, M. P. Seabra, J. A. Labrincha and G. Neri, Pt-decorated In2O3 nanoparticles and their ability as a highly sensitive (<10 ppb) acetone sensor for biomedical applications, Sens. Actuators, B, 2016, 230, 697–705 CrossRef CAS.
- Y. T. Yua, S. M. Majhia and H. G. Song, Synthesis and gas sensing properties of Au@In2O3 core-shell nanoparticles, Procedia Eng., 2016, 168, 227–230 CrossRef.
- A. Gurlo, N. Bârsan, M. Ivanovskaya, U. Weimar and W. Göpel, In2O3 and MoO3-In2O3 thin film semiconductor sensors: interaction with NO2 and O3, Sens. Actuators, B, 1998, 47, 92–99 CrossRef CAS.
- J. C. Tu, N. Li, X. Y. Lai, Y. Chi, Y. J. Zhang, W. Wang, X. T. Li, J. X. Li and S. L. Qiu, H2S-sensing properties of Pt-doped mesoporous indium oxide, Appl. Surf. Sci., 2010, 256, 5051–5055 CrossRef CAS.
- P. Li, H. Q. Fan and Y. Cai, In2O3/SnO2 heterojunction microstructures: facile room temperature solid-state synthesis and enhanced Cl2 sensing performance, Sens. Actuators, B, 2013, 185, 110–116 CrossRef CAS.
- B. X. Xiao, S. L. Song, P. Wang, Q. Zhao, M. Y. Chuai and M. Z. Zhang, Promoting effects of Ag on In2O3 nanospheres of sub-ppb NO2 detection, Sens. Actuators, B, 2017, 241, 489–497 CrossRef CAS.
- S. F. Chen, X. L. Yu, H. Y. Zhang and W. Liu, Preparation, characterization and activity evaluation of heterostructure In2O3/In(OH)3 photocatalyst, J. Hazard. Mater., 2010, 180, 735–740 CrossRef CAS PubMed.
- H. L. Tian, H. Q. Fan, M. M. Li and L. T. Ma, Zeolitic imidazolate framework coated ZnO nanorods as molecular sieving to improve selectivity of formaldehyde gas sensor, ACS Sens., 2016, 1, 243–250 CrossRef CAS.
- N. Song, H. Q. Fan and H. L. Tian, PVP assisted in situ synthesis of functionalized graphene/ZnO (FGZnO) nanohybrids with enhanced gas-sensing property, J. Mater. Sci., 2015, 50, 2229–2238 CrossRef CAS.
- A. Ilin, M. Martyshov, E. Forsh, P. Forsh, M. Rumyantseva, A. Abakumov, A. Gaskov and P. Kashkarov, UV effect on NO2 sensing properties of nanocrystalline In2O3, Sens. Actuators, B, 2016, 231, 491–496 CrossRef CAS.
- B. X Xiao, F. Wang, C. B. Zhai, P. Wang, C. H. Xiao and M. Z. Zhang, Facile synthesis of In2O3 nanoparticles for sensing properties at low detection temperature, Sens. Actuators, B, 2016, 235, 251–257 CrossRef.
- L. T. Ma, H. Q. Fan, H. L. Tian, J. W. Fang and X. Z. Qian, The n-ZnO/n-In2O3 heterojunction formed by a surface-modification and their potential barrier-control in methanal gas sensing, Sens. Actuators, B, 2016, 222, 508–516 CrossRef CAS.
- N. Singh, A. Ponzoni, E. Comini and P. S. Lee, Chemical sensing investigations on Zn-In2O3 nanowires, Sens. Actuators, B, 2012, 171–172, 244–248 CrossRef CAS.
- S. Parka, G. Suna, H. Kheela, W. Leeb, S. Leec, S. Choid and C. Lee, Synergistic effects of codecoration of oxide nanoparticles on the gas sensing performance of In2O3 nanorods, Sens. Actuators, B, 2016, 227, 591–599 CrossRef.
- J. Rombach, A. Papadogianni, M. Mischo, V. Cimalla, L. Kirste, O. Ambacher, T. Berthold, S. Krischok, M. Himmerlich, S. Selve and O. Bierwagen, The role of surface electron accumulation and bulk doping for gas-sensing explored with single-crystalline In2O3 thin films, Sens. Actuators, B, 2016, 236, 909–916 CrossRef CAS.
- Y. Y. Wang, G. T. Duan, Y. D. Zhu, H. W. Zhang, Z. K. Xu, Z. F. Dai and W. P. Cai, Room temperature H2S gas sensing properties of In2O3 micro/nanostructured porous thin film and hydrolyzation-induced enhanced sensing mechanism, Sens. Actuators, B, 2016, 228, 74–84 CrossRef CAS.
- P. Li, Y. Cai and H. Q. Fan, Porous thin sheet-based α-Fe2O3-doped In2O3 structures: hydrothermal synthesis and enhanced Cl2 sensing performance, RSC Adv., 2013, 3, 22239–22245 RSC.
- M. Gholami, A. A. Khodadadi, A. A. Firooz and Y. Mortazavi, In2O3-ZnO nanocomposites: High sensor response and selectivity to ethanol, Sens. Actuators, B, 2015, 212, 395–403 CrossRef CAS.
- P. Song, D. Han, H. H. Zhang, J. Li, Z. X. Yang and Q. Wang, Hydrothermal synthesis of porous In2O3 nanospheres with superior ethanol sensing properties, Sens. Actuators, B, 2014, 196, 434–439 CrossRef CAS.
- S. Zhang, P. Song, J. Li, J. Zhang, Z. X. Yang and Q. Wang, Facile approach to prepare hierarchical Au-loaded In2O3 porous nanocubes and their enhanced sensing performance towards formaldehyde, Sens. Actuators, B, 2017, 241, 1130–1138 CrossRef CAS.
- S. T. Jean and Y. C. He, Growth mechanism and photoluminescence properties of In2O3 nanotowers, Cryst. Growth Des., 2010, 10, 2104–2110 CAS.
- Y. J. Huang, K. Yu, Z. Xu and Z. Q. Zhu, Novel In2O3 nanostructures fabricated by controlling the kinetics factor for field emission display, Phys. E, 2011, 43, 1502–1508 CrossRef CAS.
- H. X. Dong, Y. Liu, G. H. Li, X. W. Wang, D. Xu, Z. H. Chen, T. Zhang, J. Wang and L. Zhang, Hierarchically rosette-like In2O3 microspheres for volatile organic compounds gas sensors, Sens. Actuators, B, 2013, 178, 302–309 CrossRef CAS.
- J. Zhao, T. L. Yang, Y. P. Liu, Z. Y. Wang, X. W. Li and Y. F. Sun, et al., Enhancement of NO2 gas sensing response based on ordered mesoporous Fe-doped In2O3, Sens. Actuators, B, 2014, 191, 806–812 CrossRef CAS.
- Y. L. Wang, X. B. Cui, Q. Y. Yang, J. Liu, Y. Gao and P. Sun, Preparation of Ag-loaded mesoporous WO3 and its enhanced NO2 sensing performance, Sens. Actuators, B, 2016, 225, 544–552 CrossRef CAS.
- Y. Qu, H. Wang, H. Chen, M. M. Han and Z. D. Lin, Synthesis, characterization and sensing properties of mesoporous C/SnO2 nanocomposite, Sens. Actuators, B, 2016, 228, 595–604 CrossRef CAS.
- S. Zhang, P. Song, H. H. Yan and Q. Wang, Self-assembled hierarchical Au-loaded In2O3 hollow microspheres with superior ethanol sensing properties, Sens. Actuators, B, 2016, 231, 245–255 CrossRef CAS.
- M. D. Ding, N. Xie, C. Wang, X. Y. Kou, H. Zhang, L. L. Guo, Y. F. Sun, X. H. Chuai, Y. Gao, F. M. Liu, P. Sun and G. Y. Lu, Enhanced NO2 gas sensing properties by Ag-doped hollow urchin-like In2O3 hierarchical nanostructures, Sens. Actuators, B, 2017, 252, 418–427 CrossRef CAS.
- D. D. Wei, Z. S. Huang, L. W. Wang, X. H. Chuai, S. M. Zhang and G. Y. Lu, Hydrothermal synthesis of Ce-doped hierarchical flower-like In2O3 microspheres and their excellent gas-sensing properties, Sens. Actuators, B, 2017 DOI:10.1016/j.snb.2017.07.162.
- S. W. Shu, D. B. Yu, Y. Wang, F. Wang, Z. R. Wang and W. Zhong, Thermal-induced phase transition and assembly of hexagonal metastable In2O3 nanocrystals: a new approach to In2O3 functional materials, J. Cryst. Growth, 2010, 312, 3111–3116 CrossRef CAS.
- X. Q. Wang, M. F. Zhang, J. Y. Liu, T. Luo and Y. T. Qian, Shape- and phase-controlled synthesis of In2O3 with various morphologies and their gas-sensing properties, Sens. Actuators, B, 2009, 137, 103–110 CrossRef.
- W. H. Zhang and W. D. Zhang, Biomolecule-assisted synthesis and gas-sensing properties of porous nanosheet-based corundum In2O3 microflowers, J. Solid State Chem., 2012, 186, 29–35 CrossRef CAS.
- W. H. Zhang and W. D. Zhang, Synthesis and optical properties of nanosheet-based rh-In2O3 microflowers by triethylene glycol-mediated solvothermal process, J. Phys. Chem. Solids, 2013, 74, 1271–1274 CrossRef CAS.
- P. Li, H. Q. Fan, Y. Cai, M. M. Xu, C. B. Long, M. M. Li, S. H. Lei and X. W. Zou, Phase transformation (Cubic to Rhombohedral): great effects on NO2 sensing performance of Zn-doped flower-like In2O3 structures, RSC Adv., 2014, 4, 15161–15170 RSC.
- H. Q. Fan and H. E. Kim, Perovskite stabilization and electromechanical properties of polycrystalline lead zinc niobate-lead zirconate titanate, J. Appl. Phys., 2002, 91, 317–322 CrossRef CAS.
- J. Mu, B. Chen, M. Zhang, Z. Guo, P. Zhang, Z. Zhang, Y. Sun, C. Shao and Y. Liu, Enhancement of the visible-light photocatalytic activity of In, ACS Appl. Mater. Interfaces, 2012, 1, 424–430 Search PubMed.
- K. Tian, X. X. Wang, Z. Y. Yu, H. Y. Li and X. Guo, Hierarchical and hollow Fe2O3 nanoboxes derived from metal-organic frameworks with excellent sensitivity to H2S, ACS Appl. Mater. Interfaces, 2017, 9, 29669–29676 CAS.
- C. N. R. Rao, Modern Aspects of Solid State Chemistry, Plenum Press, New York, 1970, pp. 351–353 Search PubMed.
- R. S. Zhao, Q. J. Bian and Q. C. Ling, Crystallography and mineralogy, Higher education press, Beijing, 2004, pp. 169–170 Search PubMed.
- P. Li, H. Q. Fan and Y. Cai, Mesoporous In2O3 structures: Hydrothermal synthesis and enhanced Cl2 sensing performance, Colloids Surf., A, 2014, 453, 109–116 CrossRef CAS.
- L. C. Wang, L. Y. Chen, T. Luo, K. Y. Bao and Y. T. Qian, A facile method to the cube-like MnSe2 microcrystallines via a hydrothermal process, Solid State Commun., 2006, 138, 72–75 CrossRef CAS.
- J. Yang, C. X. Li, Z. W. Quan, D. Y. Kong, X. M. Zhang, P. P. Yang and J. Lin, One-Step Aqueous Solvothermal Synthesis of In2O3 Nanocrystals, Cryst. Growth Des., 2008, 8, 695–699 CAS.
- A. M. Asaduzzaman, F. Y. Wang and G. Schreckenbach, Quantum-chemical study of the diffusion of Hg(0, I, II) into the ice(Ih), J. Phys. Chem. C, 2012, 116, 5151–5154 CAS.
- B. X. Xiao, S. L. Song, P. Wang, Q. Zhao, M. Y. Chuai and M. Z. Zhang, Promoting effects of Ag on In2O3 nanospheres of sub-ppb NO2 detection, Sens. Actuators, B, 2017, 241, 489–497 CrossRef CAS.
- Y. D. Wang, J. B. Chen and X. H. Wu, Preparation and gas-sensing properties of perovskite-type SrFeO3 oxide, Mater. Lett., 2001, 49, 361–364 CrossRef CAS.
- D. Kohl, Surface processes in the detect ion of reducing gases with SnO2-based devices, Sens. Actuators, B, 1989, 18, 71–113 CrossRef CAS.
- M. H. Cao, Y. D. Wang, T. Chen, M. Antonietti and M. Niederberger, A highly sensitive and fast-responding ethanol sensor based on CdIn2O4 nanocrystals synthesized by a nonaqueous sol-gel route, Chem. Mater., 2008, 20, 5781–5786 CrossRef CAS.
- X. H. Jia, H. Q. Fan, M. Afzaal, X. Wu and P. O'Brien, Solid state synthesis of tin-doped ZnO at room temperature: Characterization and its enhanced gas sensing and photocatalytic properties, J. Hazard. Mater., 2011, 193, 194–199 CrossRef CAS PubMed.
- E. X. Chen, H. R. Fu, R. Lin, Y. X. Tan and J. Zhang, Highly selective and sensitive trimethylamine gas sensor based on cobalt imidazolate framework material, ACS Appl. Mater. Interfaces, 2014, 6, 22871–22875 CAS.
- B. X. Xiao, D. X. Wang, S. L. Song, C. B. Zhai, F. Wang and M. Z. Zhang, Fabrication of mesoporous In2O3 nanospheres and their ultrasensitive NO2 sensing properties, Sens. Actuators, B, 2017, 248, 519–526 CrossRef CAS.
- J. Tamaki, J. Niimi, S. Ogura and S. Konishi, Effect of micro-gap electrode on sensing properties to dilute chlorine gas of indium oxide thin film microsensors, Sens. Actuators, B, 2006, 117, 353–358 CrossRef CAS.
Footnote |
| † Electronic supplementary information (ESI) available. See DOI: 10.1039/c7ra10201a |
| This journal is © The Royal Society of Chemistry 2017 |

