DOI:
10.1039/C7RA10145G
(Paper)
RSC Adv., 2017,
7, 50829-50837
Fe-based metal organic framework/graphene oxide composite as an efficient catalyst for Fenton-like degradation of methyl orange
Received
12th September 2017
, Accepted 26th October 2017
First published on 1st November 2017
Abstract
A MIL-100(Fe)/graphene oxide (GO) composite was prepared by a one-step hydrothermal method and utilized as a heterogeneous Fenton-like catalyst for methyl orange (MO) degradation. The obtained catalyst was characterized by X-ray diffraction (XRD), field-emission scanning electron microscopy (FESEM), nitrogen adsorption–desorption isotherms, thermogravimetric (TG) analysis, X-ray photoelectron spectroscopy (XPS), and Fourier transform infrared spectroscopy (FTIR). The effects of H2O2 dosage, initial pH and catalyst dosage on the degradation of MO were investigated. The MIL-100(Fe)/GO presented high catalytic activity for the degradation of MO, achieving almost complete decomposition of MO after 240 min with reaction conditions of 8 mM H2O2, pH of 3.0 and 0.5 g L−1 catalyst. Kinetics analysis showed that MO removal followed a pseudo-first-order kinetic model. The catalyst showed stable catalytic activity and reusability after three successive runs. The possible catalytic mechanism of MIL-100(Fe)/GO was also proposed.
1. Introduction
Increasing anthropogenic emissions of dye wastewater into aquatic and terrestrial environments has become one of the major threats to human health and the environmental ecosystem because of its toxicity, carcinogenicity, and non-biodegradability.1,2 Numerous methods such as adsorption, membrane separation and chemical oxidation are presently available for the removal of dye pollutants from wastewater. Of these, the Fenton reaction, as one of the advanced oxidation processes, is suggested as a promising and attractive method for its strong oxidative capacity, rapid reaction rate, general applicability and mild reaction conditions.3,4 Hydroxyl radicals (˙OH), as the main reactive species in the Fenton reaction, possess an extremely highly oxidative potential (E0 = +2.8 V vs. normal hydrogen electrode at pH = 0) and can non-selectively attack almost all the organic pollutants and finally mineralize them into harmless small molecules or even CO2 and H2O.5–7 Nonetheless, the current Fenton technology, based on ferrous ions and hydrogen peroxide, suffers from some inherent drawbacks, such as (i) rigorous operating pH range (about 2–4), (ii) introduction of a large amount of Fe salts, and (iii) requirement of further treatment for iron-containing sludge, which increases the operating costs and hinders its application on a large scale.7–9 In an attempt to deal with these issues, a heterogeneous Fenton process based on solid catalysts has been developed as an alternative to iron salt-based homogeneous Fenton reaction. To date, various kinds of solid materials, such as iron-based materials, iron-containing complexes, zero-valent iron, and bimetallic composites, have been widely studied as catalysts for heterogeneous Fenton reaction.4,7,10–12 Several strategies have also been extensively developed to improve the activity of heterogeneous Fenton catalyst, e.g. morphology modulation, reducing the size of catalyst to nanoscales, immobilizing Fe species to various supports.11,13–15 However, there is still an increasing demand for design and fabrication of effective heterogeneous Fenton-like catalysts.
Metal–organic frameworks (MOFs), constructed from self-assembly of metal ions or clusters and polyfunctional organic ligands, have emerged as an intriguing class of inorganic-organic hybrid functional materials.16–18 Owing to their unique properties of superior surface areas, highly distribution of metallic centers, easily tunable framework, and versatile functionality, MOFs have attracted numerous interests in separation, gas storage, sensor devices, drug delivery, adsorption, and heterogeneous catalysis.16,19–21 Recently, some Fe-based MOFs have been studied in heterogeneous Fenton degradation of organic pollutants.22–24 For instance, Jiang et al.22 employed MIL-53(Fe) as Fenton-like catalysts to decompose rhodamine B in the presence of H2O2. Zhao et al.23 proposed FeII@MIL-100(Fe) for heterogeneous Fenton degradation of high concentration methylene blue. These reports demonstrate that Fe-based MOFs materials possess not only abundant exposed active sites (Fe(III)) for heterogeneous Fenton reaction but also have a favorable accessibility of reactants to active sites, making them promising Fenton-like catalysts for wastewater treatment.
Graphene oxide (GO) is an attractive support material with large specific surface area, full surface accessibility, electrical conductivity, chemical stability and edge reactivity.25 As a derivative of graphene, GO has a unique two-dimensional lamellar structure with copious oxygenated functional groups like hydroxyl, epoxy, carboxyl and carbonyl groups.26 These oxygenated functional groups on GO surface can bind with the metallic centers of the MOFs and serve as activation sites for the growth of the crystals onto the surface of GO.27–29 The combination of MOFs and GO would create new micropores at the interface of both components, which would improve accessibility of reactants towards the active sites and thus diminish the mass-transfer-limitation effects during catalysis.29,30 Furthermore, previous reports also found that the GO is not only able to promote the internal electron transfer process in the composites but also induce a synergistic effect between both components to improve the catalytic activity.27,29,31,32 Several recent studies have been reported using MOF-GO hybrids for adsorption of certain gases, such as ammonia, nitrogen dioxide and carbon dioxide.28,33,34 However, to our knowledge, no study has been reported on MOF-GO hybrids for heterogeneous Fenton-like degradation of organic contaminates.
In this paper, MIL-100(Fe)/GO was synthesized by a one-step hydrothermal method and exhibited efficient Fenton catalytic activity for methyl orange (MO) degradation. The physicochemical properties of MIL-100(Fe)/GO, the influence of reaction parameters on MO removal, reaction kinetic, the stability and reusability of the catalyst, as well as the degradation mechanism were investigated.
2. Materials and methods
2.1. Materials
Reduced iron powder (Fe, ≥99%) and hydrofluoric acid (HF, ≥40%) were supplied from Aladdin Chemistry Co., Ltd. (Shanghai, China). 1,3,5-benzenetricarboxylic acid (H3BTC, 99%) was purchased from Ourchem Chemical Co., Ltd. (Shanghai, China). Methyl orange (C14H14N3NaO3S, analytical reagent), nitric acid (HNO3, 65–68%), hydrogen peroxide (H2O2, 30 wt%) and ethanol (C2H5OH, ≥99%) were obtained Beijing Chemical Reagent Co., Ltd. (Beijing, China). All chemicals were of analytical grade and used as received. The deionized water was used throughout the experiments.
2.2. Preparation of MIL-100(Fe)/GO composite
The MIL-100(Fe)/GO was synthesized according to the hydrothermal method reported by Tong et al., with a minor modification.35 Briefly, Fe powder (0.82 g), H3BTC (2.06 g) and GO (0.23 g) were mixed in deionized water (80 mL), and then the HNO3 (1.14 mL) and HF (0.6 mL) were added into above mixture. After sonicating for 0.5 h, the mixture was transferred to a Teflon-lined autoclave (100 mL) and kept at 150 °C for 4 days. After cooled to room temperature, the gray precipitate was collected by filtration, purified with hot deionized water (80 °C) and hot ethanol (60 °C) for 3 h, respectively, and finally dried overnight under vacuum at 120 °C. The content of GO in the MIL-100(Fe)/GO was calculated to be 5 wt%.
2.3. Characterization
The X-ray diffraction (XRD) patterns were recorded with a Bruker D8-Advance diffractometer using Cu-Kα radiation (λ = 0.15418 nm) in the 10–80° (2θ) range with a step size of 0.02°. Field-emission scanning electron microscopy (FESEM) images were taken on a Hitachi SU-8010 apparatus. The Brunauer–Emmett–Teller (BET) specific surface area was ascertained by a nitrogen adsorption data measured at 77 K on a Quantachrome NOVA4000 surface area analyzer. X-ray photoelectron spectroscopy (XPS) patterns were recorded on a Thermo Scientific Escalab 250Xi spectrometer with Al-Kα radiation (1486.6 eV). Thermogravimetric (TG) analysis of catalysts was performed on a Netzsch X70 thermal gravimetric analyzer from room temperature to 650 °C with a heating rate of 10 °C min−1. Fourier transform infrared spectroscopy (FTIR) was determined by a Thermo Fisher Scientific Nicolet 6700 spectrometer.
2.4. Catalytic activity
The degradation experiments were conducted in a 100 mL sealed serum bottles within a shaking incubator. The pH was adjusted to desired values by 0.1 M HCl or 0.1 M NaOH. In a typical experiment, a required amount of MIL-100(Fe)/GO was dispersed in MO solution (50 mg L−1, 40 mL) at specific pH. Subsequently, a known dosage of H2O2 was immediately added to the solution to initiate the reaction. Samples were withdrawn at preset time intervals using a 1 mL syringe and filtrated through 0.22 μm polytetrafluoroethylene (PTFE) filters to remove suspended catalysts. Meanwhile, 10 μL 1 M tert-butanol was immediately added into the sample to quench the reaction. The MO concentration during the reaction was measured by a Perkin-Elmer Lambda 25 UV/vis spectrophotometer with the calibrated maximum absorbance wavelength of 464 nm. For the successive recycle experiment, the used MIL-100(Fe)/GO was separated by filtration, washed with water and ethanol to wipe off the adsorbed MO, and then reused for next reaction after dried at 110 °C. The total organic carbon (TOC) were determined using a Multi N/C 2100 TOC/TN analyzer. The loss of iron in the treated solution during catalysts use was examined by an atomic absorption spectroscopy (AAS) with Hitachi ZA3000. Each degradation experiment was repeated in triplicate and the reported data were expressed as the arithmetic mean with error bars.
3. Results and discussion
3.1. Characterization of MIL-100(Fe)/GO
XRD was applied to characterize the crystallographic structure of the fresh and used MIL-100(Fe)/GO catalysts. As presented in Fig. 1, the XRD pattern of the fresh MIL-100(Fe)/GO is consistent with those previously reported for MIL-100(Fe), demonstrating the successful preparation of MIL-100(Fe).36,37 The used MIL-100(Fe)/GO displays the same diffraction pattern as the fresh sample with little decrease in intensity, which indicates that the crystal structure of the MIL-100(Fe)/GO is maintained after the Fenton-like reaction. Moreover, no discernible diffraction peaks belonging to GO (normally at about 9.3°) can be detected in the pattern of MIL-100(Fe)/GO. This result indicates that the incorporation of GO does not influence the assembly process of MIL-100(Fe). The absence of characteristic peaks of GO could be ascribed to the low GO content (5 wt%) and/or the exfoliation of GO in water by sonication during the synthesis procedure.38
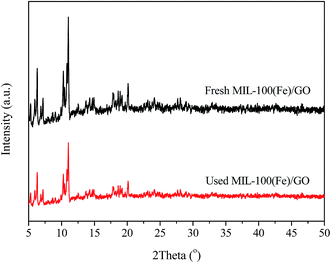 |
| | Fig. 1 XRD patterns of fresh and used MIL-100(Fe)/GO composites. | |
The morphologies of the fresh and used MIL-100(Fe)/GO composites can be investigated by FESEM images. It can be seen from Fig. 2, GO is observed as a crumpled layered structure, whereas MIL-100(Fe) exhibits well-defined octahedral crystals together with some small irregular particles. The MIL-100(Fe) are randomly anchored and dispersed on the surface of GO sheets, and no obvious morphology changes can be observed between the fresh and used MIL-100(Fe)/GO composites.
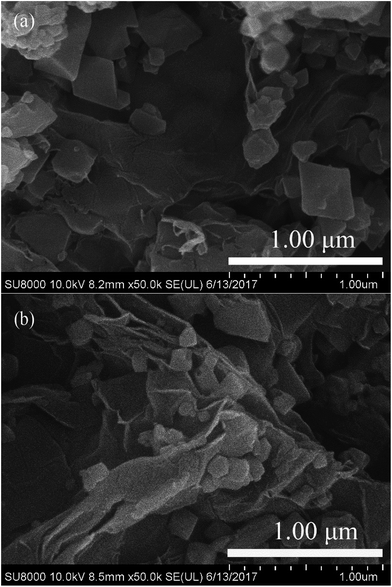 |
| | Fig. 2 FESEM images of (a) fresh MIL-100(Fe)/GO and (b) used MIL-100(Fe)/GO. | |
The specific surface area and the porosity of the as-synthesized MIL-100(Fe)/GO composite were determined by N2 adsorption–desorption isotherms (Fig. 3). The isotherm of MIL-100(Fe)/GO exhibits an intermediate mode between type I and IV with a small hysteresis loop in the relative pressure range of 0.4 to 1.0, which indicates that both microporous windows and mesoporous cages exist in the composites.37 As derived from the N2 adsorption data, the catalyst possessed high BET surface area of 1602 m2 g−1 with a pore volume of 0.77 cm3 g−1. The pore size distribution of MIL-100(Fe)/GO (inset in Fig. 3) estimated by the Barrett–Joyner–Halenda method gave a maximum pore diameter of 1.92 nm, which is slightly larger than the diameter of MO molecule (about 1.4 nm).39 These favorable structure characteristics could facilitate the contact with reactants in catalysis.
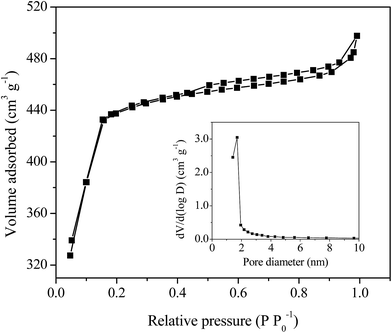 |
| | Fig. 3 N2 adsorption–desorption isotherms and BJH pore size distribution plot (inset) of MIL-100(Fe)/GO composites. | |
The thermal stability of MIL-100(Fe)/GO was studied by TG analysis, and the results are shown in Fig. 4. Generally, GO is thermally unstable and exhibits two main steps of weight loss with the increase of temperature.40 The initial weight loss below 125 °C is related to departure of trapped water molecules, while the second rapid weight loss occurring at around 200 °C is associated with decomposition of oxygen containing functional groups. However, the thermogram of MIL-100(Fe)/GO shows only two typical weight losses which is in agreement with the that of MIL-100(Fe) reported by previous investigators.37 The first weight loss in the temperature range of 25–140 °C corresponds to the evaporation of free water molecules within the pores. The main weight loss observed above 300 °C is ascribed to the collapse of the framework resulted from the decomposition of the organic ligands accompanied by the progressive reduction of the iron species at air atmosphere. No noticeable weight loss from the decomposition of the oxygen containing functional groups in GO could be observed in the curves of the composites, which was attributed to the low GO content in these materials as well as the interactions of these functionalities with the metallic sites in MIL-100(Fe).29 The plateau observed between 140 and 300 °C demonstrated that MIL-100(Fe)/GO has excellent thermal stability blow 300 °C, ensuring its applicability over this temperature range.
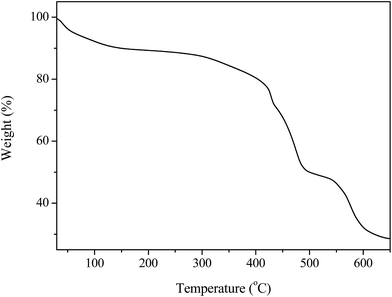 |
| | Fig. 4 TGA profile of MIL-100(Fe)/GO composites. | |
The chemical state of iron species in MIL-100(Fe)/GO before and after reaction was examined by XPS analysis. Fig. 5 displays the high-resolution scanning XPS spectra of Fe 2p of fresh and used MIL-100(Fe)/GO, which were deconvoluted into multiplet peaks by the Gaussian curve fitting. In fresh MIL-100(Fe)/GO, the binding energy position of Fe 2p1/2 and Fe 2p3/2 peak was respectively centered at 725.6 eV and 711.6 eV and their separation (Δ = 2p1/2 − 2p3/2) was 14 eV, which was similar to those reported for Fe2O3.41 That is to say, the obtained peaks suggested the presence of Fe(III) in fresh MIL-100(Fe)/GO. After Gaussian curve fitting, the multiplet peaks at 711.4, 712.6 and 713.8 eV can be attributed to the characteristic Fe 2p3/2 peaks of Fe(III), and those at 725.1, 726.5 and 727.9 eV are characteristic Fe 2p1/2 peaks of Fe(III). The satellite signal observed at 717.2 eV can be assigned to Fe(III) in MIL-100(Fe)/GO, which further confirmed that the dominating chemical state of iron on the catalysts was Fe(III).42 After Fenton-like reaction, the main peaks for Fe 2p1/2 and Fe 2p3/2 were keep the same, whereas two small shoulders (723.1 and 709.6 eV, respectively) assignable to the characteristics of Fe(II) were observed in the Fe 2p spectrum.42,43 The results implied that some Fe(III) was reduced to Fe(II) during the Fenton-like reaction.
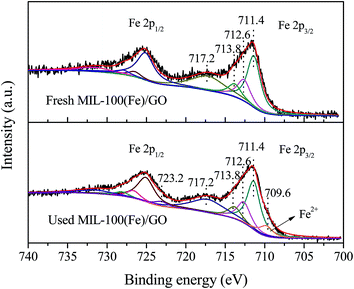 |
| | Fig. 5 High-resolution scanning XPS spectra for Fe 2p regions of fresh and used MIL-100(Fe)/GO composites. | |
FTIR spectra were performed to analyze the chemical structure change of the two catalysts. It can be seen in Fig. 6, most bands on fresh MIL-100(Fe)/GO appear at 710, 760, 955, 1130, 1380, 1450, 1580, and 1630 cm−1. The sharp peak at 1630 cm−1 is attributed to the vibration of the C–O bond in carboxylate groups, while the bands located at 1380, 1450 and 1580 cm−1 are associated with the asymmetric and symmetric vibrations of the O–C–O groups. The other peaks from 700 to 1300 cm−1 could be assigned as the C–H bending vibrations of benzene.23,44,45 The broad set of peaks between 3000 and 3700 cm−1 originated from the O–H stretching in adsorbed water molecules and/or hydroxyl groups on GO surface.46 Moreover, it should be noted that a shoulder appeared at 1715 cm−1 suggests that a small portion of the carboxylate groups are protonated, which is beneficial for the adsorption of MO.45,47 Compared with fresh MIL-100(Fe)/GO, the FTIR spectra of used MIL-100(Fe)/GO shows the similar characteristic peaks except that two new peaks appeared at 1032 cm−1 and 1168 cm−1. These two peaks are ascribed to the vibration of the sulfonic group in MO, indicating that MO is indeed adsorbed on the MIL-100(Fe)/GO after reaction.48
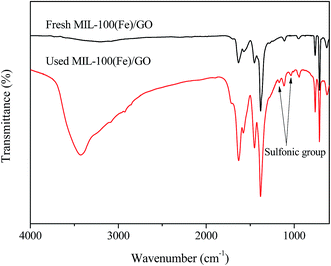 |
| | Fig. 6 FTIR spectra of fresh and used MIL-100(Fe)/GO composites. | |
3.2. Catalytic activity of MIL-100(Fe)/GO
The degradation of MO along time was performed through different experimental conditions to examine the catalytic performance of MIL-100(Fe)/GO in heterogeneous Fenton process. It can be seen from Fig. 7 that no degradation of MO happened in the presence of H2O2 alone, which was ascribed to its low oxidation potential compared with ˙OH and perhydroxyl radicals (HO2˙).49 With only MIL-100(Fe)/GO adding into the solutions, the MO concentration decreased quickly in the first 15 min and afterwards decreased further but slowly. The adsorption equilibrium was achieved in 60 min and about 50% of the MO was removed by MIL-100(Fe)/GO due to the high adsorption capacity of MIL-100(Fe) for MO.35 When MIL-100(Fe)/GO and H2O2 were added simultaneously, about 98% MO degradation was achieved within 240 min. The result indicates that MIL-100(Fe)/GO is effective in the degradation of MO through a combination of adsorption and Fenton-like reaction.
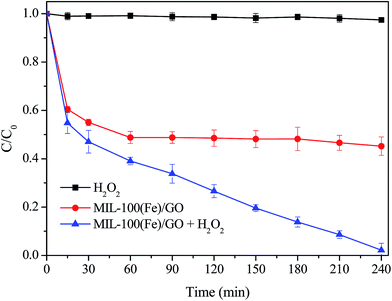 |
| | Fig. 7 Degradation of MO by various systems. Reaction conditions: initial MO, 50 mg L−1; pH, 3.0; catalyst, 0.5 g L−1; H2O2, 8 mM; temperature, 30 °C. | |
Considering a certain amount of iron species can inevitably leach from the catalyst during the heterogeneous Fenton reaction process in the acidic environment, the concentrations of Fe ions in solution during MO degradation were investigated. As seen in Fig. 8, the concentration of the dissolved iron gradually increased with the proceeding of MO degradation, and reached a peak value about 3.72 mg L−1 at 240 min when MO was almost completely removed. Thus, in order to evaluate the contribution of homogeneous Fenton reaction originating from the leached Fe ions on MO degradation, a homogeneous Fenton experiment using leached iron was conducted under identical reaction conditions. The homogeneous filtrate of 0.5 g L−1 MIL-100(Fe)/GO was collected after vigorous agitation for 240 min and transferred to the reactor. Then the homogeneous Fenton reaction was initiated by adding H2O2 to the filtrate. It can be seen from Fig. 8 that the removal of MO was about 32% by the homogeneous Fenton reaction after 240 min, which was lower than that in the heterogeneous system. These results indicate that the MO degradation reaction catalyzed by MIL-100(Fe)/GO is mainly dominated by the heterogeneous Fenton process.
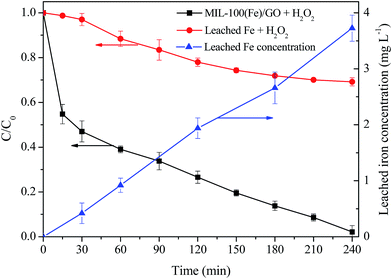 |
| | Fig. 8 The degradation of MO in the presence of MIL-100(Fe)/GO + H2O2 and leached Fe ions + H2O2 as well as the variation of the concentration of leached Fe in solution during MO degradation. Reaction conditions: initial MO, 50 mg L−1; pH, 3.0; catalyst, 0.5 g L−1; H2O2, 8 mM; temperature, 30 °C. | |
The effects of main operational parameters such as the H2O2 dosage, the initial solution pH values and the catalyst dosage were investigated, as they can significantly influence the catalytic performance of the MIL-100(Fe)/GO composites for MO degradation. Fig. 9a shows the effect of H2O2 dosage on the degradation of MO by varying it from 4 to 12 mM. It can be observed that the removal efficiency of MO increased from 82% to 98% as the dosage of H2O2 increased from 4 mM to 8 mM. Since the concentration of H2O2 is directly related to the number of the ˙OH radicals generated in the Fenton process, the increased H2O2 dosage could produce more ˙OH radicals for the degradation of MO. However, when the H2O2 dosage further increased to 12 mM, the removal efficiency of MO decreased unexpectedly. This was probably ascribed to the scavenging effect of ˙OH by excessive H2O2 as described by eqn (1) and (2). In addition, it should be noticed that the MO removal was quite fast at the initial stage and no obvious difference of MO removal efficiencies could be observed during the first 30 min in the range of H2O2 dosage used. This may be because, at this stage, the mass transfer of MO from the bulk solution to the catalysts surface dominated the MO degradation process. Furthermore, there may exist an activation process of the surface iron species, which were enabled to form complexes with H2O2 before the oxidation process occurred.50 Therefore, the MO degradation kinetics under various tested conditions were evaluated by fitting the experimental data from 30 min up to 240 min. Fig. 9b illustrated the kinetics plots of MO degradation under different H2O2 dosage. The MO degradation was observed to approximately follow a pseudo-first-order reaction in kinetics, which can be expressed as dCMO/dt = kCMO. With the increase of H2O2 dosage, the first-order kinetic rate constant (k) of MO degradation was initially increased from 0.0044 min−1 to 0.0114 min−1 and then decreased to 0.0078 min−1. This indicated that 8 mM H2O2 was chosen as the optimal dosage in degradation of MO.
| | |
H2O2 + ˙OH → HO2˙ + H2O
| (1) |
| | |
HO2˙ + ˙OH → H2O + O2
| (2) |
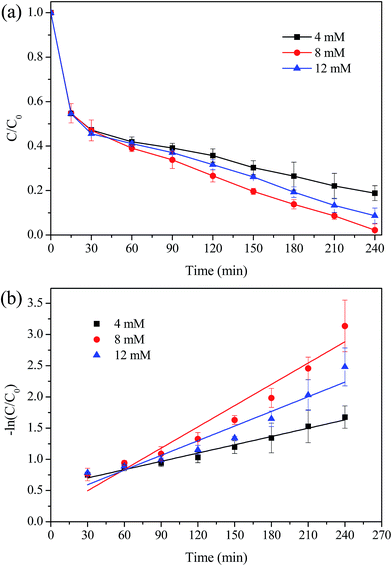 |
| | Fig. 9 Effect of H2O2 dosage on the degradation of MO. (a) Removal efficiency; (b) kinetic constant. Reaction conditions: initial MO, 50 mg L−1; pH, 3.0; catalyst, 0.5 g L−1; temperature, 30 °C. | |
The effect of initial pH on MO degradation was evaluated and the results were presented in Fig. 10. It was observed that with the increase of pH from 3.0 to 6.0, the removal efficiency of MO was reduced significantly from 98% to 60% and the k value was decreased from 0.0114 min−1 to 0.0023 min−1. The decreased removal of MO was attributed to the following two reasons: (i) MIL-100(Fe) generally presents a negative charged surface in aqueous solution, while MO exists as an anionic guest molecule. The adsorption capacity of MIL-100(Fe)/GO for MO is strongly depend on the initial pH value, which decreased rapidly by increasing the pH value.23,35 (ii) The increase of pH values would increase the rate of auto-decomposition of H2O2 and decrease the oxidation potential of ˙OH simultaneously.14,51
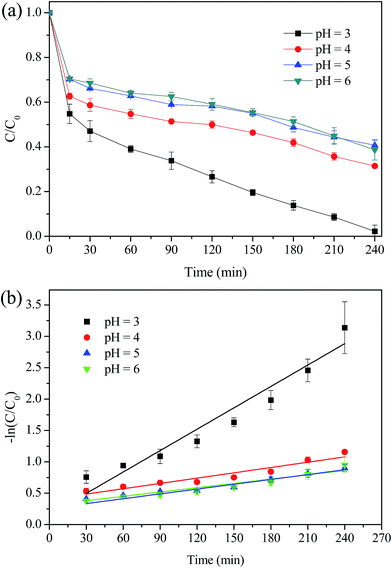 |
| | Fig. 10 Effect of initial pH value on the degradation of MO. (a) Removal efficiency; (b) kinetic constant. Reaction conditions: initial MO, 50 mg L−1; catalyst, 0.5 g L−1; H2O2, 8 mM; temperature, 30 °C. | |
Fig. 11 displays the MO degradation with various dosage of MIL-100(Fe)/GO composite. It was observed that MO was degraded at a significantly faster rate with higher catalyst dosage. Almost all MO was degraded during 240 min with a catalyst dosage of 0.5 g L−1 and 1.0 g L−1. The k value was 0.159 min−1 at 1.0 g L−1, which is almost three times higher than that of 0.2 g L−1 (0.0043 min−1). The likely reason for the enhancement of the removal efficiency was that the increased catalyst dosage would supply more active sites for the generation of ˙OH radicals. Besides, more catalyst would provide more adsorption sites for MO. The enrichment of MO in the vicinity of reactive centers was considered to be beneficial for the degradation reaction.52
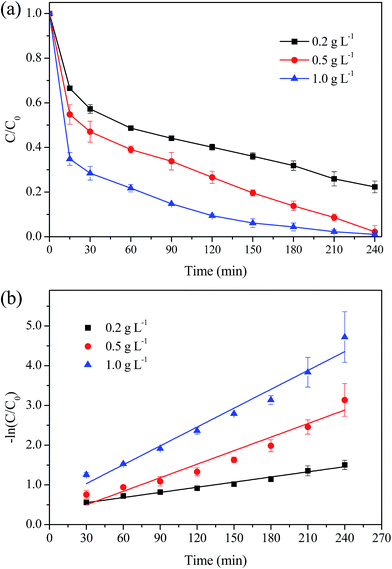 |
| | Fig. 11 Effect of catalyst dosage on the degradation of MO. (a) Removal efficiency; (b) kinetic constant. Reaction conditions: initial MO, 50 mg L−1; pH, 3.0; H2O2, 8 mM; temperature, 30 °C. | |
3.3. Stability and reusability of MIL-100(Fe)/GO
The stability of MIL-100(Fe)/GO composite was evaluated by three consecutive experiments of MO degradation under the same reaction condition (initial MO = 50 mg L−1, initial pH = 3.0, H2O2 = 8 mM, catalyst dosage = 0.5 g L−1, and T = 30 °C). The result in Fig. 12 shows that MIL-100(Fe)/GO can be successfully reused for three successive cycles with a removal efficiency of >95% within a reaction time of 240 min, which confirms that the MIL-100(Fe)/GO catalyst possesses good stability and has potential application for reusability. However, the TOC removal decreased over the three cycles probably due to the residual of MO or accumulation of intermediates on the surface of MIL-100(Fe)/GO. Moreover, the amount of the total iron leached from the catalyst into the solution increased from 5.18 to 12.41 mg L−1 as the cycle number increased. Although the leaching Fe from MIL-100(Fe)/GO is lower than that of some traditional Fenton-like catalysts like Fe3O4 and Fe2O3,14,23 the dissolution of iron ions would significantly influence the life of the catalyst. Further study will be necessary to resolve the problem of iron leaching from the catalyst.
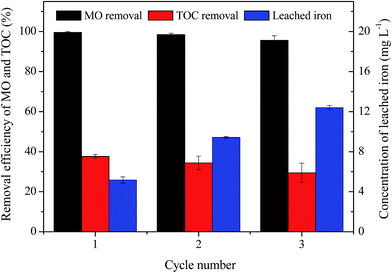 |
| | Fig. 12 Removal efficiency of MO and TOC in consecutive three runs as well as the corresponding irons leaching concentration. Reaction conditions: initial MO, 50 mg L−1; pH, 3.0; catalyst, 0.5 g L−1; H2O2, 8 mM; temperature, 30 °C. | |
3.4. Possible catalytic mechanism
It has been proposed that the surface Fe(III) species in MOF structure are the major active sites for the decomposition of H2O2 to generate ˙OH radicals by heterogeneous Fenton-like reactions.23,53 Under acidic conditions, a complex between surface Fe(III) active site and H2O2, being assigned as ![[triple bond, length as m-dash]](https://www.rsc.org/images/entities/char_e002.gif) FeIIIH2O2, is initially formed through H2O2 activation by the catalysts (eqn (3)).54 The initially generated
FeIIIH2O2, is initially formed through H2O2 activation by the catalysts (eqn (3)).54 The initially generated ![[triple bond, length as m-dash]](https://www.rsc.org/images/entities/char_e002.gif) FeIIIH2O2 species subsequently converts to Fe(II) site and HO2˙ radical (eqn (4)), and the generated HO2˙ can further react with Fe(III) site to produce Fe(II) site (eqn (5)). Then the formed Fe(II) site reacts with H2O2 to generate surface-bound ˙OH radical (eqn (6)). In the bulk solution, dissolved iron resulted from MIL-100(Fe)/GO can also initiate the decomposition of H2O2 to produce ˙OH through a chain reaction (eqn (7)–(12)). Both surface-bound ˙OH and diffused ˙OH in the bulk solution can participate in the degradation process of MO (eqn (13)).
FeIIIH2O2 species subsequently converts to Fe(II) site and HO2˙ radical (eqn (4)), and the generated HO2˙ can further react with Fe(III) site to produce Fe(II) site (eqn (5)). Then the formed Fe(II) site reacts with H2O2 to generate surface-bound ˙OH radical (eqn (6)). In the bulk solution, dissolved iron resulted from MIL-100(Fe)/GO can also initiate the decomposition of H2O2 to produce ˙OH through a chain reaction (eqn (7)–(12)). Both surface-bound ˙OH and diffused ˙OH in the bulk solution can participate in the degradation process of MO (eqn (13)).| |
![[triple bond, length as m-dash]](https://www.rsc.org/images/entities/char_e002.gif) FeIII + H2O2 → FeIII + H2O2 → ![[triple bond, length as m-dash]](https://www.rsc.org/images/entities/char_e002.gif) FeIIIH2O2 FeIIIH2O2
| (3) |
| |
![[triple bond, length as m-dash]](https://www.rsc.org/images/entities/char_e002.gif) FeIIIH2O2 → FeIIIH2O2 → ![[triple bond, length as m-dash]](https://www.rsc.org/images/entities/char_e002.gif) FeII + HO2˙ + H+ FeII + HO2˙ + H+
| (4) |
| |
![[triple bond, length as m-dash]](https://www.rsc.org/images/entities/char_e002.gif) FeIII + HO2˙ → FeIII + HO2˙ → ![[triple bond, length as m-dash]](https://www.rsc.org/images/entities/char_e002.gif) FeII + O2 + H+ FeII + O2 + H+
| (5) |
| |
![[triple bond, length as m-dash]](https://www.rsc.org/images/entities/char_e002.gif) FeII + H2O2 → FeII + H2O2 → ![[triple bond, length as m-dash]](https://www.rsc.org/images/entities/char_e002.gif) FeIII + ˙OH + OH− FeIII + ˙OH + OH−
| (6) |
| | |
Fe3+ + H2O2 → Fe2+ + HO2˙ + H+
| (7) |
| | |
Fe3+ + HO2˙ → Fe2+ + O2 + H+
| (8) |
| | |
Fe2+ + H2O2 → Fe3+ + ˙OH + OH−
| (9) |
| | |
˙OH + H2O2 → H2O + HO2˙
| (10) |
| | |
Fe2+ + H+ + HO2˙ → Fe3+ + H2O2
| (11) |
| | |
Fe2+ + ˙OH → Fe3+ + OH−
| (12) |
| | |
˙OH + MO → degraded products
| (13) |
Moreover, the presence of GO was also favorable for the degradation of MO. The introduction of GO can improve the catalyst stability and create new micro-pores at the interface of MIL-100(Fe) units and GO sheets, which contributes to the mass transfer of reactants and products during the reaction.29,30 Besides, the aromatic ring structures of GO are favorable for the adsorption of MO through π–π interactions. Furthermore, the strong interactions between MIL-100(Fe) and GO facilitate the electron transfer between the two phases, which may induce a synergistic effect to enhance the catalytic activity.27,31,32
Accordingly, a possible mechanism for the heterogeneous Fenton degradation of MO over MIL-100(Fe)/GO is proposed in Fig. 13.
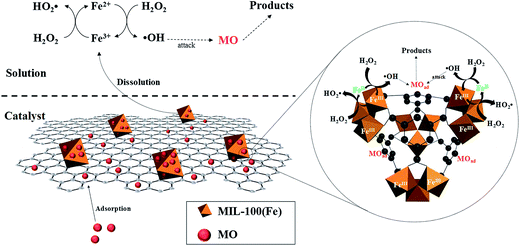 |
| | Fig. 13 Possible catalytic mechanisms for the activation of H2O2 by MIL-100(Fe)/GO under acidic condition. | |
First, the open pore network of MIL-100(Fe)/GO enables fast diffusion of reactants (MO and H2O2) and products towards the active centers. Second, the organic units of MIL-100(Fe)/GO offer specific adsorption of MO from bulk solution through π–π interactions, resulting in the enrichment of MO in the vicinity of reactive centers. Third, the surface active sites of catalyst catalytically decompose the adsorbed H2O2 into surface-bound ˙OH radicals. Fourth, the high concentration of MO in the local microenvironment immediately react with the ˙OH radicals, which provides a driving force to accelerate the generation of ˙OH radicals and thus facilitates the oxidation degradation of MO. Eventually, in the bulk solution, the dissolved iron from the catalyst also initiates the decomposition of H2O2, producing ˙OH radicals to degrade MO.
3.5. Possible degradation intermediates of MO
The monitoring of the degradation intermediates of methyl orange is crucial for a better understanding of the detailed reaction processes as well as the selection of their further degradation steps. As reported in several literatures, the major degradation pathway of MO in Fenton-like reaction is oxidative cleavage of azo groups of MO molecules (i.e. azo double bond, –N![[double bond, length as m-dash]](https://www.rsc.org/images/entities/char_e001.gif) N–).55,56 During the decolourization process, the ˙OH radicals generated by Fenton-like mechanism preferentially attacked the –N
N–).55,56 During the decolourization process, the ˙OH radicals generated by Fenton-like mechanism preferentially attacked the –N![[double bond, length as m-dash]](https://www.rsc.org/images/entities/char_e001.gif) N– groups, cleaving them into the substituted aromatic compounds such as 4-dimethylamino aniline (m/z = 136), 4-diazenyl-N,N dimethylbenzenamine (m/z = 149), hydroxybenzenesulfonate (m/z = 173), etc. in the first step.56,57 The compounds subsequently underwent a further attack by ˙OH radicals to form smaller molecular compounds including aniline (m/z = 93), benzoquinone (m/z = 108), nitrobenzene (m/z = 123), p-nitrophenol (m/z = 140), 2,5-dinitrophenol (m/z = 183), acetic acid (m/z = 60), succinic acid (m/z = 118), oxalic acid (m/z = 90) etc. and eventually converted into inorganic ions (e.g. NH4+, NO3−, and SO42−), carbon dioxide and water.56–59 As the degradation pathway of MO in Fenton-like reaction has been extensively investigated in many researches, the possible intermediate products were not qualitatively analyzed in this study. More detailed studies will be required to investigate the degradation pathway in the near future.
N– groups, cleaving them into the substituted aromatic compounds such as 4-dimethylamino aniline (m/z = 136), 4-diazenyl-N,N dimethylbenzenamine (m/z = 149), hydroxybenzenesulfonate (m/z = 173), etc. in the first step.56,57 The compounds subsequently underwent a further attack by ˙OH radicals to form smaller molecular compounds including aniline (m/z = 93), benzoquinone (m/z = 108), nitrobenzene (m/z = 123), p-nitrophenol (m/z = 140), 2,5-dinitrophenol (m/z = 183), acetic acid (m/z = 60), succinic acid (m/z = 118), oxalic acid (m/z = 90) etc. and eventually converted into inorganic ions (e.g. NH4+, NO3−, and SO42−), carbon dioxide and water.56–59 As the degradation pathway of MO in Fenton-like reaction has been extensively investigated in many researches, the possible intermediate products were not qualitatively analyzed in this study. More detailed studies will be required to investigate the degradation pathway in the near future.
4. Conclusions
In summary, MIL-100(Fe)/GO composites were successfully synthesized by a simple one-step hydrothermal method, which can be utilized as an effective catalyst for the degradation of MO in heterogeneous Fenton-like process. Under the optimum conditions (pH 3.0, H2O2 dosage 8 mM, and catalyst dosage 0.5 g L−1), 98% MO and 38% TOC removal were achieved within 240 min. The MIL-100(Fe)/GO composite maintained high catalytic activity after three cycles and showed good stability and reusability. The possible catalytic mechanism of MIL-100(Fe)/GO was proposed, in which the high enrichment ability of MIL-100(Fe)/GO for MO gave a positive effect for the catalytic oxidation of MO.
Conflicts of interest
There are no conflicts to declare.
Acknowledgements
The research was supported by the National Natural Science Foundation of China (51338005) and the Program for Changjiang Scholars and Innovative Research Team in University (IRT-13026).
References
- A. Reife and H. S. Freeman, Environmental Chemistry of Dyes and Pigments, John Wiley & Sons, 1996 Search PubMed
 .
. - M. L. Rache, A. R. García, H. R. Zea, A. M. Silva, L. M. Madeira and J. H. Ramírez, Appl. Catal., B, 2014, 146, 192–200 CrossRef CAS
 .
. - J. L. Wang and L. J. Xu, Crit. Rev. Environ. Sci. Technol., 2012, 42, 251–325 CrossRef CAS
 .
. - J. L. Wang and Z. Y. Bai, Chem. Eng. J., 2017, 312, 79–98 CrossRef CAS
 .
. - Z. Y. Bai, Q. Yang and J. L. Wang, Chemosphere, 2016, 161, 174–180 CrossRef CAS PubMed
 .
. - X. J. Yang, X. M. Xu, J. Xu and Y. F. Han, J. Am. Chem. Soc., 2013, 135, 16058–16061 CrossRef CAS PubMed
 .
. - L. J. Xu and J. L. Wang, J. Hazard. Mater., 2011, 186, 256–264 CrossRef CAS PubMed
 .
. - E. Brillas, I. Sirés and M. A. Oturan, Chem. Rev., 2009, 109, 6570–6631 CrossRef CAS PubMed
 .
. - Z. H. Xu, D. Fang, W. C. Shi, J. Y. Xu, A. M. Lu, K. B. Wang and L. X. Zhou, Environ. Eng. Sci., 2015, 32, 497–504 CrossRef CAS
 .
. - Z. H. Xu, Y. Q. Yu, D. Fang, J. Y. Xu, J. R. Liang and L. X. Zhou, Ultrason. Sonochem., 2015, 27, 287–295 CrossRef CAS PubMed
 .
. - Z. Wan and J. L. Wang, J. Hazard. Mater., 2017, 324, 653–664 CrossRef CAS PubMed
 .
. - L. J. Xu and J. L. Wang, Environ. Sci. Technol., 2012, 46, 10145–10153 CrossRef CAS PubMed
 .
. - J. L. Wang and Z. Y. Bai, Chem. Eng. J., 2016, 300, 169–176 CrossRef
 .
. - L. J. Xu and J. L. Wang, Appl. Catal., B, 2012, 123, 117–126 CrossRef
 .
. - F. Xiao, W. T. Li, L. P. Fang and D. S. Wang, J. Hazard. Mater., 2016, 308, 11–20 CrossRef CAS PubMed
 .
. - Q. Y. Yang, D. H. Liu, C. L. Zhong and J. R. Li, Chem. Rev., 2013, 113, 8261–8323 CrossRef CAS PubMed
 .
. - G. Férey, Chem. Soc. Rev., 2008, 37, 191–214 RSC
 .
. - J. W. Liu, L. F. Chen, H. Cui, J. Y. Zhang, L. Zhang and C. Y. Su, Chem. Soc. Rev., 2014, 43, 6011–6061 RSC
 .
. - S. Ou and C. D. Wu, Inorg. Chem. Front., 2014, 1, 721–734 RSC
 .
. - D. Farrusseng, S. Aguado and C. Pinel, Angew. Chem., Int. Ed., 2009, 48, 7502–7513 CrossRef CAS PubMed
 .
. - J. W. Zhou, R. Li, X. X. Fan, Y. Chen, R. D. Han, W. Li, J. Zheng, B. Wang and X. G. Li, Energy Environ. Sci., 2014, 7, 2715–2724 CAS
 .
. - L. H. Ai, C. H. Zhang, L. L. Li and J. Jiang, Appl. Catal., B, 2014, 148, 191–200 CrossRef
 .
. - H. L. Lv, H. Y. Zhao, T. C. Cao, L. Qian, Y. B. Wang, G. H. Zhao and J. Mol, J. Mol. Catal. A: Chem., 2015, 400, 81–89 CrossRef CAS
 .
. - Y. Li, H. Liu, W. J. Li, F. Y. Zhao and W. J. Ruan, RSC Adv., 2016, 6, 6756–6760 RSC
 .
. - H. L. Wang, H. S. Casalongue, Y. Y. Liang and H. J. Dai, J. Am. Chem. Soc., 2010, 132, 7472–7477 CrossRef CAS PubMed
 .
. - D. R. Dreyer, S. Park, C. W. Bielawski and R. S. Ruoff, Chem. Soc. Rev., 2010, 39, 228–240 RSC
 .
. - Y. Zhang, G. Li, H. Lu, Q. Lv and Z. G. Sun, RSC Adv., 2014, 4, 7594–7600 RSC
 .
. - R. Kumar, K. Jayaramulu, T. K. Maji and C. N. R. Rao, Chem. Commun., 2013, 49, 4947–4949 RSC
 .
. - C. Petit and T. J. Bandosz, Adv. Mater., 2009, 21, 4753–4757 CrossRef CAS
 .
. - N. A. Zubir, C. Yacou, J. Motuzas, X. W. Zhang, X. S. Zhao and J. C. D. da Costa, Chem. Commun., 2015, 51, 9291–9293 RSC
 .
. - M. Jahan, Q. L. Bao, J. X. Yang and K. P. Loh, J. Am. Chem. Soc., 2010, 132, 14487–14495 CrossRef CAS PubMed
 .
. - N. A. Zubir, C. Yacou, J. Motuzas, X. W. Zhang and J. C. D. da Costa, Sci. Rep., 2014, 4, 4594 CrossRef PubMed
 .
. - C. Petit and T. J. Bandosz, Adv. Funct. Mater., 2011, 21, 2108–2117 CrossRef CAS
 .
. - C. Petit, B. Levasseur, B. Mendoza and T. J. Bandosz, Microporous Mesoporous Mater., 2012, 154, 107–112 CrossRef CAS
 .
. - M. M. Tong, D. H. Liu, Q. Y. Yang, S. Devautour-Vinot, G. Maurin and C. L. Zhong, J. Mater. Chem. A, 2013, 1, 8534–8537 CAS
 .
. - A. Dhakshinamoorthy, M. Alvaro, Y. K. Hwang, Y. K. Seo, A. Corma and H. Garcia, Dalton Trans., 2011, 40, 10719–10724 RSC
 .
. - P. Horcajada, S. Surblé, C. Serre, D. Y. Hong, Y. K. Seo, J. S. Chang, J. M. Greneche, I. Margiolaki and G. Férey, Chem. Commun., 2007, 2820–2822 RSC
 .
. - S. Park and R. S. Ruoff, Nat. Nanotechnol., 2009, 4, 217–224 CrossRef CAS PubMed
 .
. - F. L. Ling, L. Fang, Y. Lu, J. M. Gao, F. Wu, M. Zhou and B. S. Hu, Microporous Mesoporous Mater., 2016, 234, 230–238 CrossRef CAS
 .
. - D. A. Dikin, S. Stankovich, E. J. Zimney, R. D. Piner, G. H. Dommett, G. Evmenenko, S. T. Nguyen and R. S. Ruoff, Nature, 2007, 448, 457–460 CrossRef CAS PubMed
 .
. - M. Descostes, F. Mercier, N. Thromat, C. Beaucaire and M. Gautier-Soyer, Appl. Surf. Sci., 2000, 165, 288–302 CrossRef CAS
 .
. - A. R. Grosvenor, B. A. Kobe, M. C. Biesinger and N. S. McIntyre, Surf. Interface Anal., 2004, 36, 1564–1574 CrossRef CAS
 .
. - H. Y. Zhao, Y. J. Wang, Y. B. Wang, T. C. Cao and G. H. Zhao, Appl. Catal., B, 2012, 125, 120–127 CrossRef CAS
 .
. - S. Hermes, F. Schröder, S. Amirjalayer, R. Schmid and R. A. Fischer, J. Mater. Chem., 2006, 16, 2464–2472 RSC
 .
. - M. R. Lohe, M. Rose and S. Kaskel, Chem. Commun., 2009, 40, 6056–6058 RSC
 .
. - Z. Y. Wang, Y. F. Dong, H. J. Li, Z. B. Zhao, H. B. Wu, C. Hao, S. H. Liu, J. S. Qiu and X. W. D. Lou, Nat. Commun., 2014, 5 DOI:10.1038/ncomms6002
 .
. - Y. M. Shao, L. C. Zhou, C. Bao, J. J. Ma, M. Z. Liu and F. Wang, Chem. Eng. J., 2016, 283, 1127–1136 CrossRef CAS
 .
. - F. Chen, Y. D. Xie, J. J. He and J. C. Zhao, J. Photochem. Photobiol., A, 2001, 138, 139–146 CrossRef CAS
 .
. - X. B. Hu, B. Z. Liu, Y. H. Deng, H. Z. Chen, S. Luo, C. Sun, P. Yang and S. Yang, Appl. Catal., B, 2011, 107, 274–283 CrossRef CAS
 .
. - M. L. Luo, D. Bowden and P. Brimblecombe, Appl. Catal., B, 2009, 85, 201–206 CrossRef CAS
 .
. - N. K. Daud and B. H. Hameed, J. Hazard. Mater., 2010, 176, 938–944 CrossRef CAS PubMed
 .
. - L. C. Toledo, A. C. B. Silva, R. Augusti and R. M. Lago, Chemosphere, 2003, 50, 1049–1054 CrossRef CAS PubMed
 .
. - R. W. Liang, S. G. Luo, F. F. Jing, L. J. Shen, N. Qin and L. Wu, Appl. Catal., B, 2015, 176, 240–248 CrossRef
 .
. - W. Luo, L. H. Zhu, N. Wang, H. Q. Tang, M. J. Cao and Y. B. She, Environ. Sci. Technol., 2010, 44, 1786–1791 CrossRef CAS PubMed
 .
. - N. Panda, H. Sahoo and S. Mohapatra, J. Hazard. Mater., 2011, 185, 359–365 CrossRef CAS PubMed
 .
. - J. M. Joseph, H. Destaillats, H. M. Hung and M. R. Hoffmann, J. Phys. Chem. A, 2000, 104, 301–307 CrossRef CAS
 .
. - Y. Wang, L. G. Gai, W. Y. Ma, H. H. Jiang, X. Q. Peng and L. C. Zhao, Ind. Eng. Chem. Res., 2015, 54, 2279–2289 CrossRef CAS
 .
. - M. Arshadia, M. K. Abdolmalekib, F. Mousaviniac, A. Khalafi-Nezhada, H. Firouzabadia and A. Gil, Chem. Eng. Res. Des., 2016, 112, 113–121 CrossRef
 .
. - Y. J. Wang, H. Y. Zhao, J. X. Gao, G. H. Zhao, Y. G. Zhang and Y. L. Zhang, J. Phys. Chem. C, 2012, 116, 7457–7463 CAS
 .
.
|
| This journal is © The Royal Society of Chemistry 2017 |
Click here to see how this site uses Cookies. View our privacy policy here.  Open Access Article
 *ab
*ab


![[triple bond, length as m-dash]](https://www.rsc.org/images/entities/char_e002.gif) FeIIIH2O2, is initially formed through H2O2 activation by the catalysts (eqn (3)).54 The initially generated
FeIIIH2O2, is initially formed through H2O2 activation by the catalysts (eqn (3)).54 The initially generated ![[triple bond, length as m-dash]](https://www.rsc.org/images/entities/char_e002.gif) FeIIIH2O2 species subsequently converts to Fe(II) site and HO2˙ radical (eqn (4)), and the generated HO2˙ can further react with Fe(III) site to produce Fe(II) site (eqn (5)). Then the formed Fe(II) site reacts with H2O2 to generate surface-bound ˙OH radical (eqn (6)). In the bulk solution, dissolved iron resulted from MIL-100(Fe)/GO can also initiate the decomposition of H2O2 to produce ˙OH through a chain reaction (eqn (7)–(12)). Both surface-bound ˙OH and diffused ˙OH in the bulk solution can participate in the degradation process of MO (eqn (13)).
FeIIIH2O2 species subsequently converts to Fe(II) site and HO2˙ radical (eqn (4)), and the generated HO2˙ can further react with Fe(III) site to produce Fe(II) site (eqn (5)). Then the formed Fe(II) site reacts with H2O2 to generate surface-bound ˙OH radical (eqn (6)). In the bulk solution, dissolved iron resulted from MIL-100(Fe)/GO can also initiate the decomposition of H2O2 to produce ˙OH through a chain reaction (eqn (7)–(12)). Both surface-bound ˙OH and diffused ˙OH in the bulk solution can participate in the degradation process of MO (eqn (13)).![[triple bond, length as m-dash]](https://www.rsc.org/images/entities/char_e002.gif) FeIII + H2O2 →
FeIII + H2O2 → ![[triple bond, length as m-dash]](https://www.rsc.org/images/entities/char_e002.gif) FeIIIH2O2
FeIIIH2O2
![[triple bond, length as m-dash]](https://www.rsc.org/images/entities/char_e002.gif) FeIIIH2O2 →
FeIIIH2O2 → ![[triple bond, length as m-dash]](https://www.rsc.org/images/entities/char_e002.gif) FeII + HO2˙ + H+
FeII + HO2˙ + H+
![[triple bond, length as m-dash]](https://www.rsc.org/images/entities/char_e002.gif) FeIII + HO2˙ →
FeIII + HO2˙ → ![[triple bond, length as m-dash]](https://www.rsc.org/images/entities/char_e002.gif) FeII + O2 + H+
FeII + O2 + H+
![[triple bond, length as m-dash]](https://www.rsc.org/images/entities/char_e002.gif) FeII + H2O2 →
FeII + H2O2 → ![[triple bond, length as m-dash]](https://www.rsc.org/images/entities/char_e002.gif) FeIII + ˙OH + OH−
FeIII + ˙OH + OH−

![[double bond, length as m-dash]](https://www.rsc.org/images/entities/char_e001.gif) N–).55,56 During the decolourization process, the ˙OH radicals generated by Fenton-like mechanism preferentially attacked the –N
N–).55,56 During the decolourization process, the ˙OH radicals generated by Fenton-like mechanism preferentially attacked the –N![[double bond, length as m-dash]](https://www.rsc.org/images/entities/char_e001.gif) N– groups, cleaving them into the substituted aromatic compounds such as 4-dimethylamino aniline (m/z = 136), 4-diazenyl-N,N dimethylbenzenamine (m/z = 149), hydroxybenzenesulfonate (m/z = 173), etc. in the first step.56,57 The compounds subsequently underwent a further attack by ˙OH radicals to form smaller molecular compounds including aniline (m/z = 93), benzoquinone (m/z = 108), nitrobenzene (m/z = 123), p-nitrophenol (m/z = 140), 2,5-dinitrophenol (m/z = 183), acetic acid (m/z = 60), succinic acid (m/z = 118), oxalic acid (m/z = 90) etc. and eventually converted into inorganic ions (e.g. NH4+, NO3−, and SO42−), carbon dioxide and water.56–59 As the degradation pathway of MO in Fenton-like reaction has been extensively investigated in many researches, the possible intermediate products were not qualitatively analyzed in this study. More detailed studies will be required to investigate the degradation pathway in the near future.
N– groups, cleaving them into the substituted aromatic compounds such as 4-dimethylamino aniline (m/z = 136), 4-diazenyl-N,N dimethylbenzenamine (m/z = 149), hydroxybenzenesulfonate (m/z = 173), etc. in the first step.56,57 The compounds subsequently underwent a further attack by ˙OH radicals to form smaller molecular compounds including aniline (m/z = 93), benzoquinone (m/z = 108), nitrobenzene (m/z = 123), p-nitrophenol (m/z = 140), 2,5-dinitrophenol (m/z = 183), acetic acid (m/z = 60), succinic acid (m/z = 118), oxalic acid (m/z = 90) etc. and eventually converted into inorganic ions (e.g. NH4+, NO3−, and SO42−), carbon dioxide and water.56–59 As the degradation pathway of MO in Fenton-like reaction has been extensively investigated in many researches, the possible intermediate products were not qualitatively analyzed in this study. More detailed studies will be required to investigate the degradation pathway in the near future.
.
.
.
.
.
.
.
.
.
.
.
.
.
.
.
.
.
.
.
.
.
.
.
.
.
.
.
.
.
.
.
.
.
.
.
.
.
.
.
.
.
.
.
.
.
.
.
.
.
.
.
.
.
.
.
.
.
.
.


