 Open Access Article
Improved electrochemical performance of LiNi0.8Co0.1Mn0.1O2 cathode materials via incorporation of rubidium cations into the original Li sites
Zhili Zhang ,
Donghui Chen* and
Chengkang Chang*
Shanghai Institute of Technology, 100 Haiquan Road, Shanghai 201418, China. E-mail: Chendhsit@163.com; ckchang@sit.edu.cn
First published on 8th November 2017
Abstract
Layered RbxLi(1−x)Ni0.8Co0.1Mn0.1O2 (x = 0, 0.005, 0.01, 0.02) materials were synthesized with different Rb concentrations using a solid state reaction method. All the materials were calcined at 800 °C for 12 h in a flowing oxygen atmosphere using NiO, CoO, MnO2, Rb2CO3 and LiOH·H2O as the raw materials. The influences of the amount of Rb+ ions in the cathodes on the electrochemical performance were investigated in detail. It was found from the results that the electrochemical performances of Rb doped materials were greatly improved. Among them the Rb0.5% sample presented the best performance; it delivered an initial discharging capacity of 188.9 mA h g−1 at 0.5C, improved by 13.52% when compared with that of a sample without Rb. A capacity retention of 88.9% after 100 cycles and an excellent high-rate performance of 152.3 mA h g−1 at 5C rate were also recorded for the same sample. The Li+ ion diffusion coefficient calculated from EIS turned out a value of 1.14 × 10⁻¹⁰ cm2 s−1, which is 3.42 times that of the non-doped sample. Both the enhanced performance and the accelerated Li+ ion diffusion could be explained by the changes in crystal structures. XRD whole pattern refinement revealed that the Rb+ ions were incorporated into the lattice by replacing the original Li+ ions, which resulted in reduced ionic mixing and the expansion in the c axis that led to the enhanced electrochemical performance. As a whole, incorporation of Rb in LiNi0.8Co0.1Mn0.1O2 by this approach showed great potential to serve as a promising cathode material for future applications.
Introduction
During the past few decades, lithium-ion batteries have been widely used in the field of portable electronic devices on account of their high energy density, light weight, long cycle life, and environmental friendliness, for use as the power source for cellular phones, laptop computers, digital cameras etc.1–4 Most recently, they have been intensively pursued to power vehicles (EVs) and renewable energy (such as solar and wind energy). However, commercialization of these batteries for the high power industries demands further improvement in their electrochemical performance. One of the most important factors is the specific capacity of the cathode material. Compared to the commercialized cathode material LiCoO2 (140 mA h g−1), layered Ni-rich oxide LiNi0.8Co0.1Mn0.1O2 (NCM811) is considered as one of the most promising cathode materials for its larger reversible capacity (∼200 mA h g−1) in the same potential range of 2.8–4.3 V.5–7However, some intrinsic problems such as low initial coulombic efficiency, poor rate capacity and poor cyclability have hindered the NCM811 cathode material from being commercialized for lithium-ion batteries. Some studies have shown that the phenomenon of this electrochemical performance degradation of NCM811 is due to the following various reasons: cation disordering, phase transformation, lattice instability, and oxygen release from cathode side reactions.8–12 Particularly, cation disordering (some Ni2+ ions of Ni layer move to Li layer) have been considered as one of the most detrimental source of failure in battery performance. Since the ionic radius of Li+ (0.076 nm) is similar to that of Ni2+ (0.069 nm), Ni2+ can commonly exist in the Li layer.8 Such failure occurs because cation disordering can collapse the structural stabilities of cathode materials substantially and degrades the charge/discharge rates by blocking Li diffusion pathways.13 On the other hand there is a risk that a rhombohedral lattice will be distorted into a monoclinic one when lithium ions are extracted from the structure.14 The situation becomes more significant when Li and O atoms are lost from the structure during the first cycle charge.15
Accordingly, many strategies have been applied to improve these shortcomings such as surface modification method and partial element doping. Li et al. studied the impact of the Cr substitutions on the NCM811 system and concluded that the improvement of electrochemical properties derives from the reduced cation mixing and improved reversibility of Li+ ions during insertion/extraction.16 Qin et al. found that ultrathin TiO2 can be coated on the Ni-rich cathode material to protect the active material from HF attack, which withstand the dissolution of metal ions in the electrode and favour the lithium diffusion of oxide.17 The modification by a small amount of other cations such as Mg/Al18, Ga19, and FePO4 (ref. 20) etc. has also been found to improve the electrochemical performance of the Ni-rich cathode material, as well as other synthetic methods like spray pyrolysis,21 introduce the additive into electrolyte,22 simplify the process with new method23 and so on.
Recently, Rb cation was employed to stabilize the electrochemical properties for Li rich cathode materials.24 In this article, the electrochemical performance of the cathode materials were greatly enhanced due to the reduced energy barrier and the increased diffusion coefficient of lithium ions for the intercalation/de-intercalation process within the lattice caused by Rb+ incorporation. We got excited by their results and decided to try it for NCM811 materials. Here in this work, RbxLi(1−x)Ni0.8Co0.1Mn0.1O2 (x = 0, 0.005, 0.01, 0.02) cathode materials were studied using normal solid state method and hoped to scale it up once the routine is proved as an effective way. The results showed that the initial capacity, the cyclability and the rate performance were greatly improved. Both the reduced Li/Ni mixing and the enhanced Li-ion diffusion coefficient caused by the Rb+ incorporation were regarded as the main factors for such improvement.
Experimental
Preparation of RbxLi(1−x)Ni0.8Co0.1Mn0.1O2
Stoichiometric amounts of nickel oxide (99%), cobalt oxide (99.9%), manganese dioxide (99%), rubidium carbonate (99%) and lithium hydroxide monohydrate (99%), all in analytical grade, were dispersed in distilled water with an excess of 5 wt% of lithium hydroxide monohydrate. That is, all the starting raw materials were employed with a molar ratio of Rb![[thin space (1/6-em)]](https://www.rsc.org/images/entities/char_2009.gif) :
:![[thin space (1/6-em)]](https://www.rsc.org/images/entities/char_2009.gif) Li
Li![[thin space (1/6-em)]](https://www.rsc.org/images/entities/char_2009.gif) :
:![[thin space (1/6-em)]](https://www.rsc.org/images/entities/char_2009.gif) Ni
Ni![[thin space (1/6-em)]](https://www.rsc.org/images/entities/char_2009.gif) :
:![[thin space (1/6-em)]](https://www.rsc.org/images/entities/char_2009.gif) Co
Co![[thin space (1/6-em)]](https://www.rsc.org/images/entities/char_2009.gif) :
:![[thin space (1/6-em)]](https://www.rsc.org/images/entities/char_2009.gif) Mn = x
Mn = x![[thin space (1/6-em)]](https://www.rsc.org/images/entities/char_2009.gif) :
:![[thin space (1/6-em)]](https://www.rsc.org/images/entities/char_2009.gif) (1.05 − x)
(1.05 − x)![[thin space (1/6-em)]](https://www.rsc.org/images/entities/char_2009.gif) :
:![[thin space (1/6-em)]](https://www.rsc.org/images/entities/char_2009.gif) 0.8
0.8![[thin space (1/6-em)]](https://www.rsc.org/images/entities/char_2009.gif) :
:![[thin space (1/6-em)]](https://www.rsc.org/images/entities/char_2009.gif) 0.1
0.1![[thin space (1/6-em)]](https://www.rsc.org/images/entities/char_2009.gif) :
:![[thin space (1/6-em)]](https://www.rsc.org/images/entities/char_2009.gif) 0.1. After that, the suspension was milled for 3 h in a Nano ball mill with particle size between 200 and 300 nm. The obtained slurry was dried by a spray dryer to form the precursors of the RbxLi(1−x)Ni0.8Co0.1Mn0.1O2 cathode materials. Then the precursor powders were pressed into tablets under 4 MPa, followed by crushing and sieving (300 meshes) in room temperature. Finally, the powders were preheated at 500 °C for 2 h and then calcined under 800 °C for 12 h in flowing O2 atmosphere to obtain the target RbxLi(1−x)Ni0.8Co0.1Mn0.1O2 cathode materials. Several samples with different Rb concentration were prepared, and denoted as Rb0%, Rb0.5%, Rb1% and Rb2% for x = 0, 0.005, 0.01, 0.02, respectively.
0.1. After that, the suspension was milled for 3 h in a Nano ball mill with particle size between 200 and 300 nm. The obtained slurry was dried by a spray dryer to form the precursors of the RbxLi(1−x)Ni0.8Co0.1Mn0.1O2 cathode materials. Then the precursor powders were pressed into tablets under 4 MPa, followed by crushing and sieving (300 meshes) in room temperature. Finally, the powders were preheated at 500 °C for 2 h and then calcined under 800 °C for 12 h in flowing O2 atmosphere to obtain the target RbxLi(1−x)Ni0.8Co0.1Mn0.1O2 cathode materials. Several samples with different Rb concentration were prepared, and denoted as Rb0%, Rb0.5%, Rb1% and Rb2% for x = 0, 0.005, 0.01, 0.02, respectively.
Characterization of the prepared materials
The crystal structures of the samples were determined by TD3200 X-ray diffraction (40 kV, 30 mA, Cu Kα1 radiation). For phase determination, the data were collected in the 10–70° (2θ) range using 0.02° (2θ) per step. For structure refinement, a wide range (10–120°) and a slow scan (0.01° per step) were employed. The structure refinements were carried out with a software Jade6.5. The morphologies of prepared samples were observed via a scanning electron microscopy (SEM, Hitachi, SU8200). Analysis of the elemental distribution of the particles was performed using a SEM based energy-dispersive X-ray spectrometer (EDS).Electrochemical testing
The electrochemical performances of the samples were measured using electrodes CR2016 coin-type half cells, which were assembled inside a glove box filled with Ar. The cathode consisted of 80 wt% calcined powders as active material, 10 wt% Super P carbon black as conducting agent and 10 wt% PVDF as binder. After being dispersed by NMP, the mixed slurry was evenly coated on a thin aluminium foil and dried in vacuum for 12 h at 110 °C. The cathode electrodes were pinched from the film into a disc with diameter of 12 mm. Then the lithium metal foils were used as anode, a polypropylene micro-porous film Celgard 3501 as the separator, assemble with LiPF6 (1 M) in a 1![[thin space (1/6-em)]](https://www.rsc.org/images/entities/char_2009.gif) :
:![[thin space (1/6-em)]](https://www.rsc.org/images/entities/char_2009.gif) 1
1![[thin space (1/6-em)]](https://www.rsc.org/images/entities/char_2009.gif) :
:![[thin space (1/6-em)]](https://www.rsc.org/images/entities/char_2009.gif) 1 (v/v/v) mixture of dimethyl carbonate (DMC), ethyl methyl carbonate (EMC) and ethylene carbonate (EC) as electrolyte. Then the charge and discharge tests were carried out on a LAND CT2001A battery tester at the voltage range of 2.8–4.3 V. Electrochemical Impedance Spectroscopy (EIS) was conducted by an electrochemical workstation (Auto lab Pgstat302n) over a frequency range of 0.05–500 kHz. Cycle voltammetry (CV) of the cells were measured by CHI660B electrochemical measurement system.
1 (v/v/v) mixture of dimethyl carbonate (DMC), ethyl methyl carbonate (EMC) and ethylene carbonate (EC) as electrolyte. Then the charge and discharge tests were carried out on a LAND CT2001A battery tester at the voltage range of 2.8–4.3 V. Electrochemical Impedance Spectroscopy (EIS) was conducted by an electrochemical workstation (Auto lab Pgstat302n) over a frequency range of 0.05–500 kHz. Cycle voltammetry (CV) of the cells were measured by CHI660B electrochemical measurement system.
Result and discussion
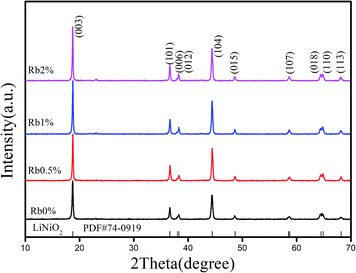
Phase determination was finished with XRD investigation. Fig. 1 displays the XRD patterns of the prepared samples RbxLi(1−x)Ni0.8Co0.1Mn0.1O2. All the diffraction peaks of the prepared samples matched well with the standard pattern of LiNiO2 (PDF#74-0919), therefore the patterns can be indexed on the basis of the a-NaFeO2 structure (R![[3 with combining macron]](https://www.rsc.org/images/entities/char_0033_0304.gif) m space group). When the concentration of Rb is 0.5%, there is no extra diffraction peaks from secondary phases or impurities, which indicates that Rb+ ions were successfully incorporated into the lattice sites of NCM811 and such incorporation did not significantly change the crystal structure of NCM811. But when the Rb concentration increased to 1% and 2%, there is a weak peak at about 23° due to the limited solubility of Rb in the lattice, which means that Rb ions can not be completely incorporated into the lattice sites with a larger concentration.
m space group). When the concentration of Rb is 0.5%, there is no extra diffraction peaks from secondary phases or impurities, which indicates that Rb+ ions were successfully incorporated into the lattice sites of NCM811 and such incorporation did not significantly change the crystal structure of NCM811. But when the Rb concentration increased to 1% and 2%, there is a weak peak at about 23° due to the limited solubility of Rb in the lattice, which means that Rb ions can not be completely incorporated into the lattice sites with a larger concentration.
Furthermore, peak splitting between the 006/012 and 018/110 peaks at 38° and 65° were clear observed, indicating a hexagonal structure with well layered structure was achieved in this approach, and good electrochemical performance could be expected.
The detailed structural information, such as lattice parameters and atomic occupancies were acquired by Rietveld refinement with Jade6.5 software. The results were summarized in Table 1, and whole profile refinements for RbxLi(1−x)Ni0.8Co0.1Mn0.1O2 (x = 0, 0.005, 0.01, 0.02) are shown in Fig. 2. The weight profiled factor Rwp and confidence factor R in Table 1 are two important factors to evaluate the refinement results. When the Rwp is blow 10%, the refinement results are reliable and acceptable. So in our case, the small Rwp demonstrated the proposed structural model is correct, and the refinement results is acceptable since the calculated curve is fitted well with the observed one. It is well-known that among transition metal Ni, Co, and Mn, Ni ions can occupy the lattice sites of Li ions easily. Therefore, when the Ni content increases, the extent of cation mixing is likely to increase too.25,26 As shown in Table 1, the amount of Ni2+ in Li layer is decreased rapidly from 0.49% to 0.28% when the Rb concentration is 0.5%. But with further increase in Rb concentration (from 1% up to 2%), the “cation mixing” rose to 0.36% and 0.41%. This means, a suitable amount of Rb is essential to suppress the cationic mixing.
| Rb0% | a (Å) | 2.873 | c (Å) | 14.203 | V (Å3) | 101.52 | O | Error analysis | |
|---|---|---|---|---|---|---|---|---|---|
| Li | Rb | Ni1 | Ni2 | Co | Mn | Rwp (%) | R (%) | ||
| Site | 3a | 3a | 3b | 3b | 3b | 6c | 10.12 | 10.03 | |
| Position | (0,0,0) | (0,0,0) | (0,0,1/2) | (0,0,1/2) | (0,0,1/2) | (0,0,0.2412) | |||
| Occupancy | 0.961 | 0.049 | 0.753 | 0.121 | 0.123 | 0.995 | |||
| Rb0.5% | a (Å) | 2.881 | c (Å) | 14.247 | V (Å3) | 102.41 | O | Error analysis | |
|---|---|---|---|---|---|---|---|---|---|
| Li | Rb | Ni1 | Ni2 | Co | Mn | Rwp (%) | R (%) | ||
| Site | 3a | 3a | 3a | 3b | 3b | 3b | 6c | 9.78 | 9.32 |
| Position | (0,0,0) | (0,0,0) | (0,0,0) | (0,0,1/2) | (0,0,1/2) | (0,0,1/2) | (0,0,0.2394) | ||
| Occupancy | 0.967 | 0.0054 | 0.028 | 0.774 | 0.121 | 0.116 | 0.997 | ||
| Rb1% | a (Å) | 2.896 | c (Å) | 14.208 | V (Å3) | 103.18 | O | Error analysis | |
|---|---|---|---|---|---|---|---|---|---|
| Li | Rb | Ni1 | Ni2 | Co | Mn | Rwp (%) | R (%) | ||
| Site | 3a | 3a | 3a | 3b | 3b | 3b | 6c | 10.7 | 10.25 |
| Position | (0,0,0) | (0,0,0) | (0,0,0) | (0,0,1/2) | (0,0,1/2) | (0,0,1/2) | (0,0,0.2415) | ||
| Occupancy | 0.954 | 0.0105 | 0.036 | 0.767 | 0.116 | 0.117 | 0.996 | ||
| Rb2% | a (Å) | 2.903 | c (Å) | 14.193 | V (Å3) | 104.08 | O | Error analysis | |
|---|---|---|---|---|---|---|---|---|---|
| Li | Rb | Ni1 | Ni2 | Co | Mn | Rwp (%) | R (%) | ||
| Site | 3a | 3a | 3a | 3b | 3b | 3b | 6c | 9.93 | 9.61 |
| Position | (0,0,0) | (0,0,0) | (0,0,0) | (0,0,1/2) | (0,0,1/2) | (0,0,1/2) | (0,0,0.2412) | ||
| Occupancy | 0.939 | 0.0203 | 0.041 | 0.761 | 0.119 | 0.118 | 0.998 | ||
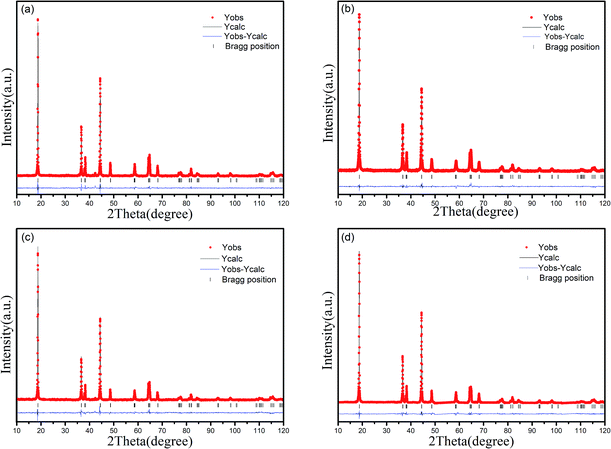 | ||
| Fig. 2 Rietveld refinement for the prepared samples with different Rb concentration: (a) x = 0; (b) x = 0.005; (c) x = 0.01; (d) x = 0.02. | ||
Furthermore, the changes in structural parameters were also obvious. It can be seen from the table that, with the increase in Rb concentration, the cell volume increased continuously, because the ionic radius of Rb (1.52 Å) is much bigger than that of Li (0.76 Å). But the parameters in a, c directions showed different tendency. As shown in Table 1, compared with the sample Rb0%, the values of both a-axis and c-axis are enlarged when the Rb concentration is 0.5%. Thus, it can be confirmed that the Li slab spacing was enlarged after the Rb doping. The increased slab distance is generally associated with faster Li+ ion insertion/extraction, implying that a better electrochemical performance of Rb0.5% would be obtained, and improved specific capacity at low current rate could be expected. However, further increase in Rb concentration did not lead to the increase in the value of c axis as expected, but only the a-axis value increased continually. This results strongly suggested that a crystalline distortion took places with further Rb incorporation, although the reason is not clear. Further works are still being carried on to provide more reasonable explanation, and the results will be reported elsewhere if possible.
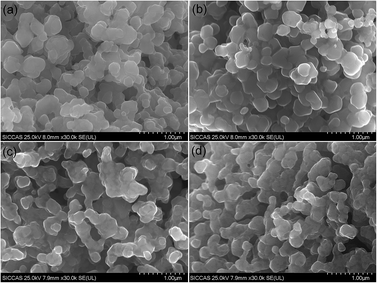
The morphologies of the prepared samples were monitored by SEM. In general, the morphologies of all the sample powders are characterized by uniform and large spherical agglomerates with an average particle size of 5 μm. Fig. 3 shows the SEM images of the prepared RbxLi(1−x)Ni0.8Co0.1Mn0.1O2 samples with different Rb concentration. It can be seen from the figures that the particles are composed by some smaller primary particles about 200–300 nm. And no obvious morphology change was observed for all the particles, which means that Rb incorporation did not change the growth manner of the Rb-NCM materials and therefore similar morphology and close grain size were observed for those Rb-NCM particles with different Rb concentration.
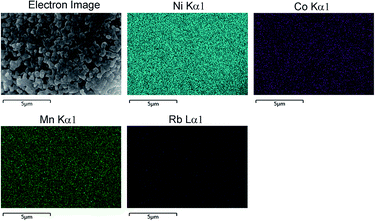
EDS analysis were performed and an typical results for sample Rb1% are shown in Fig. 4, where different colours represent different element. From the EDS mapping results, it can be clearly seen that Ni, Co, Mn and Rb are uniformly distributed in the Rb1% sample. Although the concentration is not high enough, the Rb ions exhibited excellent uniformity without any aggregates. Such a uniform distribution suggested that no Rb-related secondary phases was formed during the solid state reaction, showing good accordance with the XRD analyses shown in Fig. 2. It also confirmed that the Nano-milling process employed in our approach is a promising route for the synthesis of the Rb-doped NCM811 cathode materials with homogeneous elemental distribution.
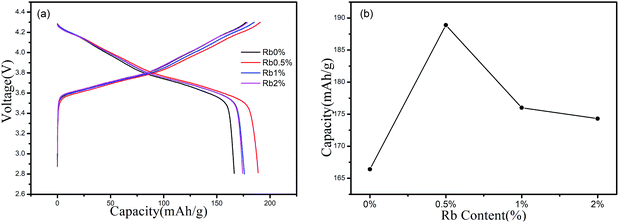
The initial charge/discharge curves of RbxLi(1−x)Ni0.8Co0.1Mn0.1O2 (x = 0, 0.005, 0.01, 0.02) between 2.8 and 4.3 V at 0.5C rate were also conducted at room temperature, as shown in Fig. 5(a). All the prepared electrodes had similar charge and discharge curves and showed a potential plateau at about 3.6 V (vs. Li/Li+). The difference in specific capacity is very clear. For the Rb replaced samples, when the Rb concentration increase from 0% to 2%, the initial discharge capacities were measured as 166.4 mA h g−1, 188.9 mA h g−1, 176 mA h g−1 and 174.3 mA h g−1, respectively. We notice that the electrochemical data obtained by our routine is somewhat smaller than the data obtained by the other methods which usually present a specific capacity of 175 mA h g−1 at 0.5C.27 We realized that a set of optimal process parameters should be considered for preparing the target cathode materials that could meet the industry requirement. However, the goal of this work is to investigate the role of Rb ions played in improving the electrochemical performance of the NCM811 cathode material. So we just prepared the Rb doped material in a well-known procedure, and focused on the changes in the electrochemical properties caused by the difference in Rb concentration. The discharge capacity of sample Rb0.5% was improved by 13.52% when compared to that of sample Rb0%, showing the enhanced result of Rb incorporation. Such improvement can be explained by the volume expansion as confirmed by XRD investigation. As shown in Table 1, Rb ions were incorporated into the original Li sites and c axis was expanded since Rb has a large ionic radius over Li. Such expansion will accelerate the migration of Li ions and the amount of Li ions involved in the electrochemical process could also be increased. By this way, improved specific capacity at low current rate was observed. We also found from XRD results that the doping of Rb+ reduces the Li+/Ni+ mixing, which could be another explanation for the enhanced specific capacity.
However, further increase in Rb concentration did not work as previously expected, but reduced specific capacities were observed for Rb1% and Rb2% samples. This means an optimal Rb concentration is suitable to improve the electrochemical performance. Such behavior can be explained by the changes in the lattice parameter of c axis. From the XRD refinement, as can be seen from Table 1, when x reaches 0.01, the lattice parameter of a axis increased continually while c axis begin to shrink, the cell distortion was observed. Such distortion reduced the spacing of Li ion slab, and restricted the diffusion of Li ions and the reduced electrochemical behaviors were thereafter observed.
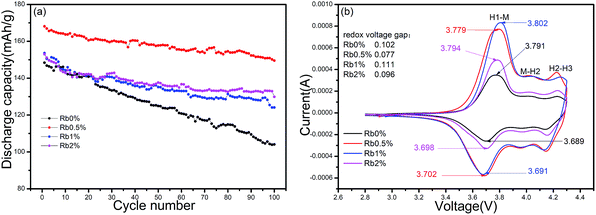
The cycling performance of the prepared samples were also investigated. Fig. 6(a) shows the cycling performance of all the samples tested under a constant current of 1C at room temperature. The capacities of the four samples after 100 cycles are 104.1 mA h g−1, 149.5 mA h g−1, 124.1 mA h g−1 and 129.9 mA h g−1, respectively. Clearly, the sample Rb0% shows a large capacity fade of 29.9% after 100 cycles, whereas all of the other samples Rb0.5%, Rb1%, Rb2% exhibited enhanced cycling performance, the capacity retention rates are 88.9%, 80.8%, 84.9%, respectively. We also noticed the earlier work to improve the rate performance of such materials by the Cr/Mg co-doping method, where capacity of 122.5 mA h g−1 after 50 cycles for LiNi0.78Co0.1Mn0.1Cr0.01Mg0.01O2 was reported.28 Therefore, it seems that our approach, the Rb incorporation method, is also an effective way to improve the rate capability. Such enhancement could be explained by two reasons as follows: the decreased Li+/Ni2+ ion mixing and the expanded Li layer spacing caused by the Rb incorporation. Such modifications in the lattice structure led to the reduce in the internal resistance, the expansion of the Li+ mobile channel, and thus provided a lower activation barrier for Li mobility during the cycling and therefore promoted the Li diffusion in the layered structure.29
Cyclic voltammetry (CV) is a useful electrochemical tool wherein the changes taking place in an electrochemical reaction is monitored by measuring the current–potential responses. Fig. 6(b) depicted the CV profiles of RbxLi(1−x)Ni0.8Co0.1Mn0.1O2 (x = 0, 0.005, 0.01, 0.02) cells, detected between 2.8–4.3 V at a scan rate of 0.1 mV s−1. We can note that there are three pairs of reduction and oxidation peaks in all of the samples, which consistent with the CV results for nickel-rich materials (LiNiO2 or the materials in which Ni/M > 0.5) which present typical curves involving the three-phase transition process, caused by phase transitions of hexagonal phase to monoclinic phase (H1–M, 3.75/3.82 V), monoclinic phase to hexagonal phase (M–H2, 3.98/4.08 V), and hexagonal phase to hexagonal phase (H2–H3, 4.19/4.24 V) during the charge–discharge process.30,31 It is also found that the samples redox voltage gaps in H1 to M region are 0.102 V, 0.077 V, 0.111 and 0.096 V, respectively. Such narrow voltage gap of 0.77 V for Rb0.5% sample indicated that the material has a better reversibility, which is in good accordance with the results obtained in the cyclability test with a capacity retention of 88.9% after 100 cycles shown in Fig. 6(a).
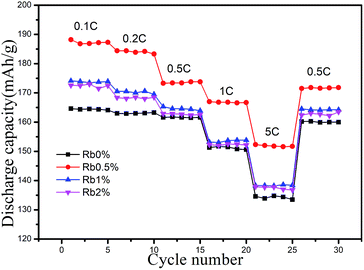
Fig. 7 shows the rate capability of RbxLi(1−x)Ni0.8Co0.1Mn0.1O2 (x = 0, 0.005, 0.01, 0.02) cathodes. As can be seen from the figure, the specific capacity of all the samples decreased as the C rates increasing, and among them the Rb0.5% electrode displays the best rate performance. The pure Rb0% electrode showed a discharge capacity of 164.4 mA h g−1, 162.9 mA h g−1, 161.5 mA h g−1, 150.8 mA h g−1 and 133.5 mA h g−1 at 0.1C, 0.2C, 0.5C, 1C and 5C, respectively. While the results of Rb0.5% electrode is 188.2 mA h g−1, 184.4 mA h g−1, 173.8 mA h g−1, 167 mA h g−1, and 152.3 mA h g−1 respectively under the same C rates and testing condition. The Rb1% and Rb2% electrodes also presented better discharge capacity than Rb0%, indicating the Rb dopant has played a positive role in improving the rate performance. Especially at 5C rate, the capacity of sample Rb0.5% increased 14.08%, 10.21% and 11.33% compared with other three samples, respectively. Therefore, an appropriate amount of Rb doping is also favourable for improving the rate capability of LiNi0.8Co0.1Mn0.1O2. And this improvement of the specific discharge capacity at accelerated rates evidently demonstrates the superiority of the Rb doped NCM811 in the electrochemical properties. We can also found from the figure that the capacity can be easily recovered after 5C charge/discharge, showing the potential of the cathode material in practical application.
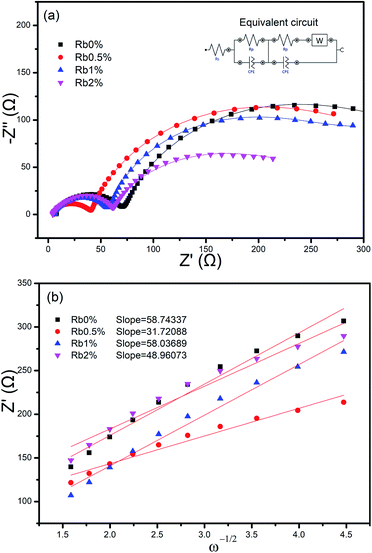
In order to further understand the promoted effects of the Rb ions on the electrochemical properties of NCM811 in the composite, electrochemical impedance test were conducted for all the composite electrodes. As can be seen from Fig. 8(a). The shape of the Nyquist plots for all four samples are all similar. They are composed of a small semicircle in the high frequency and a big semicircle in the high to medium frequency. The small semicircles in the high frequency can be assigned to the resistance of Li+ diffusion in the surface layer (including the SEI film and the surface modified layer).32 Such impedance spectra can be explained by an equivalent circuit model as shown in the inset of Fig. 8(a), including a solution resistance (Rs), a charge-transfer resistance (Rct), a constant phase element (CPE) and Warburg impedance (Zw). The results were fitted with Nova1.01 software and the results are listed in Table 2. Among those parameters listed, Rs represents the resistance of the electrolyte, electrode substrate metal, electrode leads, terminals, etc. Rct represents the charge transfer within the cathode material.33 It's obvious that Rs and Rct of Rb0.5% electrode were the smallest among the four samples, which indicated that the interfacial resistance was reduced and charge transfer at the electrolyte/electrode interface was greatly enhanced as listed in Table 2.
| Sample | Rs (Ω) | Rct (Ω) | σ (Ω s−0.5) | DLi+ (cm2 s−1) |
|---|---|---|---|---|
| Rb0% | 6.27 | 352.5 | 58.74 | 3.33 × 10⁻¹¹ |
| Rb0.5% | 4.66 | 250.3 | 31.72 | 1.14 × 10⁻¹⁰ |
| Rb1% | 4.98 | 326.6 | 58.04 | 3.42 × 10⁻¹¹ |
| Rb2% | 5.37 | 278.1 | 48.96 | 4.82 × 10⁻¹¹ |
To confirm the enhanced Li-ion diffusion, the Li-ion diffusion coefficients (DLi+) were calculated with the data from impedance spectra,34 according to the following eqn (1). In this equation, R is the gas constant, T is the kelvin temperature at the time of the experiment, A is the geometric area of the cathode, n is the number of electrons transferred during redox process, F is the Faraday constant, c is taken as the molar density of Li-ion in an electrode. In which R and F are constants, n, A, and c are consistent in all the samples experiments. The only effect of the calculation is σ, it's the slope of the straight line Z′–ω−1/2 and can be obtained by the eqn (2).
 | (1) |
| Z′ = Rs + Rct + σω−1/2 | (2) |
Fig. 8(b) shows the relationship between Z′ and ω−1/2, from which a good linear characteristic was observed. Combining eqn (1) and (2), the Li-ion diffusion coefficients can be calculated, and the results are list in Table 2. From the results we can know that the Li-ion diffusion coefficients of sample Rb0.5% is 1.14 × 10⁻¹⁰ cm2 s−1, about 3.42 times that of sample Rb0%. Therefore, the migration of Li-ions can be effectively accelerated by Rb doping in the crystal. Combining with the previous analysis, it's clear that incorporation of Rb into the NCM811 lattice could effectively improve the electrochemical behaviours of the material, and an optimal concentration of Rb is limited to 0.5% in our approach. Such results are in good accordance with the changes in lattice parameter of c axis. The c value increases with the incorporation of Rb but decrease with the excess amount of Rb incorporated. Therefore, it seems in our case, for sample Rb0.5%, with the increase in Rb concentration, the c axis increases, the interlayer spacing is enlarged, the diffusion of Li ions is enhanced and finally the electrochemical properties is improved. However, when x reaches 0.01, the lattice distortion happened, c axis begin to shrink, the Li ion diffusion is restricted, and therefore the electrochemical performance is reduced.
Conclusions
In summary, well-ordered layered Rb-NCM cathode materials had been successfully synthesized by solid-state reaction under 800 °C. XRD analysis demonstrated a typical hexagonal structure for the prepared samples. Rietveld refinement confirmed that the Rb+ ions were incorporated into the Li slab, resulting in the reduce of cationic mixing and the expansion of the Li slab spacing. Such changes in crystal structure decreased the activation energy for Li+ ion to migrate in the channel and enhance the layer structural stability, and thus led to an improvement in electrochemical performance. As a result, sample Rb0.5% presented the best electrochemical properties, with improved initial discharge capacity, rate capability, and cyclability. The initial discharge capacity of sample Rb0.5% is 188.9 mA h g−1, increased 13.52% when compared with that of sample Rb0%. Even at high rate of 5C, sample Rb0.5% also showed excellent discharge capacity of 152.3 mA h g−1, which increased 14.08%, 10.21% and 11.33% when compared with other three samples, respectively. An improvement in the diffusion coefficient was also observed for such Rb replaced samples. The sample with 0.5% Rb incorporation also presented a diffusions coefficient of 1.14 × 10⁻¹⁰ cm2 s−1, which increased several times when compared with the non-doped sample. The enhanced electrochemical performance and the increased Li+ ions diffusion, could be attributed to the expanded Li slab thickness and reduced ionic mixing caused by Rb incorporation. Therefore, the results obtained in our approach indicated that the Rb-substituted LiNi0.8Co0.1Mn0.1O2 is a promising candidate for application in high-performance lithium-ion batteries.Conflicts of interest
There are no conflicts to declare.Acknowledgements
The work was supported by Science and Technology Commission of Shanghai Municipality (14520503100, 13PJ1407400 and 201310-JD-B2-009) and National Natural Science Foundation of China (21306113) and Shanghai Municipal Education Commission (15ZZ095).References
- G. Derrien, J. Hassoun, S. Panero and B. Scrosati, Adv. Mater., 2010, 19, 2336–2340 CrossRef.
- N. Recham, J. N. Chotard, L. Dupont, C. Delacourt, W. Walker, M. Armand and J. M. Tarascon, Nat. Mater., 2010, 9, 68 CrossRef CAS PubMed.
- Y. K. Sun, Z. Chen, H. J. Noh, D. J. Lee, H. G. Jung, Y. Ren, S. Wang, S. Y. Chong, S. T. Myung and K. Amine, Nat. Mater., 2012, 11, 942–947 CrossRef CAS PubMed.
- Y. K. Sun, S. T. Myung, B. C. Park, J. Prakash, I. Belharouak and K. Amine, Nat. Mater., 2009, 8, 320–324 CrossRef CAS PubMed.
- M. S. Whittingham, Cheminform, 2004, 104, 4271 CAS.
- T. Ohzuku and A. Ueda, J. Electrochem. Soc., 1994, 141, 2972–2977 CrossRef CAS.
- M. H. Kim, H. S. Shin, D. Shin and Y. K. Sun, J. Power Sources, 2006, 159, 1328–1333 CrossRef CAS.
- W. Liu, P. Oh, X. Liu, M. J. Lee, W. Cho, S. Chae, Y. Kim and J. Cho, Angew. Chem., 2015, 54, 4440 CrossRef CAS PubMed.
- J. Li, L. E. Downie, L. Ma, W. Qiu and J. R. Dahn, J. Electrochem. Soc., 2015, 162, 1401–1408 CrossRef.
- S. M. Bak, E. Hu, Y. Zhou, X. Yu, S. D. Senanayake, S. J. Cho, K. B. Kim, K. Y. Chung, X. Q. Yang and K. W. Nam, ACS Appl. Mater. Interfaces, 2014, 6, 22594–22601 CAS.
- K. Min, K. Kim, C. Jung, S. W. Seo, Y. Y. Song, H. S. Lee, J. Shin and E. Cho, J. Power Sources, 2016, 315, 111–119 CrossRef CAS.
- R. Hausbrand, G. Cherkashinin, H. Ehrenberg, M. Groeting, K. Albe, C. Hess and W. Jaegermann, Mater. Sci. Eng., B, 2015, 192, 3–25 CrossRef CAS.
- X. Zhang, W. J. Jiang, A. Mauger, Q. Lu, F. Gendron and C. M. Julien, J. Power Sources, 2011, 195, 1292–1301 CrossRef.
- M. E. A. Y. D. Dompablo and G. Ceder, J. Power Sources, 2003, 119, 654–657 CrossRef.
- H. Xu, S. Deng and G. Chen, J. Mater. Chem. A, 2014, 2, 15015–15021 CAS.
- L. J. Li, X. H. Li, Z. X. Wang, H. J. Guo, Y. Peng, C. Wei and W. Ling, J. Alloys Compd., 2010, 507, 172–177 CrossRef CAS.
- C. Qin, J. Cao, J. Chen, G. Dai, T. Wu, Y. Chen, Y. Tang, A. Li and Y. Chen, Dalton Trans., 2016, 45, 9669 RSC.
- K. Min, S. W. Seo, Y. Y. Song, H. S. Lee and E. Cho, Phys. Chem. Chem. Phys., 2017, 19, 1762 RSC.
- Q. Y. Chen, C. Du, D. Qu, X. Zhang and Z. Tang, RSC Adv., 2015, 5, 75248–75253 RSC.
- Z. Wang, H. Q. Lu, Y. P. Yin, X. Y. Sun, X. T. Bai, X. L. Shen, W. D. Zhuang and S. G. Lu, Rare Met., 2015, 1–6 Search PubMed.
- T. Li, X. Li, Z. Wang and H. Guo, J. Power Sources, 2017, 342, 495–503 CrossRef CAS.
- P. Dong, D. Wang, Y. Yao, X. Li, Y. Zhang, J. Ru and T. Ren, J. Power Sources, 2017, 344, 111–118 CrossRef CAS.
- K. Meng, Z. Wang, H. Guo, X. Li and J. Wang, Hydrometallurgy, 2017, 174(Suppl. C), 1–9 CrossRef CAS.
- N. Li, Y. S. He, X. Wang, W. Zhang, Z. F. Ma and D. Zhang, Electrochim. Acta, 2017, 231, 363–370 CrossRef CAS.
- D. Song, X. Wang, E. Zhou, P. Hou, F. Guo and L. Zhang, J. Power Sources, 2013, 232, 348–352 CrossRef CAS.
- J. H. Jo, C. H. Jo, H. Yashiro, S. J. Kim and S. T. Myung, J. Power Sources, 2016, 313, 1–8 CrossRef CAS.
- S. S. Jan, S. Nurgul, X. Shi, H. Xia and H. Pang, Electrochim. Acta, 2014, 149, 86–93 CrossRef CAS.
- B. Zhang, L. Li and J. Zheng, J. Alloys Compd., 2012, 520, 190–194 CrossRef CAS.
- K. Kang, Y. S. Meng, J. Bréger, C. P. Grey and G. Ceder, Cheminform, 2006, 311, 977–980 CAS.
- H. Xie, K. Du, G. Hu, J. Duan, Z. Peng, Z. Zhang and Y. Cao, J. Mater. Chem. A, 2015, 3, 20236–20243 CAS.
- W. Li, J. N. Reimers and J. R. Dahn, Solid State Ionics, 1993, 67, 123–130 CrossRef CAS.
- L. Liang, G. Hu, Y. Cao, K. Du and Z. Peng, J. Alloys Compd., 2015, 635, 92–100 CrossRef CAS.
- M. D. Levi, K. Gamolsky, D. Aurbach, U. Heider and R. Oesten, Electrochim. Acta, 2000, 45, 1781–1789 CrossRef CAS.
- T. J. Park, J. B. Lim and J. T. Son, Cheminform, 2014, 45, 1671–1675 Search PubMed.
| This journal is © The Royal Society of Chemistry 2017 |

