 Open Access Article
Spherical polyelectrolyte nanogels as templates to prepare hollow silica nanocarriers: observation by small angle X-ray scattering and TEM
Haoya Hana,
Li Li*a,
Yuchuan Tiana,
Yunwei Wanga,
Zhishuang Yea,
Qingsong Yanga,
Yiming Wangab,
Regine von Klitzingc and
Xuhong Guo *ad
*ad
aState Key Laboratory of Chemical Engineering, East China University of Science and Technology, 200237 Shanghai, P. R. China. E-mail: lili76131@ecust.edu.cn; guoxuhong@ecust.edu.cn
bDepartment of Chemical Engineering, Delft University of Technology, van der Maasweg, 2629 HZ Delft, The Netherlands
cDepartment of Physics, Technical University Darmstadt, Alarich-Weiss-Strasse 10, 64287 Darmstadt, Germany
dEngineering Research Center of Materials Chemical Engineering of Xinjiang Bingtuan, Shihezi University, 832000 Xinjiang, P. R. China
First published on 12th October 2017
Abstract
Hollow silica nanoparticles were prepared through generating a silica layer in spherical polyelectrolyte nanogels (SPN), which consisted of a solid core of polystyrene (PS) and a shell of crosslinked poly(acrylic acid) (PAA), followed by removing the PS core via solvent dissolution. Small angle X-ray scattering (SAXS) in combination with TEM were employed to observe SPN, silica–polymer composite, and hollow silica nanoparticles. It was confirmed that SAXS is a powerful method to monitor the generation of silica layer in SPN. The density and thickness of generated silica layer in SPN were found to be tunable by controlling the crosslinking density of the templates. The porous structure and pH sensitivity of silica layer allowed the obtained hollow silica to be ideal carriers for controlled drug delivery.
Introduction
Owing to their outstanding features such as low density, large void space, large specific surface area, hollow-structured nanoparticles have presented promising application prospects in various fields, such as adsorption and storage, confined catalysis, controlled drug release, simultaneous diagnosis, and targeted therapy of cancers.1–6 Among them, hollow silica nanoparticles have been considered as the most commonly used drug delivery systems due to their low cost, high load capacity, and low toxic nature.6–14 When functionalized by stimuli-responsive polymers, hollow silica has shown significant advantages for controllable drug release over traditional drug carriers.12–14The most popular strategy to prepare hollow silica particles is using polymeric templates which can be removed by either calcination or solvent dissolution.15–21 The choice of template (such as polymeric colloidal particles16,17 or surfactants6,22) and the preparation methods (such as sol–gel reactions23 and self-assembly techniques15) influence the structure of obtained hollow silica.1,4 For application of hollow silica as drug delivery system, a thin shell can improve the drug storage capacity whereas a porous shell contributes to drug loading or release.1,4
Spherical polyelectrolyte brushes (SPB), which consist of a polystyrene (PS) core and a shell of linear poly(acrylic acid) (PAA) chains, were reported as outstanding templates to prepare pH-sensitive hollow silica nanoparticles.24 Our recent work found that silica layer generated inside SPB was pH sensitive and had an ideal inner-loose outer-dense structure, allowing obtained hollow silica to have high storage capacity and thus to be ideal candidates for controlled drug release.25 However, the structure of obtained hollow silica nanoparticles was not controllable, for example, the wall thickness was relatively high (>20 nm), and the silica layer density was not tunable.24,25
Small angle X-ray scattering (SAXS) has been reported as a powerful method to study core–shell particle with narrow size distribution and high electron density contrast.26–34 Transition electron microscopy (TEM) is one of the most employed methods to observe the structure of hollow silica, however, it can hardly observe density of the silica layer nor the structural change of hollow silica in solution when changing solvent conditions such as pH. Herein, the structure of obtained silica was studied by SAXS in combination with TEM. Through SAXS analysis, the crosslinking effect on the generation of silica in the templates can be observed. The thickness and density of generated silica in SPN can be quantified by the electron density distribution derived from fitting SAXS curves. The pH sensitivity of silica layer in solution is also observable by SAXS.
In this work, we aim at preparation of hollow silica with tunable wall thickness and silica layer density. We modified the template SPB by crosslinking the linear PAA chains and obtained spherical polyelectrolyte nanogels (SPN) which consisted of a PS core and a shell of crosslinked PAA. The wall thickness and silica layer density of hollow silica nanoparticles were found to be controllable by varying crosslinking densities of the templates, which should be favorable for application in drug delivery.
Experimental
Materials
Styrene (AR, Sinopharm) and acrylic acid (AA, AR, Sinopharm) were destabilized by reduced pressure distillation and stored at 4 °C. Potassium persulfate (KPS, AR, J & K) and sodium dodecyl sulfonate (SDS, AR, J & K) were recrystallized in water. N,N′-methylenebisacrylamide (BIS, AR, Aldrich), sodium hydroxide (NaOH, AR, Sinopharm), hydrochloric acid (HCl, AR, Sinopharm), sodium chloride (NaCl, AR, Sinopharm), ammonia solution (NH3·H2O, 25 wt%, Sinopharm), tetraethoxysilane (TEOS, AR, Aldrich), absolute ethanol (C2H5OH, 99.5%, Sinopharm), and trichloromethane (CHCl3, AR, J & K) were used as received. Water was purified using reverse osmosis and ion exchange (Millipore Milli-Q system). Methacryloyl chloride (MC, AR, Tokyo Chemical Industry), 2-hydroxy-4′-hydroxyethoxy-2-methyl propiophenone (HMP, AR, Acros Organics), and other materials were used as received. Photoinitiator (2-[p-(2-hydroxy-2-methylpropiophenone)]-ethylene glycol-methacrylate) (HMEM) was synthesized as presented in our previous publication.35Synthesis of SPN
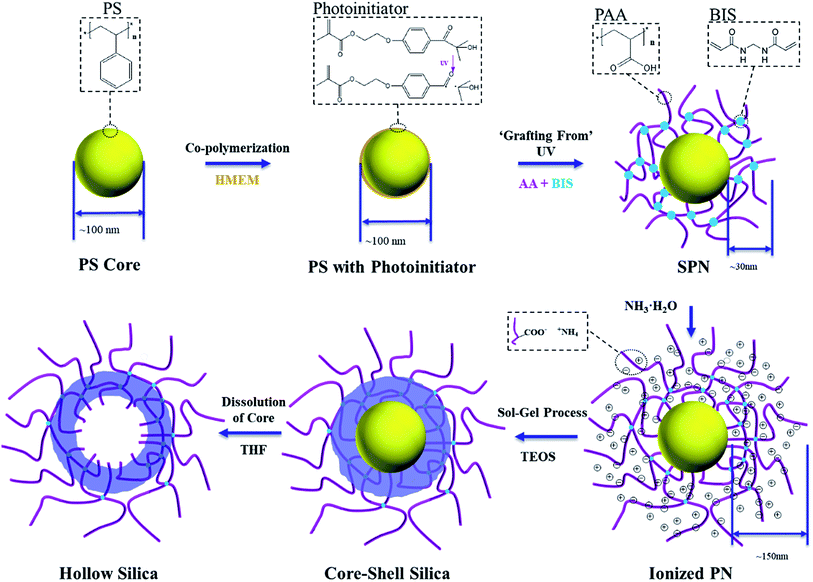
Spherical polyelectrolyte nanogels (SPN) were prepared via emulsion polymerization of PS core, covalent attachment of photoinitiator, and photo-emulsion polymerization to graft crosslinked poly(acrylic acid) (PAA) (Fig. 1).36,37 Typically, 0.24 g of SDS and 0.6 g of KPS were dissolved in 140 g of water followed by adding 10 g of styrene monomer. Under a nitrogen atmosphere with continuous stirring (300 rpm), the polymerization was carried out in 80 °C for 1 h followed by cooling down to 70 °C, where copolymerization of styrene and photoinitiator (1 g of HMEM dissolved in 8 g acetone) proceeded in a “starved” condition (6 s per drop) for another 1 h. After cooling down and purification by dialysis until the conductance of the eluate did not change anymore, 100 g of PS core latex with the initiator (3 wt%), 3 g of AA, and a determined amount of crosslinker BIS were added into a homemade photoreactor and diluted to 400 mL in total. The molar ratio of BIS/AA was 0%, 1%, 5%, or 10%. Crosslinked PAA was grafted from the surface of PS core by photoemulsion polymerization under UV radiation in a nitrogen atmosphere with vigorous stirring. After the reaction, dialysis and ultrafiltration were conducted for further purification.Preparation of hollow silica
Hollow silica nanoparticles were prepared as shown in Fig. 1. In a typical run, 10 g of SPN (1 wt%) and 1.8 mL of ammonia solution were dispersed in 90 mL of ethanol under vigorous stirring. 0.8 g of TEOS dissolved in 5 mL of ethanol was added dropwise (2.4 mL h−1) with the help of a homemade micro scale sampling pump and stirred for 16 h at room temperature. The product was separated by centrifugation and washed with ethanol and water alternatively for 5 rounds to remove the solvent and free silica particles. The as-obtained emulsion was dispersed in 50 mL of tetrahydrofuran (THF) by solvent exchanged and slightly stirred for 48 h to make sure the PS was dissolved. The product was centrifuged and washed with ethanol, hydrochloric acid solution (1 mM) and water alternately for five rounds.24TEM and DLS
Transmission electron microscopy was conducted using a JEOL2100F electron microscope operating at 200 kV. Samples were prepared by drying a drop of a dilute dispersion onto a carbon-coated copper grid. Dynamic light scattering was performed using a PSS Nicomp 380 with an affixed scattering angle of 90°. Samples were highly diluted to avoid particle interactions.SAXS data acquisition
SAXS data were collected at beamline BL16B1 of the Shanghai Synchrotron Radiation Facility (SSRF, X-ray wavelength 1.24 nm, sample-detector distance 5 m, X-ray spot size 0.3 mm), with a 2D CCD detector recording the scattering intensity. Samples were injected between two pieces of polyimide films which had 1 mm X-ray path length. All SAXS data were azimuthally averaged into one-dimensional patterns, corrected for detector response and sample transmission. After background subtraction, SAXS data were finally calibrated to absolute intensity with pure water as the stander sample (as described by the beamline scientists38). Latex concentrations used in SAXS measurements were small (<1 wt%) to minimize particle interaction. The pH of solutions was adjusted with NaOH or HCl standard aqueous solutions. It should be kept in mind that the pH was adjusted while keeping the ionic strength constant.39SAXS data analysis
The scattering intensity I(q) is measured as a function of the X-ray momentum transfer q = (4π/λ)sin![[thin space (1/6-em)]](https://www.rsc.org/images/entities/char_2009.gif) θ, where 2θ is the scattering angle and λ = 1.2 nm is the incident X-ray wavelength. The absolute scattering intensity for a suspension of particles is represented as26,28,31,33,40–44
θ, where 2θ is the scattering angle and λ = 1.2 nm is the incident X-ray wavelength. The absolute scattering intensity for a suspension of particles is represented as26,28,31,33,40–44
 | (1) |
Dynamic light scattering experiments suggested that a Gaussian distribution was an appropriate description of the polydispersities of both the templates and silica composite particles. Thus, a Gaussian was assumed for the size distribution function [W(r)] of all scattering particles in the analyzed models as follows
 | (2) |
![[r with combining macron]](https://www.rsc.org/images/entities/i_char_0072_0304.gif) and σ are the mean value and the standard deviation of r, respectively.
and σ are the mean value and the standard deviation of r, respectively.
Modeling of SPN follows that of SPB reported previously.27,28,31,33,34,40,42–47 The effect of crosslinking on the brush layer can be easily studied by the change of radial electron density distribution of SPN from SPB. The scattering intensity of SPN contains three independent contributions in principle:34,40,42
| I0(q, r) = ICS(q, r) + Ifluct(q) + IPS(q) | (3) |
ICS(q, r) is given by B2(q, r) with the scattering amplitude B(q, r) calculated as34,48
 | (4) |
The second term Ifluct(q) can be described by Lorentzian as follows40
 | (5) |
For obtained silica composite particles, the scattering intensity can be represented as
| I0(q, r) = Icsc(q, r) + Ifluct(q) + Iin(q) | (6) |
Fig. 2 shows the multilayer model according to which Icsc(q, r) is calculated. The PS core, silica shell, and PAA corona are distinguished by their electron densities. While the core has a constant value of Δρ(r), both silica shell and PAA corona are divided into multilayers with different Δρ(r). Silica shell is more subtly divided into 5 layers than PAA corona (2 layers) due to the much higher excess electron density of silica (325.0 nm−1) than PAA (44.6 nm−1) or PS (6.4 nm−1).26,28,43
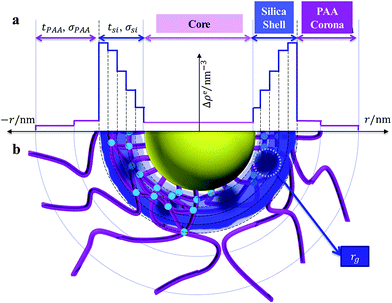 | ||
| Fig. 2 The multilayer model of silica generated in SPN. (a) Radial electron density distribution; (b) schematic diagram. | ||
It should be noted that the core radius rcore, the silica shell thickness tsi, and the PAA corona thickness tPAA, follow eqn (2). And the calculation of Icsc(q, r) follows eqn (4)
The extra scattering from the static inhomogeneity of the shell is described in good approximation in present by an empirical decomposition as follows34,40,49–52
| Iin(q) = Iin(0)exp(−rg2q2) | (7) |
Results and discussion
Structure of SPN observed by SAXS
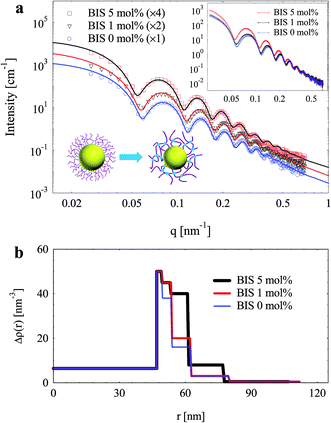
Both SPB with linear PAA chains and SPN with crosslinked PAA were used as templates to prepare silica particles, and SAXS was employed to characterize them (Fig. 3). The oscillations of SAXS curves imply narrow size distributions of both SPB and SPN. Scattering intensities increased after crosslinking of the brush shell, which should be attributed to the higher concentration of PAA chain segments and higher excess electron density of BIS (63.8 nm−3) over AA (46.4 nm−3). A slight shift towards low q values of maxima on SAXS curves was observed after crosslinking, indicating an increase of effective shell thickness.Through fitting the experimental data, radial electron density distributions were derived as shown in Fig. 3b. The electron density of the brush layer decreased outwards due to its spherical geometry. Upon increasing crosslinking density, the electron density of inner PAA layer increased significantly. However, the electron density of outer PAA layer hardly changed. As a result, the PAA shell should possess a structure of highly crosslinked inner layer and a corona-like outer layer with lower crosslinking density. Similar structure of PS-poly(N-isopropylacrylamide) (PNIPAm) core–shell particles was observed by SAXS.41 It should be noted that SAXS is more sensitive to inner layers with high electron density rather than the corona.39 Therefore, the increase of electron density of the inner layers induced the shift of maxima on SAXS curves as mentioned above (inset of Fig. 3a), although the total shell thickness hardly changed. However, in this case, such change cannot be observed by DLS.
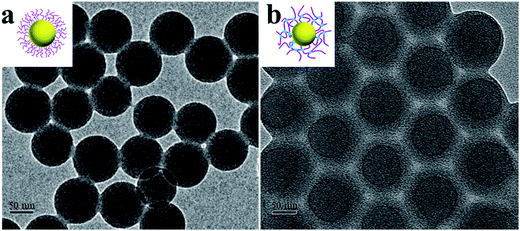
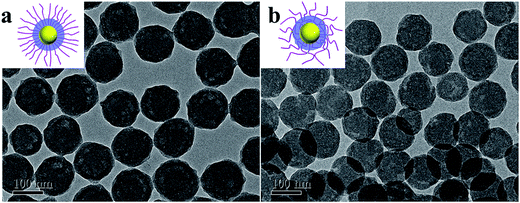
TEM pictures of both SPB and SPN (Fig. 4) show ideal spherical geometry and narrow size distribution. PAA chains were not observable due to their low contrast as well as their collapse during drying (Fig. 4a).53 Therefore the radius of SPB determined by TEM (ca. 46 nm) was the radius of the PS core, which is consistent with the core radius determined by SAXS (47 nm as shown in Fig. 3b). In the case of SPN (10 mol%, Fig. 4b), a shadow with a thickness of ca. 20 nm on the surface was observed, which is probably induced by the crosslinking of PAA shell.36
The shell thickness of SPB and SPN as a function of pH determined by both SAXS and DLS were compared in Fig. 5. Upon increasing pH form 3 to 9, their shell thicknesses increased and reached a plateau with further increase of pH. The size determined by SAXS is always smaller than the hydrodynamic size determined by DLS for both SPB and SPN.41,43 After crosslinking, the maximum swelling reduced from 67 to 38 nm as determined by DLS and from 47 to 31 nm as determined by SAXS, indicating that crosslinking inhibited the swelling of the PAA shell.
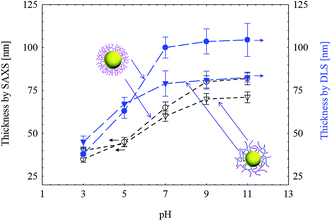 | ||
| Fig. 5 The shell thickness of SPB and SPN (with 5 mol% BIS) as a function of pH determined by SAXS and DLS ([NaCl] = 10 mM). | ||
Effect of crosslinking on silica generation
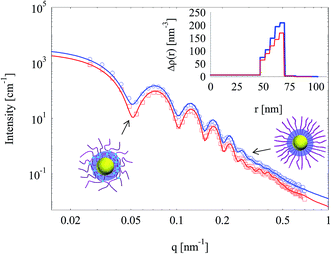
Silica layers were generated in both SPB and SPN (with 1 mol% BIS) and characterized by SAXS as shown in Fig. 6. The oscillations of both SAXS curves indicate that the nanoparticles showed narrow size distributions and spherical geometry, which was confirmed by TEM (Fig. 7). SAXS intensities of nanoparticles templated by SPN had more obvious oscillations compared with those by SPB, suggesting that crosslinking with BIS had a positive effect to generate spherical particles with narrow size distribution. Scattering intensities of silica nanoparticle templated by SPN were lower than those by SPB in the whole measuring q range, which implies a reduction in electron density.The inset of Fig. 6 shows the radial electron density distributions derived from fitting SAXS intensities. The electron density of both silica shells increased radially.25 The excess electron density of silica layer generated in SPN was lower compared with that in SPB. Crosslinking seems to reduce the density of silica layer inside the PAA shell.
SPN with increased crosslinking density (with 5 mol% BIS) were also used to prepare silica nanoparticles. Fig. 8a shows the scattering intensities of nanoparticles before and after the generation of silica layer in SPN. A remarkable increase of intensity was observed after the generation of silica layer.
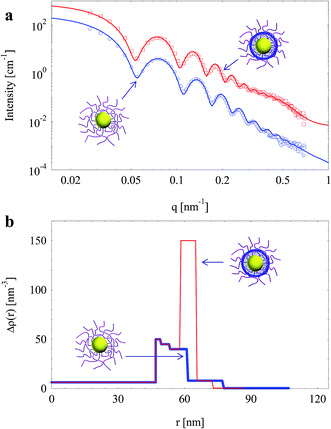 | ||
| Fig. 8 (a) SAXS intensities of silica nanoparticles template by SPN (with 5 mol% BIS); solid lines are fits of experimental data. (b) Radial electron density distributions (same colour). | ||
Electron density distributions of the nanoparticles derived through fitting are shown in Fig. 8b. Interestingly, electron density of the middle layer in the shell increased significantly while the electron density of the inner layer and the corona hardly changed. It suggests that silica was generated as a thin shell (ca. 7 nm) locating around the surface of crosslinked PAA layer instead of the vicinity the PS core as the case with 1 mol% BIS (Fig. 6). It is worth to note that the electron density of generated silica layer reduced from 170 nm−3 to 150 nm−3 when crosslinking density of SPN increased from 1 mol% to 5 mol% BIS. Therefore, the thickness and density of generated silica layer can be tuned by controlling crosslinking density of the template.
Template SPN with further increased crosslinking density (with 10 mol% BIS) were used to prepare silica particles. The smeared minima on scattering data of obtained nanoparticles indicate a broad size distribution as shown in Fig. 9. TEM picture (inset of Fig. 9) shows that there appeared much smaller silica particles (ca. 20 nm in radius). A model of small particles randomly surrounding large particles (inset of Fig. 9) was thus employed to fit SAXS data (Fig. 9). Previous work demonstrated that the total intensity of such system can be described by the sum of scattering intensity of large particles and that of small particles with a satisfied approximation.45,54 Herein, calculated scattering intensity of core–shell silica nanoparticles and that of small silica particles were added up and showed good agreement with experimental data (Fig. 9). The smearing of deep minima on SAXS curve was due to the extra scattering of small silica particles together with the deviation from spherical geometry of the silica layer (as confirmed by TEM in the inset of Fig. 9). Silica layer thickness further decreased to ca. 5 nm and its electron density (100 nm−3) decreased as well.
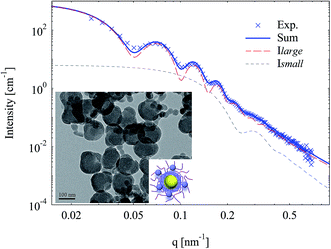 | ||
| Fig. 9 SAXS intensities and fits of silica nanoparticles template by SPN (with 10 mol% BIS). Inset is the TEM picture and a scheme of small silica particles surrounding core–shell silica. | ||
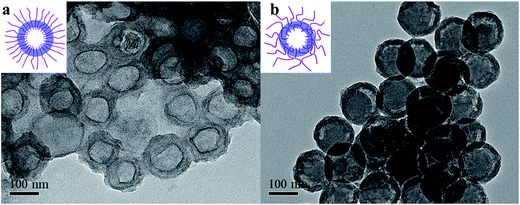
After dissolving the PS core, hollow silica particles with linear or crosslinked PAA were obtained and characterized by TEM as shown in Fig. 10. For hollow silica with uncrosslinked PAA chains, the cavity and silica layer can be well distinguished since silica generated in SPB had a relatively high density as confirmed by its electron density (see inset of Fig. 6). The silica thickness is ca. 20 nm, which agrees well with the value (23 nm) determined by SAXS. Without the prop of solid PS core, the hollow particles seem to be deformed after drying when preparing TEM samples.
After crosslinking of the PAA chains, the obtained hollow silica maintained its spherical geometry without any deformation during drying. However, the interface between the cavity and silica layer became indistinct (Fig. 10b), which is probably due to that silica layer was not generated on the smooth surface of PS core but in middle layer of the shell (Fig. 11).
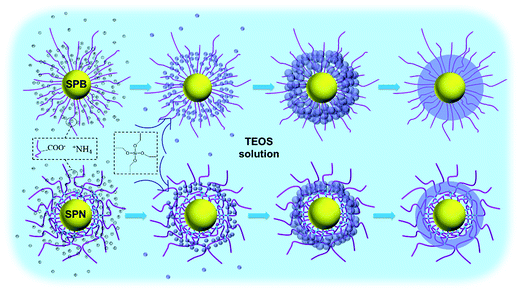
There are two possible ways for the generation of silica layer from TEOS in SPN:36 (a) TEOS diffuse and take an in situ nucleation and growth mainly in the PAA layer by the catalysis of ammonia on the analogy of the in situ reduction of metallic and oxidic ions in SPB;55 (b) alternatively, the silica nucleation mainly happen outside SPB followed by diffusion into the brush layer. The crosslinked PAA can hinder the silica nuclei from penetrating inwards if the pore size is small enough. The hindrance by the crosslinked PAA suggests a mechanism of silica generation as shown in Fig. 11. Due to the Donnan equilibrium, most ammonium ions (as the catalyst for sol–gel reaction) were captured inside SPB with a minority in solution.34 However, the concentration of TEOS should be higher in solution than in SPB since TEOS diffused into SPB under a “starved” condition. Therefore, silica nucleation took place not only inside SPB but also in solution, and silica nuclei formed in solution can diffuse into SPB, followed by their growth, contact with their neighbours, and finally merging into a silica layer.
For SPN with high crosslinking density, however, their small pore size hindered the diffusion of formed silica nuclei in solution, resulting in a thin silica layer with low density formed around the crosslinked PAA (Table 1). Backes et al.56 has studied the uptake of magnetic nanoparticles in polymer microgel with various crosslinking density and concluded that with increasing cross-linker concentration the mesh size reduced and resulted in a steric hindrance of the magnetic nanoparticles. Analogously, steric hindrance limits the silica nuclei from penetrating into the PAA network. If the size of silica nuclei are larger than the mesh size, they cannot penetrate through. The insufficiency of silica nuclei results in the reduction of density and thickness of the generated silica layer.
| BIS ratio | 0 | 1% | 5% | 10% |
|---|---|---|---|---|
| Electron density (max.)/nm−3 | 210 | 170 | 150 | 100 |
| Thickness/nm | 22 | 21 | 7 | 5 |
It is worth noting that generated silica had always lower density as confirmed by their lower electron density than solid silica,26 suggesting that generated silica should be porous which contributes to its application in drug loading and release. By alternating the crosslinking density, it is possible to change the silica density and silica layer thickness.
Effect of pH on silica layer
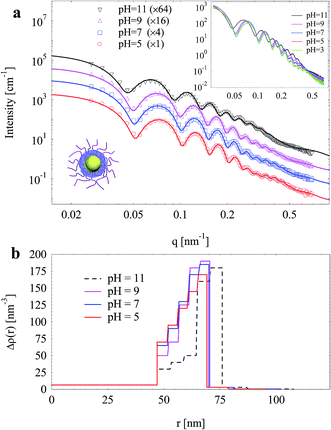
Fig. 12a displays the scattering intensities and fits of the silica nanoparticles (1 mol% BIS) as a function of pH. The fit of scattering intensities at pH 3 is not shown since the experimental data overlap significantly with that at pH 5 in the whole measuring q range (inset of Fig. 12a).Upon increasing pH from 5 to 9, scattering intensities increased obviously especially in intermediate q values (0.2–0.4 nm−1), and scattering minima shifted to low q values to a small extent, indicating an increase in both size and electron density. When pH further increased to 11, a remarkable shift of scattering minima to low q values was observed, indicating a significant growth in size. At high q values (q > 0.45 nm−1), the increase of scattering intensities upon increasing pH (from 3 to 9) is attributed to the enhanced spatial fluctuation of PAA.25
Electron density distributions were derived from fitting experimental data (Fig. 12b). From pH 5 to 9, the silica layer expanded slightly by ca. 1.5 nm. Upon increasing pH, the crosslinked PAA gradually dissociated, resulting in the enhanced electrostatic repulsion which expanded the PAA layer and thus the silica layer. Meanwhile, the electron density of inner silica layer decreased whereas that of outer silica layer increased (Fig. 12b). As discussed above, the inner silica layer was relatively looser compared to the outer one. The expansion of the silica shell mainly happened in the loose inner layers rather than the compact outer one. The inner layer expanded outwards and merged into the outer layer, resulting in the change of electron density distribution of the silica layer. At pH 11, silica layer thickness increased dramatically by ca. 6 nm with a decreased electron density of the whole silica layer, which was attributed to the partial dissolution of silica at pH 11. The pH sensitivity of the silica layer allows hollow silica after removal of the PS core to be ideal candidates for pH-triggered controlled drug delivery.
Conclusions
In this paper, we synthesized spherical polyelectrolyte nanogels with a PS core and a crosslinked PAA shell with various crosslinking densities. Using them as templates, silica layers were generated in the network, and hollow silica nanoparticles were obtained after dissolving PS core by THF. As observed by small angle X-ray scattering together with TEM, the density and thickness of generated silica layer can be controlled by varying the crosslinking density of PAA nanogel. The porous structure and pH sensitivity of silica layer revealed by SAXS make it possible for the obtained hollow silica nanoparticles to be ideal candidates for pH-triggered drug release. SAXS was confirmed to be a powerful method to observe the generation of silica in SPN.Conflicts of interest
There are no conflicts to declare.Acknowledgements
We gratefully thank the financial support from the NSFC Grants (51273063 and 21476143), the Fundamental Research Funds for the Central Universities, 111 Project Grant (B08021), Shanghai Synchrotron Radiation Facility, and the China Scholarship Council.References
- J. Hu, M. Chen, X. Fang and L. Wu, Chem. Soc. Rev., 2011, 40, 5472–5491 RSC.
- Y. Zhao and L. Jiang, Adv. Mater., 2009, 21, 3621–3638 CrossRef CAS.
- Y. Si, M. Chen and L. Wu, Chem. Soc. Rev., 2016, 45, 690–714 RSC.
- Y. Li and J. Shi, Adv. Mater., 2014, 26, 3176–3205 CrossRef CAS PubMed.
- P. Podsiadlo, S. G. Kwon, B. Koo, B. Lee, V. B. Prakapenka, P. Dera, K. K. Zhuravlev, G. Krylova and E. V. Shevchenko, J. Am. Chem. Soc., 2013, 135, 2435–2438 CrossRef CAS PubMed.
- A. Khanal, Y. Inoue, M. Yada and K. Nakashima, J. Am. Chem. Soc., 2007, 129, 1534–1535 CrossRef CAS PubMed.
- F. Tang, L. Li and D. Chen, Adv. Mater., 2012, 24, 1504–1534 CrossRef CAS PubMed.
- Y. Zhang, B. Y. W. Hsu, C. Ren, X. Li and J. Wang, Chem. Soc. Rev., 2015, 44, 315–335 RSC.
- A. Guerrero-Martinez, J. Perez-Juste and L. M. Liz-Marzan, Adv. Mater., 2010, 22, 1182–1195 CrossRef CAS PubMed.
- E. Amstad and E. Reimhult, Nanomedicine, 2012, 7, 145–164 CrossRef CAS PubMed.
- X. W. Lou, L. A. Archer and Z. Yang, Adv. Mater., 2008, 20, 3987–4019 CrossRef CAS.
- Y. Zhu, J. Shi, W. Shen, X. Dong, J. Feng, M. Ruan and Y. Li, Angew. Chem., 2005, 117, 5213–5217 CrossRef.
- S. S. Cao, Y. Zhang, L. L. Zhou, J. R. Chen, L. Fang, D. Fei, H. J. Zhu and Y. Ge, J. Mater. Chem. B, 2014, 2, 7243–7249 RSC.
- C. Park, K. Oh, S. C. Lee and C. Kim, Angew. Chem., Int. Ed., 2007, 46, 1455–1457 CrossRef CAS PubMed.
- F. Caruso, R. A. Caruso and H. Mohwald, Science, 1998, 282, 1111–1114 CrossRef CAS PubMed.
- M. Chen, L. M. Wu, S. X. Zhou and B. You, Adv. Mater., 2006, 18, 801–806 CrossRef CAS.
- Z. W. Deng, M. Chen, S. X. Zhou, B. You and L. M. Wu, Langmuir, 2006, 22, 6403–6407 CrossRef CAS PubMed.
- I. Tissot, C. Novat, F. Lefebvre and E. Bourgeat-Lami, Macromolecules, 2001, 34, 5737–5739 CrossRef CAS.
- Z. Cao, L. Yang, Y. Yan, Y. Shang, Q. Ye, D. Qi, U. Ziener, G. Shan and K. Landfester, J. Colloid Interface Sci., 2013, 406, 139–147 CrossRef CAS PubMed.
- Z. Cao, L. Yang, Q. Ye, Q. Cui, D. Qi and U. Ziener, Langmuir, 2013, 29, 6509–6518 CrossRef CAS PubMed.
- Z. Cao and U. Ziener, Nanoscale, 2013, 5, 10093–10107 RSC.
- L. Han and S. N. Che, Chem. Soc. Rev., 2013, 42, 3740–3752 RSC.
- H. Zou, S. S. Wu, Q. P. Ran and J. Shen, J. Phys. Chem. C, 2008, 112, 11623–11629 CAS.
- S. B. Huang, X. J. Yu, Y. M. Dong, L. Li and X. H. Guo, Colloids Surf., A, 2012, 415, 22–30 CrossRef CAS.
- H. Han, L. Li, W. Wang, Y. Tian, Y. Wang, J. Wang, R. von Klitzing and X. Guo, Langmuir, 2017, 33(38), 9857–9865 CrossRef CAS PubMed.
- J. A. Balmer, O. O. Mykhaylyk, S. P. Armes, J. P. A. Fairclough, A. J. Ryan, J. Gummel, M. W. Murray, K. A. Murray and N. S. J. Wiliams, J. Am. Chem. Soc., 2011, 133, 826–837 CrossRef CAS PubMed.
- R. Grunder, G. Urban and M. Ballauff, Colloid Polym. Sci., 1993, 271, 563–572 CAS.
- M. Ballauff, J. Bolze, N. Dingenouts, P. Hickl and D. Pötschke, Macromol. Chem. Phys., 1996, 197, 3043–3066 CrossRef CAS.
- M. Ballauff, Adv. Eng. Mater., 2011, 13, 793–802 CrossRef CAS.
- N. Dingenouts, J. Bolze, D. Pötschke and M. Ballauff, in Polymer Latexes - Epoxide Resins - Polyampholytes, Springer Berlin Heidelberg, Berlin, Heidelberg, 1999, pp. 1–47, DOI:10.1007/3-540-68384-4_1.
- W. Wang, F. Chu, L. Li, H. Han, Y. Tian, Y. Wang, Z. Yuan, Z. Zhou and X. Guo, J. Polym. Sci., Part B: Polym. Phys., 2016, 54, 405–413 CrossRef CAS.
- S. Wang, K. Chen, Y. Xu, X. Yu, W. Wang, L. Li and X. Guo, Soft Matter, 2013, 9, 11276–11287 RSC.
- Y. Tian, L. Li, H. Han, W. Wang, Y. Wang, Z. Ye and X. Guo, Polymers, 2016, 8, 145 CrossRef.
- Q. de Robillard, X. Guo, M. Ballauff and T. Narayanan, Macromolecules, 2000, 33, 9109–9114 CrossRef CAS.
- X. Guo, A. Weiss and M. Ballauff, Macromolecules, 1999, 32, 6043–6046 CrossRef CAS.
- Z. Yan, C. Kaimin, W. Xiang and G. Xuhong, Nanotechnology, 2012, 23, 265601 CrossRef PubMed.
- X. Guo and M. Ballauff, Langmuir, 2000, 16, 8719–8726 CrossRef CAS.
- J. Zeng, F. Bian, J. Wang, X. Li, Y. Wang, F. Tian and P. Zhou, J. Synchrotron Radiat., 2017, 24, 509–520 CrossRef CAS PubMed.
- M. Ballauff, Macromol. Chem. Phys., 2003, 204, 220–234 CrossRef CAS.
- N. Dingenouts, C. Norhausen and M. Ballauff, Macromolecules, 1998, 31, 8912–8917 CrossRef CAS.
- S. Seelenmeyer, I. Deike, S. Rosenfeldt, C. Norhausen, N. Dingenouts, M. Ballauff, T. Narayanan and P. Lindner, J. Chem. Phys., 2001, 114, 10471–10478 CrossRef CAS.
- W. Wang, L. Li, K. Henzler, Y. Lu, J. Wang, H. Han, Y. Tian, Y. Wang, Z. Zhou, G. Lotze, T. Narayanan, M. Ballauff and X. Guo, Biomacromolecules, 2017, 18, 1574–1581 CrossRef CAS PubMed.
- W. Wang, L. Li, X. Yu, H. Han and X. Guo, J. Polym. Sci., Part B: Polym. Phys., 2014, 52, 1681–1688 CrossRef CAS.
- W. Wang, L. Li, H. Han, Y. Tian, Z. Zhou and X. Guo, Colloid Polym. Sci., 2015, 293, 2789–2798 CAS.
- S. Rosenfeldt, A. Wittemann, M. Ballauff, E. Breininger, J. Bolze and N. Dingenouts, Phys. Rev. E: Stat., Nonlinear, Soft Matter Phys., 2004, 70, 061403 CrossRef CAS PubMed.
- M. Ballauff, Prog. Polym. Sci., 2007, 32, 1135–1151 CrossRef CAS.
- K. Henzler, S. Rosenfeldt, A. Wittemann, L. Harnau, S. Finet, T. Narayanan and M. Ballauff, Phys. Rev. Lett., 2008, 100, 158301 CrossRef PubMed.
- N. Dingenouts, J. Bolze, D. Potschke and M. Ballauff, Polymer Latexes - Epoxide Resins - Polyampholytes, 1999, vol. 144, pp. 1–47 Search PubMed.
- M. Shibayama, Macromol. Chem. Phys., 1998, 199, 1–30 CrossRef CAS.
- F. Horkay, A. M. Hecht, S. Mallam, E. Geissler and A. R. Rennie, Macromolecules, 1991, 24, 2896–2902 CrossRef CAS.
- E. Geissler, F. Horkay and A.-M. Hecht, Phys. Rev. Lett., 1993, 71, 645–648 CrossRef CAS PubMed.
- M. Shibayama, T. Tanaka and C. C. Han, J. Chem. Phys., 1992, 97, 6829–6841 CrossRef CAS.
- K. M. Chen, Y. Zhu, L. Li, Y. Lu and X. H. Guo, Macromol. Rapid Commun., 2010, 31, 1440–1443 CrossRef CAS PubMed.
- K. Henzler, A. Wittemann, E. Breininger, M. Ballauff and S. Rosenfeldt, Biomacromolecules, 2007, 8, 3674–3681 CrossRef CAS PubMed.
- Y. Lu and M. Ballauff, Prog. Polym. Sci., 2016, 59, 86–104 CrossRef CAS.
- S. Backes, M. U. Witt, E. Roeben, L. Kuhrts, S. Aleed, A. M. Schmidt and R. von Klitzing, J. Phys. Chem. B, 2015, 119, 12129–12137 CrossRef CAS PubMed.
| This journal is © The Royal Society of Chemistry 2017 |

