 Open Access Article
Hydrogen inhibition in a wet aluminum dust collection system using dichromate solution
Yantong Wang,
Kaili Xu *,
Ben Wang and
Jinjia Zhang
College of Resource and Civil Engineering, Northeastern University, Shenyang, 110819, China. E-mail: kaili_xu65@126.com
First published on 11th October 2017
Abstract
Wet dust collection systems are used worldwide for aluminum dust treatment. However, these systems pose a risk of hydrogen fire and explosion because of the reaction between aluminum dust and water produce hydrogen. This study undertakes a field survey of the wet dust collection system in an atomized aluminum powder production enterprise in China. A hydrogen inhibition method (HIM) was proposed to inhibit hydrogen production. Hydrogen production inhibition tests were conducted using specialized equipment developed by the authors. The experimental data showed that the HIM effectively inhibited the reaction between aluminum and water. To study the changes in the aluminum particles before and after application of the HIM, scanning electron microscopy (SEM) was used to characterize the morphological changes in the aluminum powder. Energy-dispersive X-ray spectroscopy (EDS) revealed that Cr was evenly distributed around the aluminum particles, indicating that the inhibition film evenly covered these particles. X-ray photoelectron spectroscopy (XPS) was used to test the valence of Cr in the inhibition film, and X-ray diffraction (XRD) was used to analyze the chemical composition of the film after the HIM treatment. The results showed that Cr(OH)3 and Al(OH)3 were widely distributed in the inhibition film, confirming the effectiveness of the HIM. The reaction mechanism between the aluminum dust and dichromate solutions was discussed, and a chemical reaction kinetics model of the hydrogen production inhibition was established. The environmental issues regarding the use of dichromate solutions were discussed. Using HIM achieved the maximum reduction in the cost of the wet dust collection-system-and-in-the-hydrogen-fire-or-explosion-risk.
1 Introduction
Aluminum is the most abundant metal in the earth's crust and is the most widely used nonferrous metal.1 Aluminum powder has been widely used in many fields.2 When the concentration of released aluminum powder reaches the explosion limit and encounters an ignition source, an aluminum powder explosion can occur.3 Safe handling of aluminum powder requires not only a dust removal system but also adequate prevention and protection methods as well as an elevated risk awareness by the employees.4 Aluminum powder can be collected using either a wet or a dry dust collection system.5 Dry dust collection systems pose a risk of aluminum dust explosion accidents. On august 2, 2014, a catastrophic dust explosion occurred in a large industrial plant in Kunshan, China. The explosion killed 146 people, and the direct economic loss was 351 million yuan.3 In contrast, the risk of dust explosion is very low when using a wet dust collection system. However, the aluminum dust can react with water to produce hydrogen.6,7 A hydrogen explosion can also cause personal injury and damage to the factory.According to National Standard GB50058,8 to prevent a hydrogen explosion in a wet dust collector, prevention and protection devices should be installed on the wet dust collector. Adequate prevention and protection methods can greatly increase the manufacturing cost of the wet dust collection system, and these measures do not fundamentally solve the hydrogen explosion problem.
Chemical soaking in dichromate solution is commonly used as an anti-corrosion treatment for aluminum slabs,9–11 and a chromate conversion coating can form on the surface of the slab. This coating, which contains Cr6+, Cr3+ and Al3+, can prevent corrosion of the aluminum slab.12 The chromate conversion film protects the aluminum matrix against external corrosion,13–15 effectively functioning as an anti-corrosion coating. However, this method cannot be directly used for processing aluminum powder because the solution required for this method is acidic;13 the pH of the solution is usually adjusted to 1.69 using HNO3. Thus, the aluminum powder quickly reacts in this solution and produces a large amount of hydrogen gas. Numerous researchers have investigated methods to promote the reaction between aluminum powder and water16–19 because of the hydrogen production, which can be used as a clean energy source. The objectives of these studies differ from those of the present research; however, the reaction mechanism between aluminum powder and water is the same.20,21 Due to oxidation by atmospheric oxygen, an alumina film covers the surface of the aluminum particles. The first step of the reaction between aluminum particles and water is the hydration reaction of the alumina film; this reaction generates Al(OH)3, which subsequently reacts with the aluminum core of the particles to produce hydrogen gas.22 If the formation of the Al(OH)3 film can be prevented, then the hydration reaction can be effectively controlled, and the hydrogen production of the aluminum particles reaction with water can be suppressed.
Therefore, this work is based on the inherently safe approach of directly soaking aluminum dust in dichromate solution. The dichromate solution generates an inhibition film on the aluminum particles without any acidic substances; this improved method is referred to as the hydrogen inhibition method (HIM).
2 Experimental procedure
An atomized aluminum powder production enterprise was selected as the field research site. In this enterprise, a wet dust collection system is used to treat the aluminum dust released into the air. Hydrogen accumulation is a prerequisite for a hydrogen explosion in a wet dust collector. In this scenario, the internal pressure of the wet dust collector is equal to the atmospheric pressure.2.1 Equipment for the hydrogen inhibition experiment
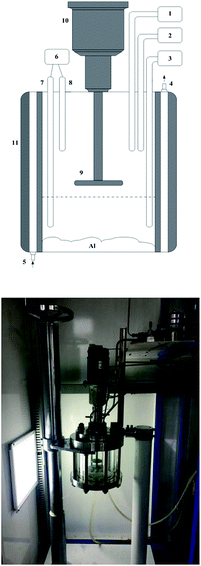
To systematically investigate the ability of the HIM to inhibit the reaction of aluminum with water, hydrogen inhibition experiments were performed in a laboratory. The inhibition effect was analyzed based on the change in hydrogen production.A set of experimental devices, as shown in Fig. 1, was designed to study the hydrogen production when aluminum powder reacted with water or with different concentrations of different types of dichromate solutions. The experiments were conducted in an airtight reactor. Before the start of the experiments, H2 was injected into the reactor at 500 kPa to perform an air tightness test. During this test, the temperature in the reactor was maintained at 50 °C. The air tightness test was conducted for 8 h, and at the end of the test, the pressure inside the reactor remained at 500 kPa. As the first step of the experiment, aluminum powder was placed onto the aluminum tray. The double-layer quartz glass reactor was closed, and a flow meter (DYSBG1111, Beijing Duo Yi Hui Yuan Technology Co., Ltd.) was used to control the volume of water or dichromate solution added to the reactor. Using a flow meter prevents errors caused by human factors. The reaction temperature was controlled by circulating water at a certain temperature between the two layers of quartz glass in the reactor. The temperature sensor (K-type, Yanzheng Co., Shanghai) detected the temperature of the solution and indicated when the temperature reached 50 °C, and the pressure sensor (3051, Rosemount Co., USA) simultaneously recorded the pressure in the reactor. The atmospheric pressure at the same location differed over time. Therefore, the initial pressure was set to 100 kPa, which is similar to the pressure inside a wet dust removal system when the fan stops working. If the pressure is higher than 100 kPa, then the vacuum pump (DAP-6D, 12 series, ULVAC KIKO, Inc.) will adjust the pressure inside the reactor to 100 kPa. If the pressure is lower than 100 kPa, then the positive pressure pump (FCY 2015, Chengdu Air Sea Electrical and Mechanical Manufacturing Co., Ltd.) will adjust the pressure inside the reactor to 100 kPa. Finally, the aluminum powder on the tray was evenly dispersed in the reactor liquid through motor rotation. The pressure sensor and temperature sensor recorded the pressure and temperature values in the reactor, respectively.
As the aluminum powder reacts with water to produce hydrogen, the volume V, the gas constant R and the gas temperature T in the reactor remain constant; these parameters are all components of the ideal gas equation, as shown in eqn (1). Therefore, the gas pressure P is proportional to the moles of hydrogen, n. The change in the moles of hydrogen can be characterized by the change in the reactor pressure.
| PV = nRT | (1) |
For the different groups of experiments, the hydrogen evolution α is used to represent the extent of the reaction, as shown in eqn (2):
 | (2) |
2.2 Characterization experiments
Scanning electron microscopy (SEM) (ULTRA PLUS, Zeiss Microscope Company, Germany) was used to characterize the appearance of the aluminum particles. The original aluminum particles and the aluminum particles reacted with different solutions were characterized. Energy-dispersive X-ray spectroscopy (EDS) was used to characterize the distribution of Cr in the film on the aluminum particles treated using the HIM. A laser diffraction analyzer (Microtrac s3500) was used to determine the size distribution of the aluminum powder.The surface films on the aluminum particles reacted with a 2.030 g L−1 K2Cr2O7 solution and a 2.010 g L−1 Na2Cr2O7·2H2O solution and were analyzed by X-ray photoelectron spectroscopy (XPS) (ESCALAB 250Xi). Non-monochromatic Al Kα X-ray radiation (hν = 1468.6 eV) was used for excitation; the aluminum twin anode was powered at 14 kV and 20 mA. The photoelectron take-off angle was 45°, and the base pressure was kept below 10–9 mbar. The spectrometer was calibrated relative to the C 1s peak at 284.8 eV, and the background intensity was subtracted from the spectra using the Shirley method. The values for the relevant core-level binding energies were obtained from curve fitting of the photoelectron emission lines using a symmetrical Gaussian–Lorentzian function. Two components were fitted for chromium: Cr(OH)3 (577.3 ± 0.2 eV)23–25 and Cr(VI) (580.0 eV).26
To better understand the phases of the reaction product, the aluminum powder samples reacted with 2.030 g L−1 K2Cr2O7 and 2.010 g L−1 Na2Cr2O7·2H2O solutions were characterized by X-ray diffraction (XRD) (MPDDY2094, PANalytical B.V.). The X-ray source, which had a copper cathode, was operated at approximately 40 kV and 40 mA. The samples were scanned over the 2θ interval between 5° and 90° at steps of 0.01° and at an angular speed of 0.02° s−1.
3 Results and discussion
3.1 Characterization of aluminium dust
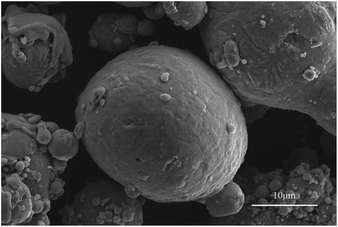
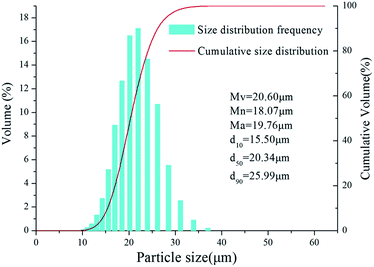
In the field survey, a wet dust collection system was used to collect the aluminum dust released into the workshop from a 20 μm aluminum powder production line. However, most of the released dust was suspended in water and could not be collected again for the hydrogen inhibition experiments. Therefore, the dust was directly collected from the dust suction hole of the wet dust collector. Fig. 2 presents an SEM image of the aluminum dust, showing that the surface of the aluminum dust is smooth and compact. The aluminum dust particles produced by atomization are basically spherical. Fig. 3 shows the results of the particle size analysis. The size and volumetric distributions of the particles were determined using a laser diffraction analyzer and were characterized using d10, d50, d90, Mn, Mv and Ma, which are also presented in Fig. 3. Most of the particles are concentrated at a size of approximately 20 μm.3.2 Inhibition experiments for hydrogen production
The hydrogen production inhibition experiments were divided into two groups, as shown in Table 1. According to the research of Gai et al.,19 when the temperature is the only variable in the experiment, hydrogen production increases with increasing temperature. If the HIM proposed in this work can effectively inhibit the reaction of aluminum with water at high temperatures, then the inhibitory effect can also be performed at a lower temperature. The temperature of the water inside the wet dust collector was between 20 °C and 25 °C. Therefore, the reaction temperature was set at 50 °C, which is much higher than the temperature of the water inside the wet dust collection system. The initial reaction pressure was set to 100 kPa. Dichromate samples of different masses were weighed separately using an electronic balance to prepare dichromate solutions with different concentrations.| Test no. | Mass of aluminum powder for the experiment g | Experimental temperature °C | Volume of liquid in the reactor mL | Initial reaction pressure kPa | Reaction liquid concentration g L−1 | ||||
|---|---|---|---|---|---|---|---|---|---|
| K2Cr2O7 solution | |||||||||
| 1 | 2 | 50 | 200 | 100 | 0.052 | 0.105 | 0.148 | 0.498 | 2.030 |
![[thin space (1/6-em)]](https://www.rsc.org/images/entities/char_2009.gif) |
|||||||||
| Na2Cr2O7·2H2O solution | |||||||||
| 2 | 2 | 50 | 200 | 100 | 0.051 | 0.101 | 0.151 | 0.221 | 2.01 |
Fig. 4 shows the hydrogen evolution curves of the reaction of aluminum dust with the K2Cr2O7 solutions and water. When the concentration of the K2Cr2O7 solution was less than or equal to 0.148 g L−1, hydrogen evolution began. When the reaction had proceeded for 5 h, the hydrogen evolution α was much higher than 0.2, which is higher than the aluminium reaction with water, indicating that a K2Cr2O7 solution with a concentration of 0.148 g L−1 or less cannot inhibit hydrogen generation. However, as the concentration of the K2Cr2O7 solution increased, the hydrogen evolution α gradually decreased. When the concentration of the K2Cr2O7 solution was greater than or equal to 0.498 g L−1, almost no hydrogen was produced, and the hydrogen evolution α approached 0, indicating that hydrogen production was inhibited.
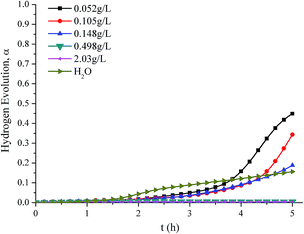 | ||
| Fig. 4 Hydrogen production curves of aluminum powder reacted with K2Cr2O7 solutions of various concentrations and water. | ||
Fig. 5 shows the hydrogen evolution curves of aluminum dust reacted with Na2Cr2O7·2H2O solutions and water. When the concentration of the Na2Cr2O7·2H2O solution was 0.051 g L−1, the hydrogen evolution α approached 0.6, indicating that this solution concentration cannot inhibit hydrogen production. When the concentration of the Na2Cr2O7·2H2O solution was less than or equal to 0.151 g L−1, α was higher than that when the aluminium reacted with water, indicating that the reaction between aluminum and water was not inhibited. However, the hydrogen evolution α decreased with increasing concentration of Na2Cr2O7·2H2O. When the concentration of the Na2Cr2O7·2H2O solution was greater than or equal to 0.221 g L−1, almost no hydrogen was produced, and the hydrogen evolution α was close to 0, indicating that the reaction between aluminum and water was effectively inhibited.
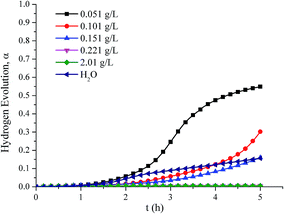 | ||
| Fig. 5 Hydrogen production curves of aluminum powder reacted with Na2Cr2O7·2H2O solutions of various concentrations and water. | ||
3.3 SEM-EDS
SEM and EDS were used to characterize the aluminum particles and the distribution of Cr in the film generated on these particles. For the experiments in which aluminum particles reacted with dichromate solutions to produce hydrogen, two aluminum dust samples were selected: (a) aluminum dust after reaction with a 0.105 g L−1 K2Cr2O7 solution and (b) aluminum dust after reaction with a 0.101 g L−1 Na2Cr2O7·2H2O solution. The SEM and EDS results for these two samples are shown in Fig. 6 and 7. As shown in Fig. 2, the surfaces of the original aluminum dust particles are smooth and compact. However, Fig. 6 and 7 show that the surface of the aluminum dust particles became very rough after reaction with the dichromate solutions. The appearance of the aluminum particles changed, and the hydrogen evolution α curves shown in Fig. 4 and 5 indicate that the hydrogen production reaction occurred. The EDS results in Fig. 6 and 7 show no obvious relationship between the Cr distribution and the aluminum particles.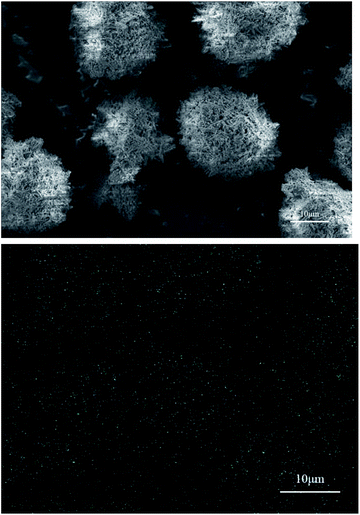 | ||
| Fig. 6 SEM image and EDS Cr mapping image of the aluminum particles after reaction with the 0.105 g L−1 K2Cr2O7 solution. | ||
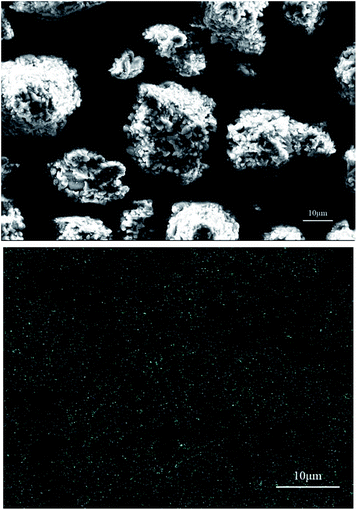 | ||
| Fig. 7 SEM and the EDS Cr mapping image of the aluminum particles after reaction with the 0.101 g L−1 Na2Cr2O7·2H2O solution. | ||
The hydrogen production reaction was inhibited in the sample with the 2.030 g L−1 K2Cr2O7 solution. The SEM image in Fig. 8 shows that the surface of the aluminum dust particles was smooth and compact. Furthermore, the EDS Cr mapping image in Fig. 8 shows that Cr was evenly distributed on the surface of the aluminum particles. In contrast to the EDS images in Fig. 6 and 8, the inhibition reaction occurred on the surface of the aluminum particles. The Cr content was higher on the aluminum particles reacted with the 2.030 g L−1 K2Cr2O7 solution than that on the aluminum particles reacted with the 0.105 g L−1 K2Cr2O7 solution. Thus, a Cr-rich film was formed for this sample and inhibited the reaction between the aluminum particles and water.
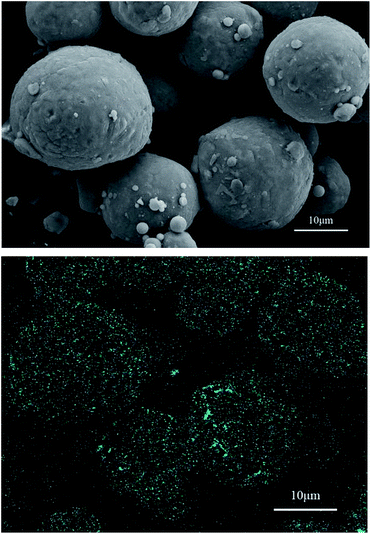 | ||
| Fig. 8 SEM image and EDS Cr mapping image of the aluminum particles after reaction with the 2.030 g L−1 K2Cr2O7 solution. | ||
Fig. 9 shows the surface morphology and Cr distribution of the particles after reaction with the 2.010 g L−1 Na2Cr2O7·2H2O solution. The results are similar to those shown in Fig. 8, and Cr was evenly distributed on the surface of the aluminum particles. In contrast to the EDS results in Fig. 7 and 9, an inhibition film containing uniform Cr formed on the aluminum particles, and the Cr content was highest on the aluminum particles. Furthermore, the Cr content of the aluminium particles that reacted with the 2.010 g L−1 Na2Cr2O7·2H2O solution was greater than the Cr content on the particles reacted with the 0.101 g L−1 Na2Cr2O7·2H2O solution.
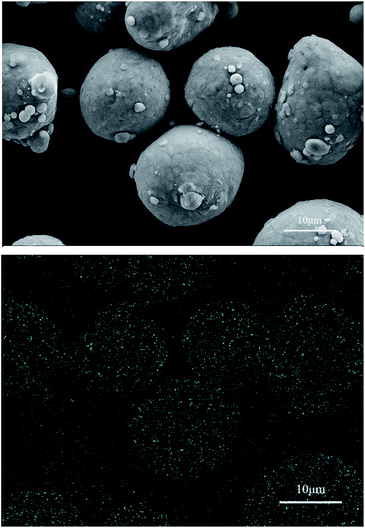 | ||
| Fig. 9 SEM image and EDS Cr mapping image of the aluminum particles reacted with the 2.010 g L−1 Na2Cr2O7·2H2O solution. | ||
When the concentrations of the K2Cr2O7 and Na2Cr2O7·2H2O solutions reached 2.030 g L−1 and 2.010 g L−1, respectively, a uniform inhibition film containing Cr was generated. The inhibition film could inhibit the hydrogen production reaction between the aluminum particles and water.
3.4 XPS
XPS provides information on the valence of Cr in the inhibition film. Fig. 10 and 11 show the XPS results of the aluminum dust reacted with the 2.030 g L−1 K2Cr2O7 solution and 2.010 g L−1 Na2Cr2O7·2H2O solution, respectively. Fig. 10 shows two peaks: the Cr 2p1/2 peak and the Cr 2p3/2 peak. The Cr 2p3/2 peak is composed of two peaks. For the aluminum particle surface, the peak that occurs at a binding energy of 580.0 eV (ref. 27) is attributed to Cr(VI), and the peak with a binding energy of 577.24 eV (ref. 23–25) is attributed to Cr(OH)3. The fitting results suggest that approximately 75.03% of the Cr was in the form of Cr(OH)3 and that 24.97% was in the form of Cr(VI). Fig. 11 shows the valence information for Cr on the surface of the aluminum particles after reaction with the 2.010 g L−1 Na2Cr2O7·2H2O solution. The peak with a binding energy of 580.0 eV (ref. 27) is attributed to Cr(VI), and the peak with a binding energy of 577.13 eV (ref. 23–25) is attributed to Cr(OH)3. The fitting results suggest that 67.50% of the Cr was in the form of Cr(OH)3 and that 32.50% was in the form of Cr(VI). The XPS results are similar for aluminum powder reacted with the 2.030 g L−1 K2Cr2O7 solution and 2.010 g L−1 Na2Cr2O7·2H2O solution.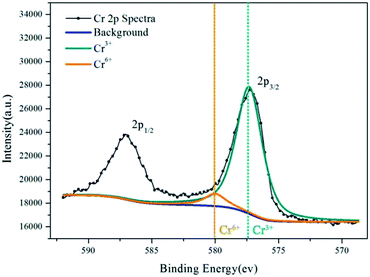 | ||
| Fig. 10 Cr 2p spectra for the inhibition film on aluminum powder reacted with the 2.030 g L−1 K2Cr2O7 solution. | ||
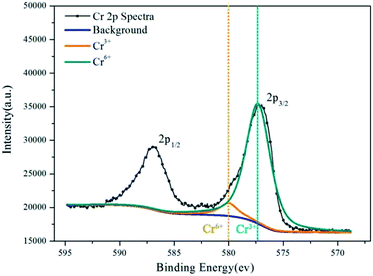 | ||
| Fig. 11 Cr 2p spectra for the inhibition film on aluminum powder reacted with the 2.010 g L−1 Na2Cr2O7·2H2O solution. | ||
The XPS results show that after the aluminum particles reacted with the dichromate solution, Cr3+ and Cr6+ covered the surface of the aluminum particles. According to the literature,23–25 a peak at a binding energy of 577.3 ± 0.2 eV is attributed to Cr(OH)3. The XPS results show that the binding energies associated with the fitting peaks are 577.24 eV and 577.13 eV for the aluminum particles reacted with the 2.030 g L−1 K2Cr2O7 solution and the 2.010 g L−1 Na2Cr2O7·2H2O solution, respectively. In addition, the proportion of Cr(OH)3 is much greater than that of Cr6+.
3.5 XRD
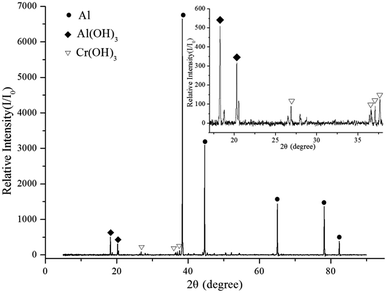
XRD was used to determine the phases present in the reaction products. Fig. 12 shows that Cr(OH)3 and Al(OH)3 were generated after the aluminum dust was reacted with the 2.030 g L−1 K2Cr2O7 solution. Fig. 13 shows that the reaction of aluminum dust with the 2.010 g L−1 Na2Cr2O7·2H2O solution resulted in the formation of Cr(OH)3 and Al(OH)3. Because the Cr(OH)3 and Al(OH)3 covered only the surface of the aluminum particles and because the chemical reactions produced very little Cr(OH)3 and Al(OH)3, the peaks of Cr(OH)3 and Al(OH)3 in the XRD patterns are weak. The main component of the aluminum particles is the aluminum core, which generates strong metallic Al peaks.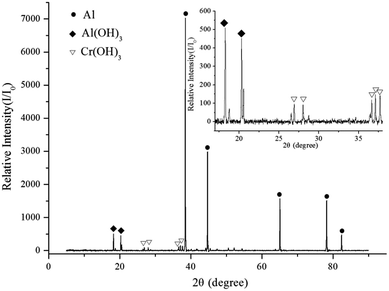 | ||
| Fig. 13 XRD pattern of the aluminum particles after reaction with the 2.010 g L−1 Na2Cr2O7·2H2O solution. | ||
The XPS and XRD results show that the inhibition film that formed on the surface of the aluminum dust particles contained Cr(OH)3 and Al(OH)3. Therefore, the inhibition film can effectively inhibit the reaction of aluminum dust particles with water. This Cr(OH)3 film separates the aluminum core from the water and prevents the transport of water molecules to the aluminum core.
4 The reaction mechanism
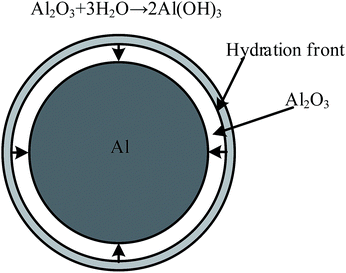
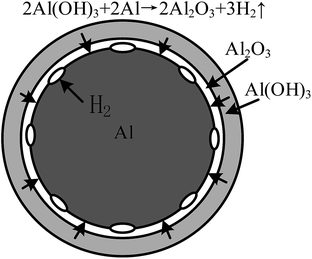
Previous studies have focused on promoting the reaction between aluminum and water to produce hydrogen as an energy source.28–31 As mentioned earlier, the purpose of this study differs from that of the previous papers, but the reaction mechanism of aluminum with water is the same. The previous studies stated that the reaction of aluminum dust with the oxygen in air forms a protective film of alumina around the external surface of the aluminum particles. This film prevents further reactions between the aluminum particles and water.6 However, with increasing immersion time, the alumina protective film gradually begins to react with water and form aluminum hydrate.32 As schematically shown in Fig. 14,33 the thickness of the film at this stage does not change until the entire oxide film is hydrated to form an Al(OH)3 film. This phenomenon explains the formation of Al(OH)3 observed in the XRD patterns. Fig. 15 shows that the Al(OH)3 film reacts with the aluminum core to regenerate the alumina and water molecules, which react with the aluminum core to produce hydrogen. Through the internal diffusion of the Al(OH)3 film, water molecules outside the Al(OH)3 film can also move to the aluminum core.6,33As shown in Fig. 15, ellipsoidal hydrogen bubbles are uniformly arranged around the aluminum core under the Al(OH)3 film. As hydrogen accumulates, the Al(OH)3 film experiences increasing tension. When the tension exceeds the critical tension of the Al(OH)3 film, the film ruptures, and hydrogen is released.32 Then, the exposed aluminum core directly reacts with water, and the reaction shown in eqn (3) occurs more rapidly:19,32
| 2Al + 6H2O → 2Al(OH)3 + 3H2↑ | (3) |
To inhibit the reaction between aluminum particles and water, the formation of Al(OH)3 should be inhibited first. According to Barrera-Díaz et al.,34 the Cr(VI) species in solution are likely to be Cr2O72−, CrO42−, H2CrO4 and HCrO4−, and their relative distribution depends on the solution pH, the Cr(VI) concentration and the redox potential. However, if the most prevalent species in the aqueous solution is CrO42−, then the reaction shown in eqn (4) may occur.35 In this case, the generated Cr(OH)3 (eqn (4)) will cover the aluminum particles.
| CrO42− + 5H+ + 3e ⇔ Cr(OH)3 + H2O | (4) |
| Cr3+ + 3OH− ⇔ Cr(OH)3 | (5) |
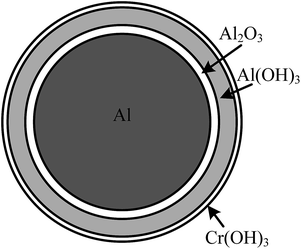
The reaction in eqn (4) consumes H+ in the solution. Because of the hydration reaction of Al2O3, Al(OH)3 is formed around the aluminum particles, which exhibits certain adsorption characteristics. The large amount of OH− around the surface of the aluminum particles results in hydroxylation of the surface. Therefore, Cr3+ is more easily adsorbed onto the surface of the aluminum particles, as shown in eqn (5), and can also generate Cr(OH)3 as a precipitate around the aluminum particles. This phenomenon explains why the EDS images in Fig. 8 and 9 show an even distribution of Cr on the inhibition film, indicating that the film formed around the aluminum particles is highly uniform, as shown in Fig. 16. As shown by the XPS results in Fig. 10 and 11, the aluminum particles still contain Cr6+ because the main components of the inhibition film are Al(OH)3 and Cr(OH)3, which can absorb some CrO42−. However, the adsorption capacity is so small that it is not detected in the XRD results. The Cr(OH)3 layer separates the aluminum core from the water, inhibiting the hydrogen production reaction. However, when the concentration of dichromate ions in the solutions is low, the reaction of the aluminum particles with water continues. Only when the concentration of the dichromate solution is high can an inhibition film be formed in a relatively short time to inhibit the reaction of aluminum with water.
5 Chemical kinetic model for the inhibition of hydrogen production
According to a study by the US Department of Energy,36 the chemical kinetic model for the reaction between aluminum powder and water conforms to a shrinking core model. Furthermore, Gai et al.19 validated the application of the shrinking core model for the reaction of aluminum powder with water. Soler et al.37 studied the reaction of aluminum powder in Na2SnO3 solution and established the kinetic model of the chemical reaction by applying the shrinking core model. In this study, the hydrogen production curves for the reaction of aluminum powder with different concentrations of dichromate solution were fitted using the shrinking core model. Thus, the chemical kinetic model for the inhibition of hydrogen production using dichromate solution was established. When aluminum particles were immersed in a dichromate solution at a high concentration, a new film that contained evenly distributed Cr was formed. This film prevented the transport of water molecules to the aluminum core, and the reaction was controlled by the surface chemical reaction. The reaction rate equation is given in eqn (6):| 1 − (1 − α)1/3 = kt | (6) |
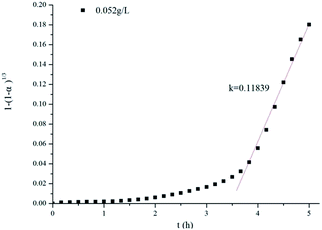
The curve corresponding to the reaction of aluminum powder with the 0.052 g L−1 K2Cr2O7 solution was selected as an example for curve fitting, and the fitting results are shown in Fig. 17. The reaction rate of the aluminum particles in the dichromate solution was confirmed to be controlled by the surface chemical reaction. These results are consistent with those of the shrinking core model. The chemical reaction rate constant k was calculated as 0.11839. In addition, the hydrogen production data for the reaction of different concentrations of K2Cr2O7 and Na2Cr2O7·2H2O solutions with aluminum powder were fitted. When the concentration of the solution was too high, the rate constant k was 0, indicating that the reaction between aluminum and water was suppressed. The values of the rate constant k for different experiments are shown in Table 2.
| K2Cr2O7 solution | Na2Cr2O7·2H2O solution | ||
|---|---|---|---|
| Concentration g L−1 | k h−1 | Concentration g L−1 | k h−1 |
| 0.052 | 0.11839 | 0.051 | 0.10588 |
| 0.105 | 0.10114 | 0.101 | 0.06603 |
| 0.148 | 0.02763 | 0.151 | 0.0241 |
| 0.498 | 0 | 0.221 | 0 |
| 2.03 | 0 | 2.01 | 0 |
When aluminum particles react with the K2Cr2O7 solution, the reaction constant gradually decreases with increasing solution concentration. Table 2 shows that when aluminum particles react with the 0.052 g L−1 K2Cr2O7 solution, the rate constant is 0.11839. However, when the concentration of the K2Cr2O7 solution increases to 0.148 g L−1, the rate constant is 0.02763. When the concentration of the K2Cr2O7 solution is equal to or greater than 0.498 g L−1, the rate constant is 0, indicating that the hydrogen production reaction is inhibited. Thus, the fitting results of the shrinking core model are consistent with the experimental results shown in Fig. 4. When the aluminum particles react with the Na2Cr2O7·2H2O solution, the experimental results are also consistent with the shrinking core model, suggesting that this model can be used to explain the chemical kinetics of the inhibited reaction between aluminum particles and dichromate solutions.
6 Environmental protection
Hexavalent chromium ions are highly toxic to living organisms and are a source of environmental pollution.38–42 Therefore, these ions must be removed from the solution before being discharged into the environment. Many studies have been performed on the removal of hexavalent chromium ions from water,43–48 and many physico-chemical methods have been proposed, including precipitation, ion exchange, oxidation–reduction, electrochemical treatment, filtration, membrane filtration and adsorption.38,49 One of the most convenient and effective methods of treating hexavalent chromium ions is to reduce Cr(VI) to Cr(III), which forms hydroxides with OH− and precipitates.50 Chemical reductants such as ferrous salt, sulfite and thiosulfate have been used for the conversion of Cr(VI) to Cr(III).40,51,52 According to the field survey in the present study, during the maintenance process of wet dust collectors, the dichromate solution and precipitated aluminum dust should be removed outside the dust collector separately. The aluminum dust is collected and transported to the metal plant for recycling, and the dichromate solution is transported to the wastewater treatment plant. As mentioned in Section 4 and according to Jingjian Pan,40 Cr(VI) is reduced to Cr(III), as shown in eqn (7). Then, Cr3+ reacts with OH− to produce the Cr(OH)3 precipitate, as shown in eqn (5). Cr3+ can also react with Fe3+ and water, according to the reaction shown in eqn (8).53 Compared with the substantial economic loss when hydrogen explosion accidents occur and the high economic input required to install prevention and protection devices in dust collection systems, the cost to treat dichromate solutions is low. According to the research mentioned above and the field survey of the aluminum powder production operation, K2Cr2O7 and Na2Cr2O7·2H2O can be removed from the effluents to attain the industrial effluent standard before being discharged into the environment.| CrO42− + 3Fe2+ + 8H+ → Cr3+ + 3Fe3+ + 4H2O | (7) |
| xCr3+ + (1 − x)Fe3+ + H2O → CrxFe(1−x)(OH)3↓ + 3H+ | (8) |
7 Conclusions
In wet dust collection systems used to treat aluminum dust, hydrogen is produced, which poses a risk for hydrogen fire and explosion. Based on the theory of inherent safety, we proposed the HIM to inhibit hydrogen production using K2Cr2O7 or Na2Cr2O7·2H2O solutions. The inhibition mechanism was discussed in detail, and a chemical kinetic model based on the shrinking core model was established. Implementing the HIM can reduce the risk of hydrogen fire and explosion and eliminate the need to install prevention and protection devices in a wet dust collection system. The environmental protection were discussed, and the HIM was shown to save considerable costs while creating a positive social image for the industry.Conflicts of interest
There are no conflicts to declare.Acknowledgements
We would like to express our gratitude to the editor and the reviewers for the suggestions and comments, which helped to improve the quality of this paper.References
- Y. Zhang, M. Sun, J. Hong, X. Han, J. He, W. Shi and X. Li, J. Cleaner Prod., 2016, 133, 1242–1251 CrossRef CAS.
- N. F. P. A., in Standard for Combustible Metals (NFPA 484), National Fire Protection Association, MA, 2015 Search PubMed.
- G. Li, H. X. Yang, C. M. Yuan and R. K. Eckhoff, J. Loss Prev. Process Ind., 2016, 39, 121–130 CrossRef CAS.
- Q. Li, K. Wang, Y. Zheng, X. Mei and B. Lin, Powder Technol., 2016, 301, 1299–1308 CrossRef CAS.
- T. J. Myers, J. Hazard. Mater., 2008, 159, 72–80 CrossRef CAS PubMed.
- Z.-Y. Deng, Y.-B. Tang, L.-L. Zhu, Y. Sakka and J. Ye, Int. J. Hydrogen Energy, 2010, 35, 9561–9568 CrossRef CAS.
- Z. Y. Deng, J. M. F. Ferreira and S. Yoshio, J. Am. Ceram. Soc., 2008, 91, 3825–3834 CrossRef CAS.
- China MoHaURDotPsRo, in Code for design of electrical apparatus for explosion hazard environments (GB50058), Ministry of Housing and Urban-Rural Development of the People's Republic of China, Beijing, 2014.
- J. H. Osborne, Prog. Org. Coat., 2001, 41, 280–286 CrossRef CAS.
- Z. Szklarska-Smialowska, Corros. Sci., 1999, 41, 1743–1767 CrossRef CAS.
- M. Kendig, S. Jeanjaquet, R. Addison and J. Waldrop, Surf. Coat. Technol., 2001, 140, 58–66 CrossRef CAS.
- F. W. Lytle, R. B. Greegor, G. L. Bibbins, K. Y. Blohowiak, R. E. Smith and G. D. Tuss, Corros. Sci., 1995, 37, 349–369 CrossRef CAS.
- J. Zhao, L. Xia, A. Sehgal, D. Lu, R. L. McCreery and G. S. Frankel, Surf. Coat. Technol., 2001, 140, 51–57 CrossRef CAS.
- O. Lunder, J. C. Walmsley, P. Mack and K. Nisancioglu, Corros. Sci., 2005, 47, 1604–1624 CrossRef CAS.
- R. Grilli, M. A. Baker, J. E. Castle, B. Dunn and J. F. Watts, Corros. Sci., 2011, 53, 1214–1223 CrossRef CAS.
- H. Z. Wang, D. Y. C. Leung, M. K. H. Leung and M. Ni, Renewable Sustainable Energy Rev., 2009, 13, 845–853 CrossRef CAS.
- K. Mahmoodi and B. Alinejad, Int. J. Hydrogen Energy, 2010, 35, 5227–5232 CrossRef CAS.
- S. S. Razavi-Tousi and J. A. Szpunar, Electrochim. Acta, 2014, 127, 95–105 CrossRef CAS.
- W.-Z. Gai, W.-H. Liu, Z.-Y. Deng and J.-G. Zhou, Int. J. Hydrogen Energy, 2012, 37, 13132–13140 CrossRef CAS.
- Y. Cao, J. Guo, K. Hu, L. Xie and B. Li, Int. J. Hydrogen Energy, 2017, 42, 10547–10554 CrossRef CAS.
- D. Li, Q. Zhang, Q. Ma and S. Shen, Int. J. Hydrogen Energy, 2015, 40, 8761–8768 CrossRef CAS.
- Z. Y. Deng, W. H. Liu, W. Z. Gai, Y. Sakka, J. Ye and Z. W. Ou, J. Am. Ceram. Soc., 2010, 93, 2534–2536 CrossRef CAS.
- A. E. Hughes, R. J. Taylor and B. R. W. Hinton, Surf. Interface Anal., 1998, 25, 223–234 CrossRef.
- J. O. Nilsson, S. E. Hörnström, E. Hedlund, H. Klang and K. Uvdal, Surf. Interface Anal., 2004, 19, 379–385 CrossRef.
- X. Zhang, W. Sloof, A. Hovestad, E. Van Westing, H. Terryn and J. De Wit, Surf. Coat. Technol., 2005, 197, 168–176 CrossRef CAS.
- C. D. Wagner, W. M. Riggs, L. E. Davis, J. F. Moulder and G. E. Muilenberg, Handbook of X-Ray Photoelectron Spectroscopy, Perkin-Elmer Corp, Minnesota, 1978 Search PubMed.
- R. Ramanauskas, L. Gudaviciute, L. Diaz-Ballote, P. Bartolo-Perez and P. Quintana, Surf. Coat. Technol., 2001, 140, 109–115 CrossRef CAS.
- E. Czech and T. Troczynski, Int. J. Hydrogen Energy, 2010, 35, 1029–1037 CrossRef CAS.
- S. S. Razavi-Tousi and J. A. Szpunar, Int. J. Hydrogen Energy, 2013, 38, 795–806 CrossRef CAS.
- S. Elitzur, V. Rosenband and A. Gany, Int. J. Hydrogen Energy, 2014, 39, 6328–6334 CrossRef CAS.
- X. Chen, Z. Zhao, M. Hao and D. Wang, J. Power Sources, 2013, 222, 188–195 CrossRef CAS.
- W.-Z. Gai and Z.-Y. Deng, Int. J. Hydrogen Energy, 2014, 39, 13491–13497 CrossRef CAS.
- Z. Y. Deng, J. M. F. Ferreira, T. Yoshihisa and J. Ye, J. Am. Ceram. Soc., 2007, 90, 1521–1526 CrossRef CAS.
- C. E. Barrera-Díaz, V. Lugo-Lugo and B. Bilyeu, J. Hazard. Mater., 2012, 223, 1–12 CrossRef PubMed.
- H.-x. You, H.-b. Xu, Y. Zhang, S.-l. Zheng and Y.-y. Gao, Trans. Nonferrous Met. Soc. China, 2010, 20, s26–s31 CrossRef CAS.
- J. Petrovic and G. Thomas, Reaction of Aluminum with Water to Produce Hydrogen, 2008, http://www1.eere.energy.gov/hydrogenandfuelcells/pdfs/aluminium_water_hydrogen.pdf.
- L. Soler, A. M. Candela, J. Macanás, M. Muñoz and J. Casado, Int. J. Hydrogen Energy, 2010, 35, 1038–1048 CrossRef CAS.
- A. B. Pérez Marín, M. I. Aguilar, V. F. Meseguer, J. F. Ortuño, J. Sáez and M. Lloréns, Chem. Eng. J., 2009, 155, 199–206 CrossRef.
- M. Gheju and I. Balcu, J. Hazard. Mater., 2010, 182, 484–493 CrossRef CAS PubMed.
- J.-j. Pan, J. Jiang and R.-k. Xu, Chemosphere, 2014, 101, 71–76 CrossRef CAS PubMed.
- T. S. Kassem, Desalination, 2010, 258, 206–218 CrossRef CAS.
- N. M. Dogan, C. Kantar, S. Gulcan, C. J. Dodge, B. C. Yilmaz and M. A. Mazmanci, Environ. Sci. Technol., 2011, 45, 2278–2285 CrossRef CAS PubMed.
- J. Hu, G. Chen and I. M. C. Lo, Water Res., 2005, 39, 4528–4536 CrossRef CAS PubMed.
- C. Noubactep and S. Caré, J. Hazard. Mater., 2010, 182, 923–927 CrossRef CAS PubMed.
- J. Hu, I. M. C. Lo and G. Chen, Sep. Purif. Technol., 2007, 56, 249–256 CrossRef CAS.
- V. Lugo-Lugo, C. Barrera-Díaz, B. Bilyeu, P. Balderas-Hernández, F. Ureña-Nuñez and V. Sánchez-Mendieta, J. Hazard. Mater., 2010, 176, 418–425 CrossRef CAS PubMed.
- J. Ye, H. Yin, B. Mai, H. Peng, H. Qin, B. He and N. Zhang, Bioresour. Technol., 2010, 101, 3893–3902 CrossRef CAS PubMed.
- J. W. Lee, D. K. Cha, Y. K. Oh, K. B. Ko and S. H. Jin, J. Hazard. Mater., 2010, 180, 354–360 CrossRef CAS PubMed.
- X. Jin, M. Jiang, J. Du and Z. Chen, J. Ind. Eng. Chem., 2014, 20, 3025–3032 CrossRef CAS.
- C. Han, Y. Jiao, Q. Wu, W. Yang, H. Yang and X. Xue, J. Environ. Sci., 2016, 46, 63–71 CrossRef PubMed.
- T. A. Kurniawan, G. Y. S. Chan, W.-H. Lo and S. Babel, Chem. Eng. J., 2006, 118, 83–98 CrossRef CAS.
- G. Qin, M. J. McGuire, N. K. Blute, C. Seidel and L. Fong, Environ. Sci. Technol., 2005, 39, 6321–6327 CrossRef CAS PubMed.
- Y. Dai, Y. Hu, B. Jiang, J. Zou, G. Tian and H. Fu, J. Hazard. Mater., 2016, 309, 249–258 CrossRef CAS PubMed.
| This journal is © The Royal Society of Chemistry 2017 |

