 Open Access Article
Trace determination of chlorpheniramine in human plasma using magnetic dispersive solid-phase extraction based on a graphene oxide/Fe3O4@polythionine nanocomposite combined with high-performance liquid chromatography
Maryam Ahmadi Daryakenary and
Mohsen Zeeb *
*
Department of Applied Chemistry, Faculty of Science, Islamic Azad University South Tehran Branch, P. O. Box 1777613651, Tehran, Iran. E-mail: zeeb.mohsen@gmail.com; Fax: +98 26 36558524; Tel: +98 26 36558524
First published on 17th November 2017
Abstract
Graphene oxide/Fe3O4@polythionine (GO/Fe3O4@PTh) nanocomposite was fabricated as a new and promising sorbent for magnetic dispersive solid-phase extraction (MDSPE) and high-performance liquid chromatography-ultraviolent detection (HPLC) of chlorpheniramine in human plasma. To fabricate the sorbent, thionine was polymerized on the surface of magnetic GO via an oxidative polymerization in order to produce polythionine as a surface modifier and obtain reasonable extraction yield. The characteristics of the sorbent were studied with transmission electron microscopy (TEM), scanning electron microscopy (SEM), X-ray diffraction (XRD), energy-dispersive X-ray analysis (EDX), vibrating sample magnetometry (VSM) and Fourier transform-infrared (FT-IR) spectroscopy. The calibration curve revealed linearity in the range of 2.0–550.0 ng mL−1 with a regression coefficient corresponding to 0.995. Limits of detection (LOD, S/N = 3) and quantification (LOQ, S/N = 10) were 0.4 and 2.0 ng mL−1, respectively. A desired recovery range of 87.9–96.4% and acceptable intra-day (4.1–5.0%) and inter-day (4.9–5.6%) precision as well as remarkable sample clean up showed the good efficiency of the method. To investigate the practical suitability of the proposed method, it was applied for the determination of chlorpheniramine in human plasma after oral administration of the drug while some pharmacokinetic data were achieved. This technique proved to be reliable and green for screening purposes.
1. Introduction
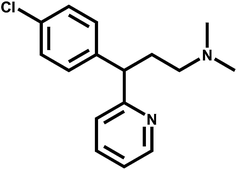
Chlorpheniramine (Fig. 1) reduces the influence of histamine on capillary permeability and bronchial smooth muscles.1 This drug is classified as an anti-allergic agent and it is generally used to treat symptoms of an allergy, hay fever, cold rashes, sinus inflammation, watery eyes, itchy eyes, coughs, runny nose, sneezing and also it is used for itching due to chicken pox.2 Chlorpheniramine binds to the H1 histamine receptor, blocking the histamine activity and resulting in the relief of the negative symptoms.3In a literature survey, different analytical methods including high-performance liquid chromatography,4,5 electrophoresis,6 liquid chromatography-tandem mass spectrometry (LC-MS-MS),7,8 and spectrophotometric methods9 have been introduced for the determination of chlorpheniramine. Due to the low concentration of chlorpheniramine in human plasma, matrix effects and the importance of phramacokinetic study, there is an increasing need to develop sensitive and accurate methods for trace monitoring of the drug in biological media. Modern outlooks in sample preparation are extremely focused on enhancing the quality of analytical results and the introduction of novel technological developments including simplification, miniaturization and automation of the entire analytical procedure.10,11 The goals of the recent challenge are to isolate, concentrate and make it compatible with analytical instruments.12–14 Lately, the development of new sample preparation methods has been focused on some notable goals such as miniaturization, automation, high extraction yield, on-line coupling with analytical tool, cost-effective performance along with reduction or removal of toxic extraction solvents.15–17 The extraction techniques, which are commonly used to enrich and determine drugs concentration, are liquid–liquid extraction (LLE) and solid-phase extraction (SPE). But in LLE, large usage of toxic organic solvents is usually required and this traditional extraction method is time-consuming and expensive.18 Whereas, SPE offers practical advantages such as good extraction performance, low consumption of hazardous solvents, and simplicity of operation.19 Lately, many efforts have been focused on the construction of novel and efficient extraction sorbents providing reasonable analyte enrichment, desired dispersible characteristic and anti-interference capability.20
The magnetic solid-phase extraction (MSPE) has recently obtained considerable attention due to its numerous virtues such as high surface area, magnetic irretrievability, operational simplicity, high extraction efficiency and ability to selective functionalization of materials.21 In recent years, some methods have reported on the application MSPE for screening purposes in different media including food, biological and environmental samples.22 Sample preparation methods based on magnetic nanocomposite materials provide sustainable advantages such as a high surface area-to-volume ratio, high extraction speed and simplicity of sorbent isolation from sample matrices by applying an external magnetic field.23 One of the most important aspects of this issue is the kind of magnetic sorbent, which affects on affinity, selectivity and extraction efficiency. So, introducing new types of sorbents to obtain better extraction appearance for trace screening purposes has been become an important research area.24
Graphene oxide (GO), the functionalized graphene with oxygen-containing chemical groups, with novel properties such as high electrical conductivity as well as exceptional mechanical and optical properties has attracted tremendous attention from both the experimental and theoretical scientific communities in recent years.25 The nanosheet of GO make this material a suitable sorbent for MSPE, which is due to high specific surface area, greater chemical, thermal steadiness and bulky quantities of oxygen atoms on its surface such as epoxy, hydroxyl, and carboxyl groups. As a result, GO has suitable functional groups for the strong π–π interaction between GO and analyte of interest. In addition, this nanomaterial shows a reasonable hydrophilic ability and can create steady colloidal suspensions in water media. Consequently, GO seems to be a opportune sorbet for extraction and preconcentration of a diversity of compounds in different matrices.26
Lately, the conductive polymers (CPs) in sample preparation methods has received great consideration, which is due to their tunable and unique characteristics involving hydrophobicity, π-interaction, acid–base property, polar functional groups, ion exchange abilities, hydrogen bonding, steadiness and ease of synthesis.27 CPs have been utilized to raise the advantages of magnetic materials as sorbents for extraction and enrichment of some analytes in various real matrices.28
In this study, polythionine (PTh) conductive polymer was coated on the surface of GO/Fe3O4, and the new fabricated nanocomposite sorbent was utilized in magnetic dispersive solid-phase extraction (MDSPE) for preconcentration, and trace monitoring of chlorpheniramine. The main factors controlling the extraction efficiency were studied in details and peerless conditions were set up. The analytical protocol in combination with HPLC-UV was finally validated for assessing the time profile of plasma concentrations of chlorpheniramine together with some pharmacokinetic parameters.
2. Experimental
2.1. Chemicals
The following materials were used without further purification. HPLC grade of acetonitril (ACN), ethanol (C2H5OH), methanol (CH3OH), H2SO4(98%), thionine (Th) acetate (85%), hydrochloric acid (37% w/w), sodium hydroxide, iron(III) chloride hexahydrate (FeCl3·6H2O), iron(II) sulphate tetrahydrate (FeSO4·4H2O), potassium permanganate (KMnO4), sodium nitrate (NaNO3), hydrogen peroxide (H2O2, 30%), potassium dihydrogen phosphate (KH2PO4) and ammonia (NH3, 25%) with analytical grade were purchased from Merck Company (Darmstadt, Germany). Graphite powder (mesh of 100) was acquired from Sigma-Aldrich (St. Louis, MO, USA). Chlorpheniramine maleate was purchased from United States Pharmacopeia (USP). Chlorpheniramine tablets (4 mg) were purchased from commercial sources.2.2. Instrumentation
The HPLC analyses were performed on a KNAUER K-1001 including a pump (Waters 484), a manual injector equipped with 20 μL sample loop and a UV/vis detector (set at 262 nm). The analytical column chosen for the separation was a L1 (C18) MZ Perfectsil with 5 μm particle size and dimensions of 150 mm × 4.6 mm id (MZ-Analysentechnik GmbH, Germany), at the temperature of 25 °C. Isocratic mobile phase consisting of acetonitril![[thin space (1/6-em)]](https://www.rsc.org/images/entities/char_2009.gif) :
:![[thin space (1/6-em)]](https://www.rsc.org/images/entities/char_2009.gif) buffer (KH2PO4, pH 4) (70
buffer (KH2PO4, pH 4) (70![[thin space (1/6-em)]](https://www.rsc.org/images/entities/char_2009.gif) :
:![[thin space (1/6-em)]](https://www.rsc.org/images/entities/char_2009.gif) 30) at a flow rate of 1.0 mL min−1 was run through the column. A CL centrifuge (International Equipment Co, USA) was utilized for acceleration of the phase separation. The mobile phase was filtered by passing it through a 0.2 μm membrane filter (Millipore, Bedford, MA, USA). The nanocomposite sorbent was dispersed throughout the aqueous media by Sonorex ultrasonic bath (Misonix-S3000, USA). All of the pH measurements were performed with a WTW Inolab pH meter (Weilheim, Germany). Scanning electron microscopy (SEM) images and Energy Dispersive X-ray spectroscopy (EDX) spectra were recorded via a Hitachi S-4160 machine (Tokyo, Japan). Fourier transform-infrared (FT-IR) spectra were obtained applying A Vector 22 FT-IR spectrometer (Bruker, Germany). The X-ray diffraction (XRD) spectra were recorded using Cu Kα radiation (λ = 1.5406 Å) on A D8 Advance X-ray diffractometer (Bruker, Germany). The magnetic properties of the prepared extraction sorbent were studied using a vibrating sample magnetometer (Kashan, Iran) at room temperature (22 ± 0.5 °C) by changing the applied field in the range of −10 to 10 kOe. The morphology of GO, GO/Fe3O4 and GO/Fe3O4/PTh were evaluating using JEOL-JEM 2010 transmission electron microscopy (TEM, Michigan, USA).
30) at a flow rate of 1.0 mL min−1 was run through the column. A CL centrifuge (International Equipment Co, USA) was utilized for acceleration of the phase separation. The mobile phase was filtered by passing it through a 0.2 μm membrane filter (Millipore, Bedford, MA, USA). The nanocomposite sorbent was dispersed throughout the aqueous media by Sonorex ultrasonic bath (Misonix-S3000, USA). All of the pH measurements were performed with a WTW Inolab pH meter (Weilheim, Germany). Scanning electron microscopy (SEM) images and Energy Dispersive X-ray spectroscopy (EDX) spectra were recorded via a Hitachi S-4160 machine (Tokyo, Japan). Fourier transform-infrared (FT-IR) spectra were obtained applying A Vector 22 FT-IR spectrometer (Bruker, Germany). The X-ray diffraction (XRD) spectra were recorded using Cu Kα radiation (λ = 1.5406 Å) on A D8 Advance X-ray diffractometer (Bruker, Germany). The magnetic properties of the prepared extraction sorbent were studied using a vibrating sample magnetometer (Kashan, Iran) at room temperature (22 ± 0.5 °C) by changing the applied field in the range of −10 to 10 kOe. The morphology of GO, GO/Fe3O4 and GO/Fe3O4/PTh were evaluating using JEOL-JEM 2010 transmission electron microscopy (TEM, Michigan, USA).
2.3. Preparation of standards and quality control samples
A stock solution of chlorpheniramine at concentration level of 100.0 μg mL−1 was prepared in ACN. The working standard solutions of chlorpheniramine were obtained by serial dilutions of the stock solution in ACN and 5.44 g L−1 monobasic potassium phosphate (pH = 4) as diluent. The blank human plasma was spiked with different concentration of working standard solutions to obtain plasma calibration standards and plot the calibration curve. The quality control (QC) samples (5, 150, 250 and 500 ng mL−1) were prepared by spiking appropriate amount of the working standard solutions into human plasma. The stocks and working solutions were kept at temperature of −20 °C.2.4. Deproteinization of plasma
All frozen human plasma were initially thawed at room temperature and transferred to a glass tube. Deproteinization of spiked human plasma was carried out by adding 2.0 mL of 2% (w/v) zinc sulfate-acetonitrile (60![[thin space (1/6-em)]](https://www.rsc.org/images/entities/char_2009.gif) :
:![[thin space (1/6-em)]](https://www.rsc.org/images/entities/char_2009.gif) 40 v/v). After vortex mixing for 4 min, the plasma samples were centrifuged for 10 min at 5000 rpm. Resultant sample was placed under a nitrogen stream at temperature of 50 °C to evaporate the acetonitrile content. The upper phase was transferred into a glass tube and diluted to 6.0 mL with ultra pure water and subsequently 5.0 mL of the prepared sample was subjected to MDSPE. All experiments were performed in compliance with the relevant laws and institutional guidelines. The human plasma samples were kindly donated by the Iranian Blood Transfusion Organization (Tehran, Iran).
40 v/v). After vortex mixing for 4 min, the plasma samples were centrifuged for 10 min at 5000 rpm. Resultant sample was placed under a nitrogen stream at temperature of 50 °C to evaporate the acetonitrile content. The upper phase was transferred into a glass tube and diluted to 6.0 mL with ultra pure water and subsequently 5.0 mL of the prepared sample was subjected to MDSPE. All experiments were performed in compliance with the relevant laws and institutional guidelines. The human plasma samples were kindly donated by the Iranian Blood Transfusion Organization (Tehran, Iran).
Oral administration of a 4 mg single dose was performed to five healthy male volunteers by a scientific support and supervision of a professor (faculty member of Pharmacy and Pharmaceutical Sciences Research Center, Tehran University of Medical Sciences).
2.5. Fabrication of GO/Fe3O4
According to a modified Hummer's method reported in literature GO was synthesized from expanded graphite.29 In brief, graphite powder (3 g) was mixed with NaNO3 (1.5 g), and H2SO4 (69 mL) was added to this. For starting the oxidation step, the resultant mixture was cooled to 0 °C via an ice water bath, and after that 9 g of KMnO4 was added as the oxidizing agent to this solution. The temperature of the obtained sample was raised up to 20 °C by utilizing a thermostat and remained steady for 5 min. Next, the solution was heated, and constantly stirred for 10 h at 35 °C. The temperature of the mixture was reduced to 25 °C and moved into a vessel which contained 400 mL of ice and 3 mL of 30% H2O2. For separating the suspended solid phase, the resulting solution was at centrifugation rate 4000 rpm for 3 min. The obtained solid phase was twice washed with HCl 5% and water. During washing step ultrasonic irradiation was applied to suspend the solid phase. Finally, this solution was centrifuged and the settled material was dried at 120 °C.To synthesize magnetic GO/Fe3O4, the previously fabricated GO (0.3 g) was dispersed in 150 mL water via ultrasonic irradiation. Then, 0.825 g FeCl3·6H2O and 0.322 g of FeCl2·4H2O were dissolved in 25 mL water. The solution of iron(II) and (III) was added dropwise to GO solution at room temperature (22 ± 0.5 °C) under a nitrogen flow and strong agitation while the pH was adjusted to 10 with ammonia (25% v/v). The temperature of the mixture was promoted to 80 °C and stirred for 50 min. The solution containing the black solid phase was centrifuged; the settled remaining phase was washed three times with ethanol and then dried at 100 °C in an oven under vacuum.
2.6. Fabrication of GO/Fe3O4@PTh nanocomposite
To synthesize GO/Fe3O4@PTh, GO/Fe3O4 (0.3 g) was suspended in 150 mL water and was placed in a shaker for 10 min. 0.1 g of FeCl3·6H2O as a catalyst (with purple color) and 0.2 g thionine (Th) was dissolved in 100 mL water and gradually added to the above solution. Next, 2 mL of H2O2 as an oxidizing agent was added dropwise during strong shaking and temperature of the solution was increased and stirred at 50 °C for an hour. During this step, the purple color was disappeared and polythionine was formed. The sedimented phase was separated via a strong magnet and the remaining material was washed four times using deionized water and dried at 25 °C in an oven under vacuum.302.7. Magnetic dispersive solid-phase extraction
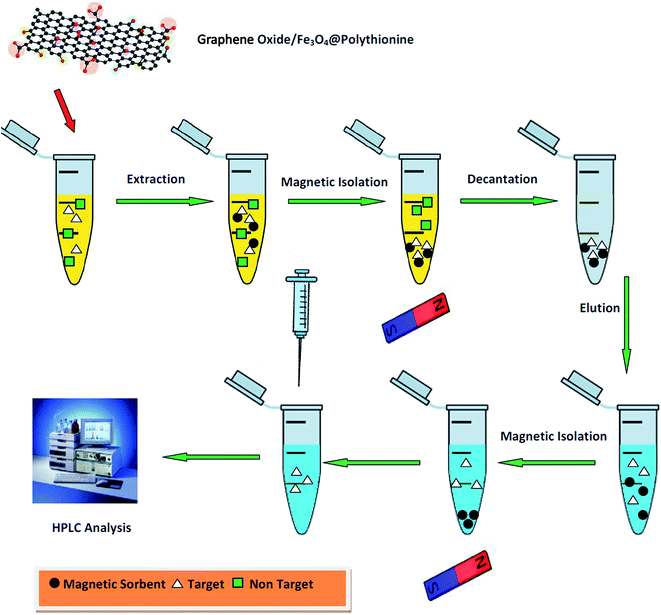
The experimental extraction setup is shown in Fig. 2. At first, 5.0 mL of the spiked human plasma was transferred into a glass tube. The pH of the samples solution was adjusted at 4.0 using phosphoric acid. Then, 30 mg of the magnetic sorbent was added to the sample container. The glass vessel was transferred into an ultrasonic bath and sonicated for 4 min in order to disperse the magnetic GO/Fe3O4@PTh sorbent through the sample media. The magnetic sorbent was separated from sample by exposing glass tube to a powerful magnet (5 cm × 5 cm × 5 cm, 0.6 Tesla) and afterwards, the upper phase was discarded. For desorbing the analyte, the precipitated product extracting chlorpheniramine was diluted with 100.0 μL acetonitril. The obtained mixture was shaken for 3 min and 20 μL of the upper phase was injected into the HPLC.3. Results and discussion
A one at a time approach was applied to optimize predominant experimental factors influencing on the enrichment performance. A fixed level of chlorpheniramine (200.0 ng mL−1) was selected and quantifications were followed by evaluating peak areas from the average of three replicate measurements. Blank plasma samples were run to prove the lack of interference.3.1. Sorbent composition
The sorbent composition is of great importance which controls selectivity, affinity and the capacity of MSPE.31 In comparison with general sorbents, GO has much more hydrophilic characteristic, huge surface area, high extraction capacity, considerable π-electron system and strong affinity for hydrocarbon ring structures. However, it is well known that GO sheets are highly negative charged which makes it difficult for dispersion into aqueous media.32 To overcome this drawback, the magnetic nanocomposite can be fabricated via electrostatic interaction after adding Fe3O4 that has a positively charged surface. The GO/Fe3O4 nanocomposite can be significantly dispersed through the aqueous samples due to the retained hydrophilic moieties. Owing to large surface area, the ability to establish π–π interactions and excellent chemical, mechanical and thermal stability, make CPs as attractive additives for the sorbents in the extraction or isolation of many types of compounds. In this work, to elevate the merits of the sorbent and provide higher extraction efficiency, the surface of GO/Fe3O4 was simply modified with PTh using chemically oxidative polymerization method. The strong and specific π–π stacking interaction between GO/Fe3O4@PTh and target drug make it as a superior sorbent with unique behavior. Polythionine as a surface modifier has aromatic ring and amino groups, so aromatic–aromatic interactions between polymer and chlorpheniramine take places in which π–π interactions play an important role.3.2. Characterization of nanocomposite sorbent
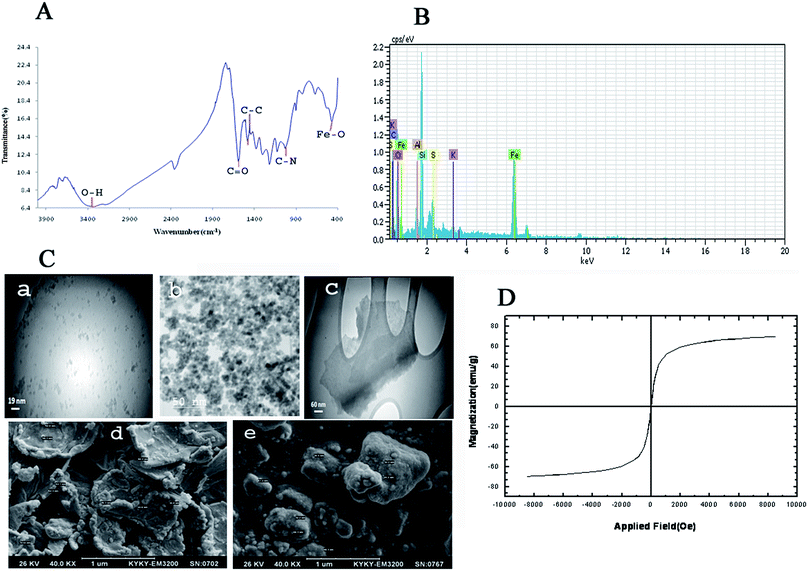
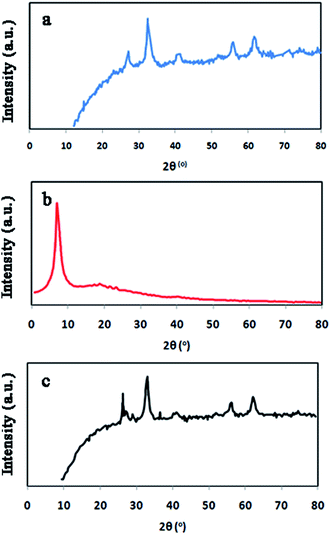
Fig. 3 shows FT-IR spectrum, EDX spectrum, SEM images, TEM images and magnetic properties of GO/Fe3O4/PTh nanocomposite. As it can be seen in Fig. 3A, the peak at 3338 cm−1 corresponds to stretching vibration of O–H bonds in GO structure and the peak at 470.46 cm−1 is certainly assigned to Fe–O vibration, which demonstrates the GO has been appropriately modified with Fe3O4 particles. Moreover, the peaks located at 1031 cm−1 and 1442–1462 cm−1 are most likely related to C–N stretching vibrations and aromatic C–C stretching vibrations, respectively. These results make obvious that GO has been accurately modified with Fe3O4 and PTh. EDX spectra of GO/Fe3O4@PTh was recorded (Fig. 3B) in order to additional confirm the surface modification of GO with polymer and Fe3O4. The EDX spectrum of GO/Fe3O4@PTh shows the existence of sulfur and iron indicating the appropriate change and the presence of PTh and magnetic particles on the surface of GO sheet. The morphologies and particles size of GO, GO/Fe3O4 and GO/Fe3O4@PTh nanostructures were studied using TEM and SEM images. As it is clear in Fig. 3C(a–e), the Fe3O4 particles have grown on the surface of GO sheets and appropriately distributed. The TEM image reveals the configuration of a thin layer coating of PTh on the GO/Fe3O4 nanosheets. The magnetic properties of GO/Fe3O4@PTh were tested using VSM at 300 K. As shown in Fig. 3D, the magnetization curve (S-like) has a high saturation magnetization amount of 54.8 emu g−1 with no hysteresis, coercively and remanence. This value is high enough for magnetic separation using an external magnet. Additionally, the integration of Fe3O4 particles with magnetic sorbent was verified by recording XRD spectra Fe3O4, GO, and GO/Fe3O4@PTh XRD. The location and intensities of seven characteristic peaks for Fe3O4 at 2θ = 30.251°, 35.581°, 43.211°, 54.391°, 57.091°, 62.921° and 75.191° prove the pure cubic spinel crystal structure of Fe3O4 (reference: JCPDS card 03-065-3107) (Fig. 4a). As it is apparent in Fig. 4b, the GO provides a very sharp diffraction peak at 2θ = 11.281. Fig. 4c shows that after synthesis of GO/Fe3O4@PTh, the characteristic peak of Fe3O4 were kept unaffected but the notable diffraction peak for GO was reduced to 2θ = 29.421 revealing the superior magnetic properties of sorbent and its applicability for the magnetic separation.3.3. Effect of sorbent amount
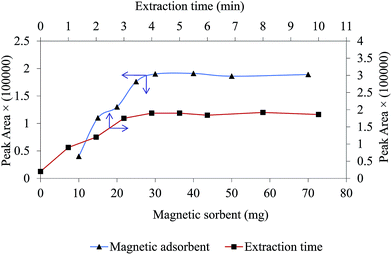
One of the important factor in MDSPE is the amount of sorbent and it has a significant influence on extraction performance. To optimizes this parameter and obtain a compromise between sensitivity and reproducibility, different dosages of magnetic sorbent were used for extraction of chlorpheniramine. The dosage of sorbent were studied in the range of 10–70 mg and the obtained results are shown in Fig. 5. As it can be seen, the peak area related to chlorpheniramine increases as the dosage of GO/Fe3O4@PTh increases. The maximum analytical response was achieved at 30 mg, so this dosage was selected as the optimum and applied for the rest of the experiments.3.4. Effect of ultrasonic irradiation time
Sufficient sonication ultrasound irradiation time, which defines as the extraction time, guarantees sorbent to disperse completely through the sample solution ensuring higher extraction efficiency; it can improve mass transfer process.33 The impact of this factor was investigated in the range of 0–10 min. As it is obvious in Fig. 5, peak area of dru attains the maximum sensitivity at 4 min and after that remained approximately stable. This result confirms that the equilibrium between the magnetic sorbent and sample matrix was almost achieved at 4 min and accordingly this value was selected for all experiments.3.5. Effect of sample pH
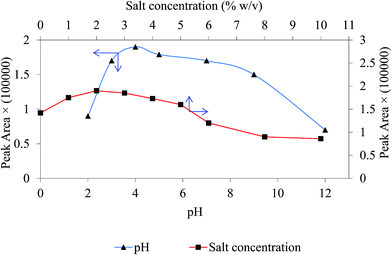
The solution pH play an important role controlling the kind of analyte interaction with magnetic sorbent and the charges on the sorbent surface.25 In order to obtain highest extraction efficiency, the effect of sample pH was investigated within the range of 2.0–13.0 using phosphoric acid and NaOH. The results in Fig. 6 signify that reproducible and sensitive peak areas of target drug were obtained at pH 4.0. For chlorpheniramine two pKa values (9.2 and 4.0) have been reported corresponding to the protonation of both nitrogen atoms in the molecule.34 At pH between 9 and 11 protonation of the tertiary amino group (aliphatic nitrogen) occurs and at pH between 2 and 4, nitrogen of pyridyl ring (aromatic ring) is protonated. So it is likely that at acidic pH aromatic–aromatic interaction becomes prevalent and aromatic rings undergo π stacking onto polythionine to provide better adsorption and extraction yield. Hence, pH 4.0 was selected as the optimum for the rest of the work.3.6. Effect of ionic strength
By adding an electrolyte to sample containing target drug, the ionic strength boosts and extraction performance become better. This improvement can be clarified because of salting-out phenomenon. In this experiment, different concentration levels of NaCl (0–10% w/v) were added to the sample solution to examine its impact on the extraction appearance. The results in Fig. 6 show that peak area of chlorpheniramine increase up to 2% and followed by a stable decrease. The drop of the extraction yield after 2% can be explicated by occupying active sites on the surface of the GO/Fe3O4@PTh by the salt ions. In consequence, a fixed concentration of 2% w/v of NaCl was used as the optimum salt amount in all studies.3.7. Effect of desorption conditions
Three criteria regarding desorption conditions must be studied: (1) kind of desorption solvent (2) its volume and (3) desorption time.35 Therefore, for selection of desired desorption solvent and its suitable volume, these aspects were taken into account. Some kinds of organic solvent including ethanol, methanol and acetonitrile were selected and evaluated. The results showed that acetonitrile was much stronger for analyte desorption and provides higher analytical signals. Also the volume of desorption agent was studied from 50.0 to 200.0 μL and the best elution performance was achieved using 100 μL of desorption solvent. In addition, the effect of desorption time on the extraction recovery was evaluated within the range of 1.0–5.0 min. It was found that 3.0 min was high enough to elute chlorpheniramine from sorbent.3.8. Reusability of the magnetic sorbent
Reusability is a main factor to evaluate the practical application of the fabricated sorbent. To investigate the reusability of GO/Fe3O4@PTh, after extraction process, the sorbent was washed with 3 mL of methanol and then, 3 mL of distilled water. After that, it was dried and was used again for new experiments. The obtained results showed that the fabricated solid phase can be reused at least 6 times with the extraction recoveries higher than 82%.3.9. Analytical performance data
To investigate the usage of the methodology, each standard sample of chlorpheniramine was extracted and determined using MDSPE-HPLC in order to draw the calibration curve. For each content level, three independent extractions analyses were performed. The limit of detection (LOD), based on the signal-to-noise ratio (S/N) of 3, the limit of quantification (LOQ) based on the S/N of 10 and the determination coefficients (r2) were considered. The linear range (LR) (2.0–550.0 ng mL−1 with r2 = 0.995) is useful to cover the probable levels of chlorpheniramine in human plasma while LOD (0.4 ng mL−1) and LOQ (2.0 ng mL−1) present an elevated and appropriate sensitivity of the method. The chromatograms for blank and spiked human plasma are shown in Fig. 7 and revealed that there was no significant interference in the entire analytical procedure.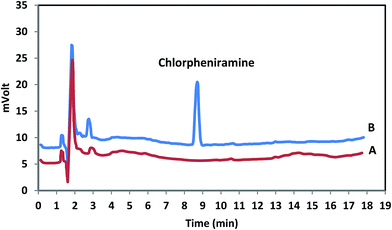 | ||
| Fig. 7 Typical chromatograms of chlorpheniramine in human plasma; A: blank plasma; B: spiked plasma with 200 ng mL−1 of chlorpheniramine. | ||
3.10. Extraction recovery, enrichment factor and stability
The enrichment factor (EF) and extraction recovery (ER) calculations were done in accordance with the formerly published report.36 ER experiments were performed by analyzing plasma samples spiked with chlorpheniramine at different concentration levels of 5, 150, 250 and 500 ng mL−1. As seen in Table 1, ER% and EF were within 87.9–96.4 and 16.7–18.3, respectively. In new experiments, extraction recoveries of chlorpheniramine at concentration level of 250.0 ng mL−1 were experimentally determined using GO, Fe3O4 and PTh, and values of 73.2, 30.9 and 44.7% were obtained, respectively. The combination of both magnetic properties of GO/Fe3O4 and polymeric aspects provides notable potentials including bulky surface area, high number of surface active sites, powerful adsorption capability and easy magnetic separation by means of magnetic field in different applications. GO/Fe3O4@PTh is considered as a non-polar and hydrophobic sorbent and exhibits strong affinity for carbon-based ring and hydrophobic structures, which is owing to the strong π–π stacking interaction. According to these criteria, fabrication of GO/Fe3O4@PTh is necessary to improve the adsorption capability of the sorbet and obtain reasonable extraction recovery.The stability of chlorpheniramine in human plasma was evaluated. QC samples were analyzed by MDSPE-HPLC and were left at room temperature for 24 h. After that they were analyzed again and no considerable degradation products were found in chromatograms (relative error within ±12%).
3.11. Intra-day and inter-day precision and accuracy
Intra-day precision and accuracy of the quantification were evaluated for chlorpheniramine at QC levels. The intra-day precision (RSD) and accuracy of the method measured in one day were within the range of 4.1–5.0% and 88.9–96.0%, respectively. Also inter-day precision (RSD) and accuracy investigated in three days were in the range of 4.9–5.6% and 86.9–95.8%, respectively, as shown in Table 2. These results confirm that the developed method is repeatable and reliable.| Drug | QC samples (ng mL−1) | Intra-day, n = 4 | Inter-day, n = 6 | ||
|---|---|---|---|---|---|
| RSDa (%) | Accuracyb (%) | RSDa (%) | Accuracyb (%) | ||
| a The results of three independent measurements.b Defined as (found value mean/nominal concentration) × 100. | |||||
| Chlorpheniramine | 5 | 4.1 | 88.9 | 5.1 | 86.9 |
| 150 | 4.7 | 92.1 | 5.0 | 90.9 | |
| 250 | 5.5 | 95.6 | 5.6 | 92.4 | |
| 500 | 5.0 | 96.0 | 4.9 | 95.8 | |
3.12. Application of the analytical method to pharmacokinetic study
For confirming the flexibility of the method in multipurpose analytical applications, the developed protocol was employed to analysis chlorpheniramine in human plasma and achieve some pharmacokinetic parameters. Oral administration of a 4 mg single dose was performed to five healthy male volunteers by a scientific support and supervision of a professor (faculty member of Pharmacy and Pharmaceutical Sciences Research Center, Tehran University of Medical Sciences). The real samples were taken at 0, 1, 2, 3, 4, 6, 8, 10, 12, 18, 24, 48 h after drug administration and analyzed, after that. The mean plasma concentration-time curve of chlorpheniramine shown in Fig. 8 and the relating pharmacokinetic parameters including Tmax, Cmax, AUC0−t, AUC0–∞, and T1/2 are summarized in Table 3.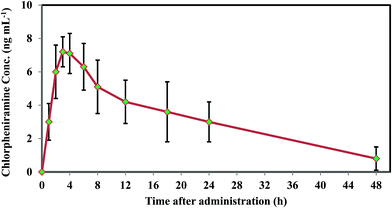 | ||
| Fig. 8 Chlorpheniramine concentration profile in plasma versus time after the 4 mg oral administration. | ||
| Pharmacokinetic parameters | Chlorpheniramine (4 mg) | |
|---|---|---|
| Mean | S.D. | |
| a Tmax: Time required to reach maximum plasma concentration. Cmax: Maximum plasma concentration. AUC0–t: Area under curve. AUC0-∞: Area under curve at infinite time, T1/2 (h): Time required to reach half of the concentration. | ||
| Tmax (h) | 3.43 | 0.9 |
| Cmax (ng mL−1) | 7.30 | 2.8 |
| AUC0–t (ng h mL−1) | 126.8 | 37.0 |
| AUC0–∞ (ng h mL−1) | 158.9 | 49.1 |
| T1/2 (h) | 18.8 | 4.5 |
3.13. Comparison with other methods
A comparison of the presented approach with other previously reported techniques for the determination of chlorpheniramine is provided in Table 4. As seen in the table, the current protocol gave reasonable RSD and LR. Furthermore, the LOD and LOQ of MDSPE-HPLC-UV shows a significant improvement in comparison with conventional HPLC, capillary electrophoresis and spectrophotometric methods. Hence, these methods are not applicable for the analysis of chlorpheniramine in human plasma. Besides the simplicity, sensitivity and low cost, an added advantage of MDSPE-HPLC-UV over the other methods is little extraction time (lower than 5 min). These aspects are of great interest for laboratories in sensitive monitoring of chlorpheniramine in real biological samples.| Method | LR (ng mL−1) | LOD (ng mL−1) | LOQ (ng mL−1) | RSD (%) | Reference |
|---|---|---|---|---|---|
| a Liquid–liquid extraction-liquid chromatography-tandem mass spectrometry.b Reverse phase-HPLC.c Not reported. | |||||
| Spectrophotometry | 2500–20![[thin space (1/6-em)]](https://www.rsc.org/images/entities/char_2009.gif) 000 000 |
470 | 1140 | 1.25 | 37 |
| LLE-LC-MS/MSa | 2–400 | NRc | 2 | 15 | 7 |
| RP-HPLCb | 5000–60![[thin space (1/6-em)]](https://www.rsc.org/images/entities/char_2009.gif) 000 000 |
360 | 1100 | 0.97–1.19 | 38 |
| Capillary electrophoresis | >4500 | 1190 | 4500 | 3.7 | 39 |
| MDSPE-HPLC-UV | 2–550 | 0.4 | 2 | 4.1–5.6 | Represented work |
4. Conclusion
An efficient magnetic nanocomposite of GO/Fe3O4@PTh was synthesized and utilized as a sustainable sorbent for MDSPE. Application of PTh as a surface modifier significantly improves the merits of GO/Fe3O4. The results demonstrated that high surface area-to-volume ratio and rapid mass transfer ability of the magnetic sorbent in combination with HPLC-UV is a reliable means of enrichment and measurement of chlorpheniramine at lower spiking levels. Under the optimized conditions, satisfactory extraction efficiencies and validation parameters including sensitivity, precision and recovery were obtained. No considerable matrix effect on the proposed sample enrichment method was observed. Putting all the benefits together as well as convenient magnetic separation without the need for any special instruments with easy-to-recycle GO/Fe3O4@PTh, the presented method could be a reasonable alternative for trace-level screening of drugs in human plasma.Conflicts of interest
There are no conflicts to declare.Acknowledgements
This work has been supported by grants from the Islamic Azad University South Tehran Branch which is hereby gratefully acknowledged. The authors greatly appreciate Miss Shaghayegh Sotoudeh for cooperating to carry out the HPLC analyses and all volunteers for helping us to study pharmacokinetic features.References
- J. E. F. Reynolds, Martindale: the extra pharmacopoeia, Pharmaceutical Press, London, 30th edn, 1993 Search PubMed
.
- U. R. Cieri, J. AOAC Int., 2006, 89, 53–57 CAS
.
- A. Kaura, V. Gupta, G. Roy and M. Kaura, Int. Curr. Pharm. J., 2013, 2, 97–100 CAS
.
- H. Şenyuva and T. Özden, J. Chromatogr. Sci., 2002, 40, 97–100 Search PubMed
.
- V. Kanumula Gangaram, B. Raman and I. Bhoir, Indian Drugs, 2001, 38, 203–206 Search PubMed
.
- A. Van Eeckhaut, M. R. Detaevernier and Y. Michotte, J. Chromatogr. A, 2002, 958, 291–297 CrossRef CAS PubMed
.
- X. Chen, Y. Zhang and D. Zhong, Biomed. Chromatogr., 2004, 18, 248–253 CrossRef CAS PubMed
.
- C. Celma, J. Allue, J. Prunonosa, C. Peraire and R. Obach, J. Chromatogr. A, 2000, 870, 77–86 CrossRef CAS PubMed
.
- A. K. Kaura, V. Gupta, M. Kaura, G. S. Roy and P. Bansal, J. Pharma Res., 2013, 7, 404–408 CrossRef CAS
.
- S. Moldoveanu, J. Chromatogr. Sci., 2004, 42, 1–14 CAS
.
- A. Sarafraz-Yazdi and A. Amiri, TrAC, Trends Anal. Chem., 2010, 29, 1–14 CrossRef CAS
.
- M. Zeeb, H. Farahani and M. K. Papan, J. Sep. Sci., 2016, 39, 2138–2145 CrossRef CAS PubMed
.
- A. A. D'Archivio, M. A. Maggi, F. Ruggieri, M. Carlucci, V. Ferrone and G. Carlucci, J. Pharm. Biomed. Anal., 2016, 125, 114–121 CrossRef PubMed
.
- L. Xu, F. Luan, H. Liu and Y. Gao, J. Sci. Food Agric., 2015, 95, 745–751 CrossRef CAS PubMed
.
- G.-T. Zhu, S. He, X.-M. He, S.-K. Zhu and Y.-Q. Feng, RSC Adv., 2017, 7, 40608–40614 RSC
.
- M. Zeeb, P. T. Jamil, A. Berenjian, M. R. Ganjali and M. R. T. B. Olyai, Daru, J. Pharm. Sci., 2013, 21, 63–70 CrossRef CAS PubMed
.
- M. Zeeb, B. Mirza, R. Zare-Dorabei and H. Farahani, Food Analytical Methods, 2014, 7, 1783–1790 CrossRef
.
- X. Liu, S. Liang, J. Pan, Y. Guo, H. Luo, Q. Zhao and S. Guan, J. Chromatogr. Sci., 2013, 52, 553–558 Search PubMed
.
- A. S. Amin and S. M. Moalla, RSC Adv., 2016, 6, 1938–1944 RSC
.
- M. Ghani, F. Maya and V. Cerdà, RSC Adv., 2016, 6, 48558–48565 RSC
.
- I. Vasconcelos and C. Fernandes, TrAC, Trends Anal. Chem., 2017, 89, 41–52 CrossRef CAS
.
- I. S. Ibarra, J. A. Rodriguez, C. A. Galán-Vidal, A. Cepeda and J. M. Miranda, J. Chem., 2015, 1–13 CAS
.
- C. Herrero-Latorre, J. Barciela-García, S. García-Martín, R. Peña-Crecente and J. Otárola-Jiménez, Anal. Chim. Acta, 2015, 892, 10–26 CrossRef CAS PubMed
.
- A. M. Dimiev, Graphene oxide: Fundamentals and applications, ISBN: 978-1-119-06940-9, John Wiley & Sons, 2016 Search PubMed
.
- S. Seidi and M. Fotouhi, Anal. Methods, 2017, 9, 803–813 RSC
.
- X. Hou, X. Wang, Y. Sun, L. Wang and Y. Guo, Anal. Bioanal. Chem., 2017, 409, 3541–3549 CrossRef CAS PubMed
.
- X. Li, Y. Wang, X. Yang, J. Chen, H. Fu and T. Cheng, TrAC, Trends Anal. Chem., 2012, 39, 163–179 CrossRef CAS
.
- H. Bagheri, Z. Ayazi and M. Naderi, Anal. Chim. Acta, 2013, 767, 1–13 CrossRef CAS PubMed
.
- D. C. Marcano, D. V. Kosynkin, J. M. Berlin, A. Sinitskii, Z. Sun, A. Slesarev, L. B. Alemany, W. Lu and J. M. Tour, ACS Nano, 2010, 4, 4806–4814 CrossRef CAS PubMed
.
- C. Zhao, Z. Jiang, X. Cai, L. Lin, X. Lin and S. Weng, J. Electroanal. Chem., 2015, 748, 16–22 CrossRef CAS
.
- S. Nazari, A. Mehri and A. S. Hassannia, Microchim. Acta, 2017, 184, 1–8 CrossRef
.
- S. Yan, T.-T. Qi, D.-W. Chen, Z. Li, X.-J. Li and S.-Y. Pan, J. Chromatogr. A, 2014, 1347, 30–38 CrossRef CAS PubMed
.
- X. Chen, X. You, F. Liu, F. Hou and X. Zhang, J. Sep. Sci., 2015, 38, 93–99 CrossRef PubMed
.
- I. M. Villoslada, F. Gonzalez, B. L. Rivas, T. Shibue and H. Nishide, Polymer, 2007, 48, 799–804 CrossRef
.
- M. Li, J. Wang, C. Jiao, C. Wang, Q. Wu and Z. Wang, J. Chromatogr. A, 2016, 1469, 17–24 CrossRef CAS PubMed
.
- T. S. Ho, S. Pedersen-Bjergaard and K. E. Rasmussen, J. Chromatogr. A, 2002, 963, 3–17 CrossRef CAS PubMed
.
- M. A. Bratty, Orient. J. Chem., 2016, 32, 885–894 CrossRef
.
- S. Renu, K. Mamta, M. Mukesh and K. Sunil, Int. J. Drug Dev. Res., 2013, 5, 258–262 Search PubMed
.
- Y. Dong, X. Chen, Y. Chen, X. Chen and Z. Hu, J. Pharm. Biomed. Anal., 2005, 39, 285–289 CrossRef CAS PubMed
.
| This journal is © The Royal Society of Chemistry 2017 |

