
 Open Access Article
 This Open Access Article is licensed under a
 Creative Commons Attribution 3.0 Unported Licence
The solid-phase extraction of α-chymotrypsin based on a novel porous polymeric dianionic ionic liquid-coated magnetic material†
Qin Yang,
Yuzhi Wang *,
Hongmei Zhang,
Kaijia Xu,
Xiaoxiao Wei,
Jing Chen and
Panli Xu
*,
Hongmei Zhang,
Kaijia Xu,
Xiaoxiao Wei,
Jing Chen and
Panli Xu
State Key Laboratory of Chemo/Biosensing and Chemometrics, College of Chemistry and Chemical Engineering, Hunan University, Changsha, 410082, P. R. China. E-mail: wyzss@hnu.edu.cn; Fax: +86-731-88821848; Tel: +86-731-88821903
First published on 20th November 2017
Abstract
A novel magnetic solid-phase extraction (MSPE) method based on carboxymethylcellulose sodium modified Fe3O4 nanocomposite coated with porous polymeric dianionic ionic liquid (Fe3O4@CMC@PPDIL) was proposed and applied to extracting α-chymotrypsin. The synthesized Fe3O4@CMC@PPDIL was characterized by vibrating sample magnetometry (VSM), thermo-gravimetric analysis (TGA), transmission electron microscopy (TEM), X-ray diffraction (XRD), Fourier transform infrared spectrometry (FT-IR) and zeta potential measurement. Furthermore, the influence of a series of factors, such as extraction time and temperature, initial α-chymotrypsin concentration, pH value and ionic strength, was systematically investigated. Under the optimal extraction conditions, the extraction capacity for α-chymotrypsin could reach up to 122.91 mg g−1, and the activity of α-chymotrypsin is well maintained after extraction. In addition, the proposed MSPE method provides satisfactory results in real sample analysis.
1. Introduction
Proteases play an irreplaceable role in the processes of life activities.1,2 Chymotrypsin exists in vertebrates.3 As a typical serine proteolytic enzyme, it can selectively hydrolyze peptide bonds on the C-terminal side of tyrosine, phenylalanine, tryptophan and leucine at a fast speed.4 Compared with trypsin, α-chymotrypsin possesses many superior properties such as stronger ability to hydrolyze proteins, lower toxicity, smaller adverse reactions and so on.5–8 Therefore, it is of profound significance to develop a simple and effective pretreatment method to extract α-chymotrypsin for further research.On the basis of several conventional pretreatment methods like liquid–liquid extraction,9 solid-phase extraction10 and solid-phase microextraction,11 a novel extraction method, called magnetic solid-phase extraction (MSPE), has been developed in the past few years.12–14 The procedure of MSPE mainly includes two steps: adsorption and desorption. Firstly, the analyte in the sample solution is adsorbed by the magnetic extractant; secondly, the adsorbed analyte is eluted by a suitable eluent from the magnetic extractant. In this procedure, the magnetic extractant dispersed in the solution can be easily separated from the supernatant with the help of an external magnetic filed, which significantly simplifies the separation process. Owing to a lot of outstanding advantages such as simple operation, less consumption of volatile organic solvents, high recovery, etc., many researchers have been attracted by this new technology.15–17
Owing to their ease to synthesize and low toxicity, magnetic Fe3O4 nanoparticles are usually adopted to offer extractants with magnetism in MSPE method.18–20 However, aggregation often occurs to nanoparticles,21 so a protective layer is needed. Carboxymethylcellulose sodium (CMC) is a carbohydrate-derived biomaterial,22 which is of good biocompatibility, biodegradability, low cost and non-toxicity.23 Thus, it can not only protect Fe3O4 nanoparticles from aggregation, but also promote the biocompatibility to coat Fe3O4 with CMC, which makes it more suitable for the analysis of biomass.
Ionic liquid (IL) possesses plenty of excellent properties such as electrochemical and thermal stability, low volatility, non-flammability and so forth, which make it be regarded as “green solvents”. Polymeric ionic liquid (PIL) is a further development of IL.24,25 PIL is equipped with the most useful properties of IL. Meanwhile, it possesses the superior properties of polymers, such as elasticity, plasticity, corrosion resistance and so forth.26 As a result, the combination of PIL and MSPE method shows great attractivity and significance in the filed of biomolecules analysis.
In this work, carboxymethylcellulose sodium modified Fe3O4 nanocomposite coated with porous polymeric dianionic ionic liquid (Fe3O4@CMC@PPDIL) was synthesized and applied to the extraction for α-chymotrypsin (α-Chy) coupled with MSPE method for the first time. The extraction performance of Fe3O4@CMC@PPDIL was further investigated and optimized. Moreover, the activity of α-chymotrypsin eluted from extractant was tested. And the proposed method was successfully applied to the real sample analysis.
2. Experimental
2.1. Reagents and apparatuses
All reagents used in this work were analytical grade without any further purification. FeCl3, FeCl2·4H2O, hydrazine hydrate, sodium hydroxide (NaOH), carboxymethylcellulose sodium (CMC), sodium dodecyl sulfate (SDS) and itaconic acid were bought from Sinopharm Chemical Teagent Co., Ltd. (Shanghai, China). Choline, α-chymotrypsin (α-Chy) from porcine pancreas, bovine serum albumin (BSA), ovalbumin (OVA), lysozyme (Lys) and bovine hemoglobin (BHb) were supplied by Shanghai yuanye Bio-Technology Co., Ltd. (China). N-Benzoyl-L tyrosine ethyl ester (BTEE) was gained from J&K Chemical Technology Co. Ltd. (Beijing, China). Acrylic acid, N,N-methylenebisacrylamide (MBAA) and ammonium persulfate (APS) were purchased from Fucheng Chemicals (Tianjin, China). The water utilized throughout the research was ultra pure water.The main apparatuses were listed below: B-220 thermostat water bath (Shanghai, China); UV-2450 UV-vis spectrophotometer (Shimadzu, Japan); STA409 thermal gravimetric analyzer (TGA, Netzsch, Germany); DZF-6051 vacuum drying oven (Shanghai, China); FT-IR spectrometer (PerkinElmer, USA); KQ 3200E ultrasonic cleaner (Kunshan ultrasonic instruments Co., Ltd., China); STA 409 thermal gravimetric analyzer (Netzsch, Germany); EV 11 Vibrating Sample Magnetometer (MicroSense, USA); HT-7700 transmission electron microscope (TEM, Hitachi, Japan); QWC200 incubator shaker (Shanghai, China); INOVA 400NB NMR (Varian, America).
2.2. Preparation of Fe3O4@CMC
According to the literature,27,28 the CMC-modified Fe3O4 nanoparticles (Fe3O4@CMC) were synthesized by chemical co-precipitation method with slight modification. 0.5 g of CMC was dissolved in 50 mL of water. Subsequently, 4.86 g of FeCl3 and 3.98 g of FeCl2·4H2O were added into the solution and dissolved with mechanical stirring (400 rpm min−1) at room temperature, followed by the addition of 1 mL of hydrazine hydrate. Next, the mixture was heated to 60 degrees celsius in water bath and appropriate amount of NaOH solution was poured into the reaction solution to adjust the pH value to 11. The Fe3O4@CMC was synthesized after stirring at 400 rpm min−1 for 30 min. The resulting mixture was washed by water and ethanol for several times and dried under vacuum at 50 degrees celsius to obtain the final product.2.3. Preparation of DIL-monomer
The dianionic IL-monomer was synthesized by one-step method referred to the literature.29 The synthetic route is shown in Fig. 1. Itaconic acid and choline (1![[thin space (1/6-em)]](https://www.rsc.org/images/entities/char_2009.gif) :2) reacted in water solution at room temperature, stirring at a speed of 400 rpm min−1 for 12 h. The water was then removed by rotate evaporation and vacuum drying. The 1H NMR spectra of the IL-monomer is as follows: (500 MHz, DMSO-d6) δ 5.49 (d, J = 3.9 Hz, 1H), 4.91 (d, J = 3.9 Hz, 1H), 4.07–3.66 (m, 4H), 3.60–3.24 (m, 4H), 3.12 (s, 18H), 2.83 (s, 2H), 2.49 (s, 2H).
:2) reacted in water solution at room temperature, stirring at a speed of 400 rpm min−1 for 12 h. The water was then removed by rotate evaporation and vacuum drying. The 1H NMR spectra of the IL-monomer is as follows: (500 MHz, DMSO-d6) δ 5.49 (d, J = 3.9 Hz, 1H), 4.91 (d, J = 3.9 Hz, 1H), 4.07–3.66 (m, 4H), 3.60–3.24 (m, 4H), 3.12 (s, 18H), 2.83 (s, 2H), 2.49 (s, 2H).
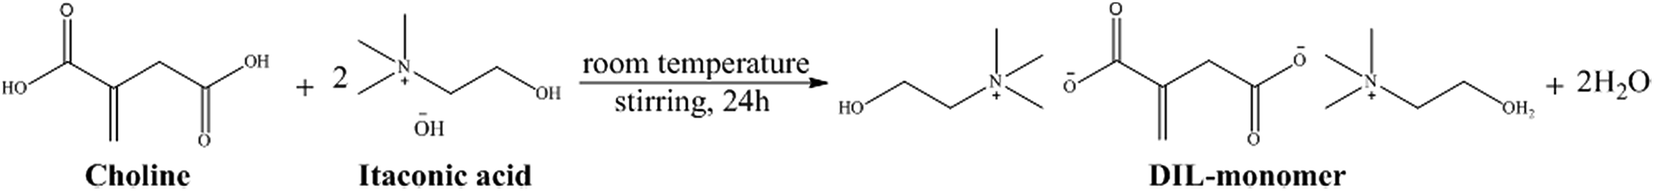 | ||
| Fig. 1 Synthesis of DIL-monomer. | ||
2.4. Preparation of extractants
Three kinds of polymeric ionic liquid-based extractants, Fe3O4@CMC coated with porous polymeric dianionic ionic liquid (Fe3O4@CMC@PPDIL), Fe3O4@CMC coated with polymeric dianionic ionic liquid (Fe3O4@CMC@PDIL) and Fe3O4@CMC coated with polymeric dianionic ionic liquid and CaCO3 (Fe3O4@CMC@PDIL/CaCO3), were synthesized by seed emulsion polymerization30 and templating31 method with some modification. Taking Fe3O4@CMC@PPDIL as an example, firstly, 0.5 g of Fe3O4@CMC was treated with sonication for 20 min to disperse in 30 mL of ethanol. After that, 5 mL of acrylic acid was added into this suspension, followed by shaking for 1 h and then the resultant was washed with ethanol for several times and dispersed in 10 mL of ethanol. The resulting suspension was named as solution A. On the other hand, 0.5 mL of IL-monomer and 0.5 g of CaCO3 were well mixed in 8 mL of water with the help of sonication for 20 min, which was named as solution B. Afterwards, solution A and 10 mg of SDS were dispersed in 40 mL of water, bubbled with nitrogen for 30 min. Subsequently, solution B and 40 mg of MBAA were added into the resulting mixture. After bubbled for another 20 min, 0.5 mL of APS solution (20 mg mL−1) was added, and the dispersion was heated to 75 degrees celsius in water bath to polymerize for 7 h. The final product was washed with EDTA solution (0.2 M), the pH value of which was adjusted to 7.5 with NaOH, to remove CaCO3, and then with water and ethanol for several times and dried in vacuum drier overnight.The synthetic routes of Fe3O4@CMC@PDIL and Fe3O4@CMC@PDIL/CaCO3 were roughly the same with that of Fe3O4@CMC@PPDIL. The former material was prepared following the same procedure mentioned above without addition of CaCO3. As for the latter one, the step that the product was washed with EDTA solution was skipped. In other words, the CaCO3 wasn't removed.
2.5. Magnetic solid-phase extraction procedure of analytes
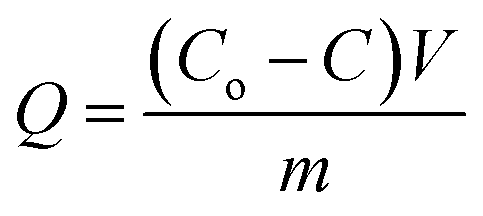
The synthesized extractants were applied in the MSPE of analytes (as shown in Fig. 2). Details are as follows. 5 mg of extractant was added into 1 mL of aqueous solution where the concentration of analyte was 1 mg mL−1. After shaken at constant temperature of 30 degrees celsius for 30 min, the mixture was treated with a magnet at the bottom to obtain the supernatant. The concentrations of analyte in the supernatant and initial solution were detected by UV-vis spectrophotometer at corresponding wavelength, around 278 nm for α-Chy, OVA, Lys and BSA and 404 nm for BHb. The extraction capacity (Q) was evaluated according to the following formula:21where Co and C (mg mL−1) represent the protein concentration of initial solution and extracted solution, respectively. V (mL) is the volume of the initial protein solution and m (g) is the mass of extractant.
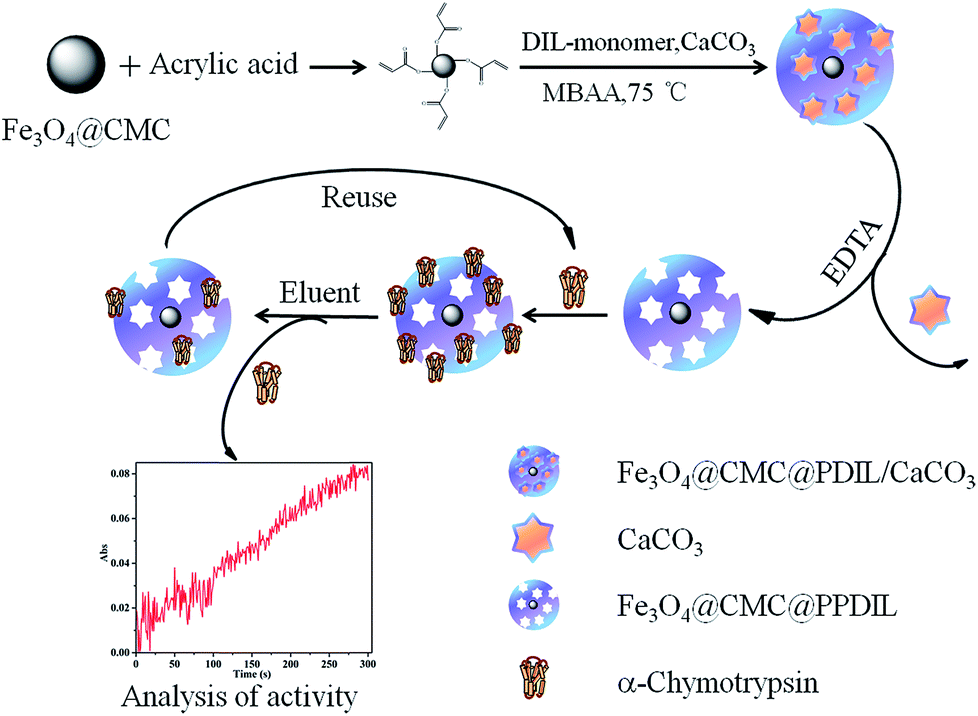 | ||
| Fig. 2 Synthetic route of Fe3O4@CMC@PPDIL and flow chart of its application in MSPE. | ||
2.6. Analysis of α-chymotrypsin activity
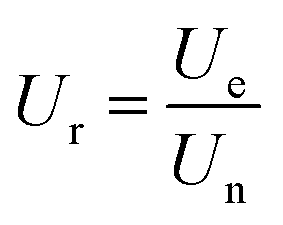
The analysis of α-chymotrypsin activity was carried out by BTEE method. At 25 degrees celsius, 1.40 mL of α-chymotrypsin solution (1.18 mM) was mixed with 1.42 mL of Tris–HCl buffer solution (pH = 7.8). Subsequently, 0.08 mL of CaCl2 solution (2 M) was added into the mixture. After 0.10 mL of BTEE solution with suitable concentration, which was dissolved in 1 mM of HCl solution, was added, the resulting mixture was shaken for several times and recorded the increase of absorbance at 256 nm for 5 min immediately. The activity of α-chymotrypsin was described by the relative activity (Ur), which was calculated by the following formula:27where Ue is the BTEE unit of α-chymotrypsin in the eluent and Un is the BTEE unit of α-chymotrypsin in the buffer solution with the same concentration.
3. Results and discussion
3.1. Characterization of extractants
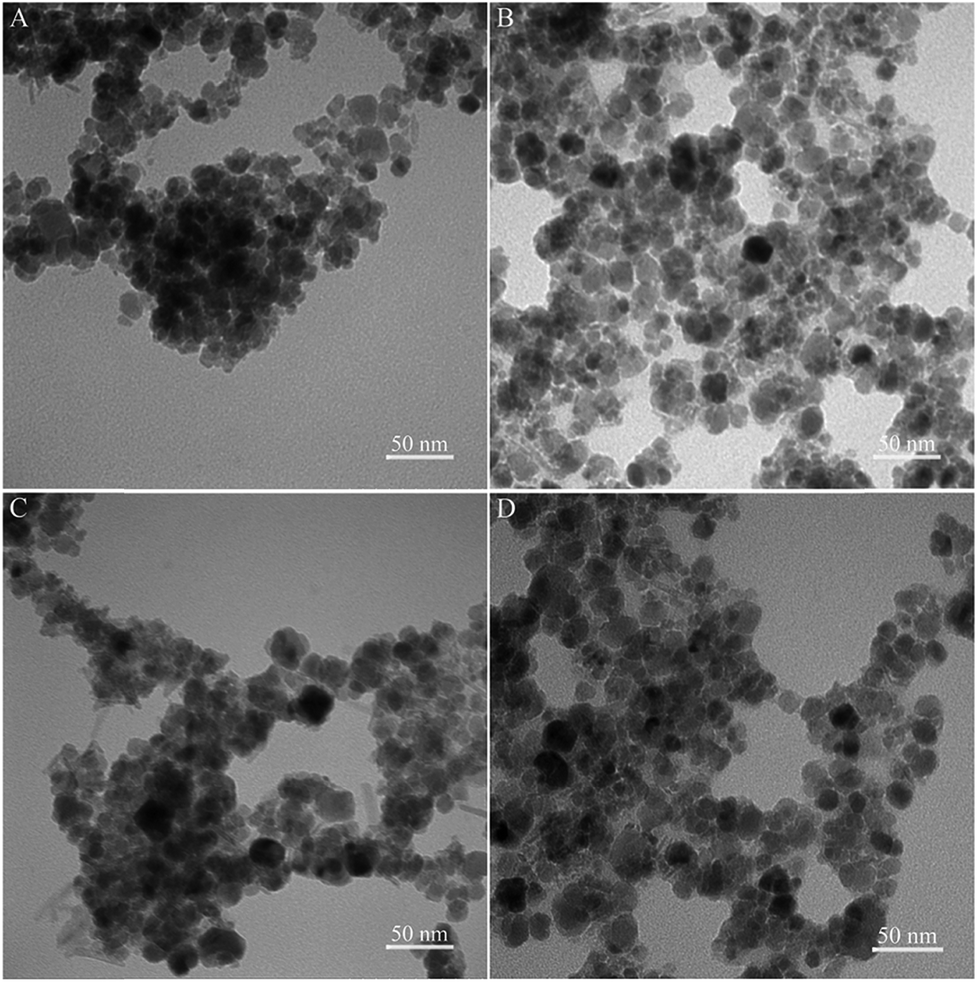 | ||
| Fig. 3 TEM images of Fe3O4@CMC (A), Fe3O4@CMC@PPDIL (B), Fe3O4@CMC@PDIL (C) and Fe3O4@CMC@PDIL/CaCO3 (D). | ||
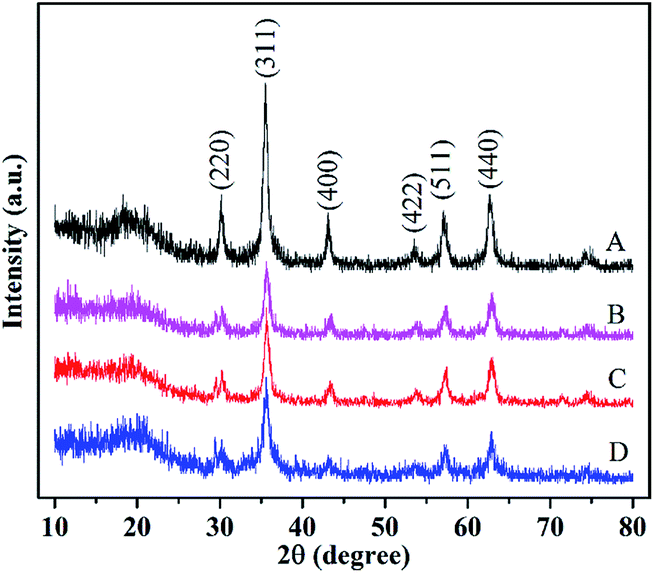 | ||
| Fig. 4 XRD patterns of Fe3O4@CMC (A), Fe3O4@CMC@PPDIL (B), Fe3O4@CMC@PDIL (C) and Fe3O4@CMC@PDIL/CaCO3 (D). | ||
![[double bond, length as m-dash]](https://www.rsc.org/images/entities/char_e001.gif) C and C–N in ionic liquid appear at 3386, 1582 and 1052 cm−1, respectively, which provides evidence to the successful preparation of ionic liquid and polymerization over magnetic Fe3O4@CMC composite. The peak at 880 cm−1 belongs to CO32− of CaCO3.
C and C–N in ionic liquid appear at 3386, 1582 and 1052 cm−1, respectively, which provides evidence to the successful preparation of ionic liquid and polymerization over magnetic Fe3O4@CMC composite. The peak at 880 cm−1 belongs to CO32− of CaCO3.3.2. Comparison of extractants
To certify the priority of the porous material in extraction performance, the four kinds of extractants (Fe3O4@CMC, Fe3O4@CMC@PPDIL, Fe3O4@CMC@PDIL and Fe3O4@CMC@PDIL/CaCO3) were all applied to the MSPE procedure with the same operation as that described in section 2.5. In this study, α-Chy was selected as the target analyte. From Fig. 5, absolutely, all the three kinds of polymeric ionic liquid-based extractants extract more α-Chy than Fe3O4@CMC, which proves that polymeric ionic liquid indeed promotes the extraction capacity for α-Chy. It can be attributed that the hydroxyl groups and dianionic center in ionic liquid improves the interaction between extractants and α-Chy, which causes the increase of the extraction properties of ionic liquid modified extractants compared with the unmodified extractant. Moreover, Fe3O4@CMC@PPDIL shows manifestly better extraction ability (63.68 mg g−1) than the other three materials (39.84, 51.23 and 45.54 mg g−1). The porous structure of Fe3O4@CMC@PPDIL can provide more activity sites to interact with analyte, which contributes to the extraction ability. As a result, Fe3O4@CMC@PPDIL was selected in the next studies.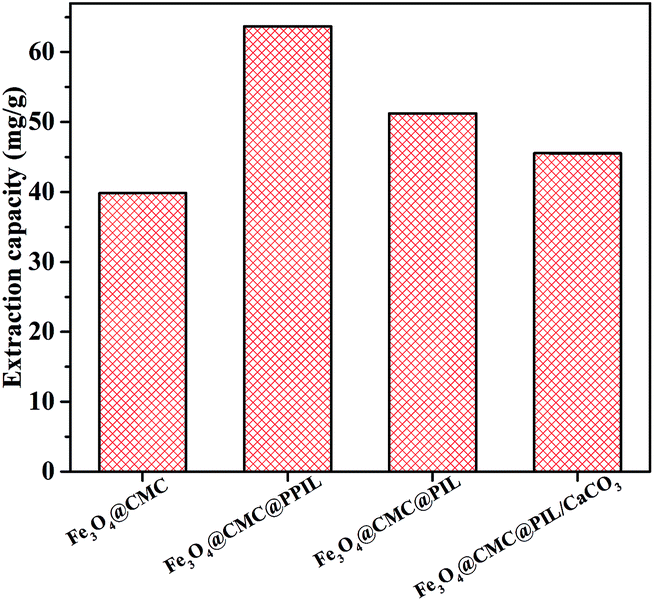 | ||
| Fig. 5 Extraction abilities for α-chymotrypsin of different extractants. | ||
3.3. Single factor experiments
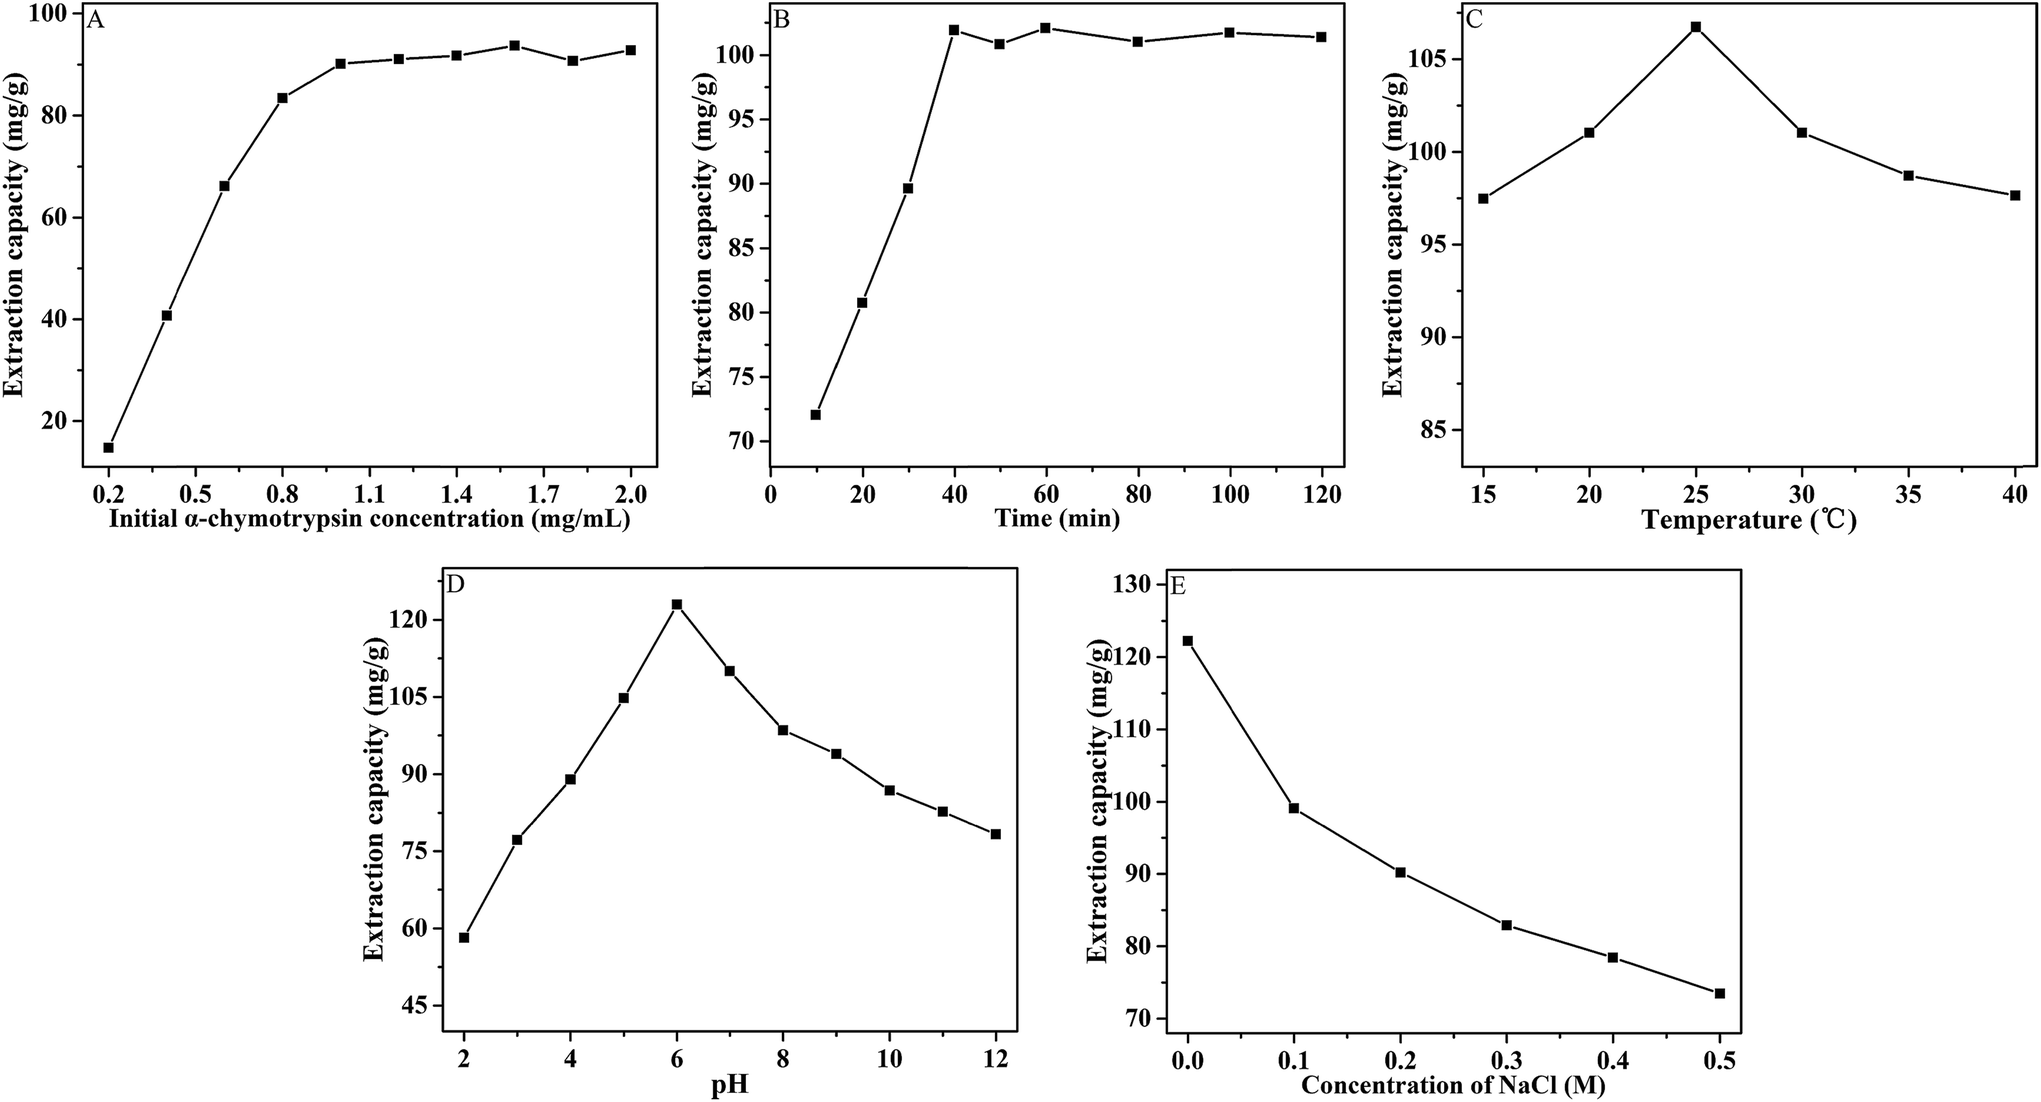 | ||
| Fig. 6 Effect of initial α-chymotrypsin concentration (A), extraction time (B), temperature (C), pH value (D) and ionic strength (E) on the extraction capacities. | ||
3.4. Comparison of extraction capacity on different analytes
The synthesized Fe3O4@CMC and Fe3O4@CMC@PPDIL nanomaterials were applied in the MSPE for several kinds of analytes, α-Chy, BSA, OVA, Lys and BHb, to verify the extraction ability. It can be seen from Fig. 7 that all the five kinds of analytes can be extracted by the two kinds of extractants to different degrees. Typically, the extraction capacity of Fe3O4@CMC@PPDIL for α-Chy (122.91 mg g−1) is the highest among them. Thus, it can be promising to use Fe3O4@CMC@PPDIL as a novel extractant for α-Chy.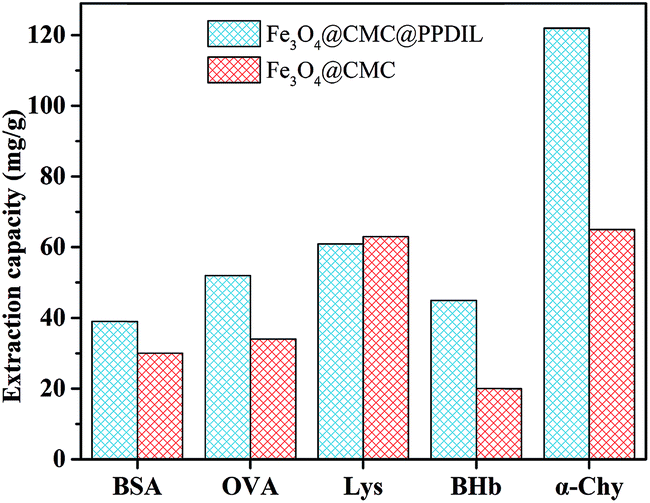 | ||
| Fig. 7 Extraction for different proteins. | ||
3.5. Analysis of α-Chy activity
The change of biological activity of analytes before and after pretreatment acts a crucial element to assess a pretreatment method. In this work, the extracted α-Chy was eluted from Fe3O4@CMC@PPDIL by phosphate buffer solution with pH value of 2. Herein, both the activity of α-Chy in the initial solution and eluent were tested, as shown in the illustration in Fig. 8. By calculation, the activity of α-Chy in the eluent keeps 91.05% of initial activity. So it is inferred that the proposed MSPE method is effective to extract α-Chy.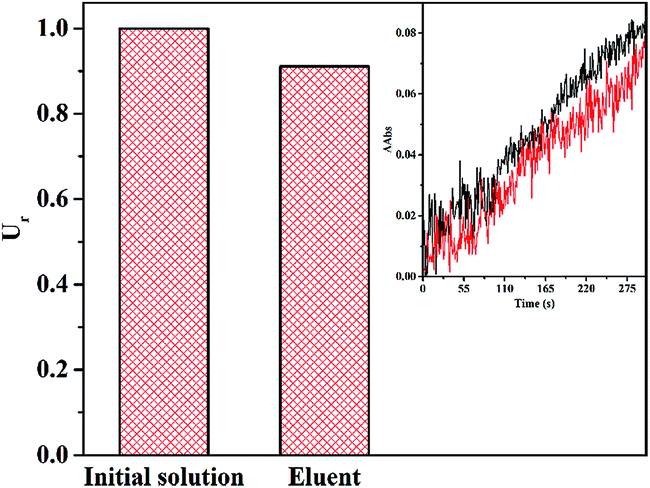 | ||
| Fig. 8 Activity of α-chymotrypsin in initial solution (A) and in eluent. | ||
3.6. Extraction stability, reproductivity and precision
Fig. 9A shows the result of stability experiment. The Fe3O4@CMC@PPDIL was synthesized and stored at room temperature and pressure. It was used in MSPE procedure every day within seven days to test the stability of this material. It's not difficult to find that there is no difference in extraction capacity as time goes by.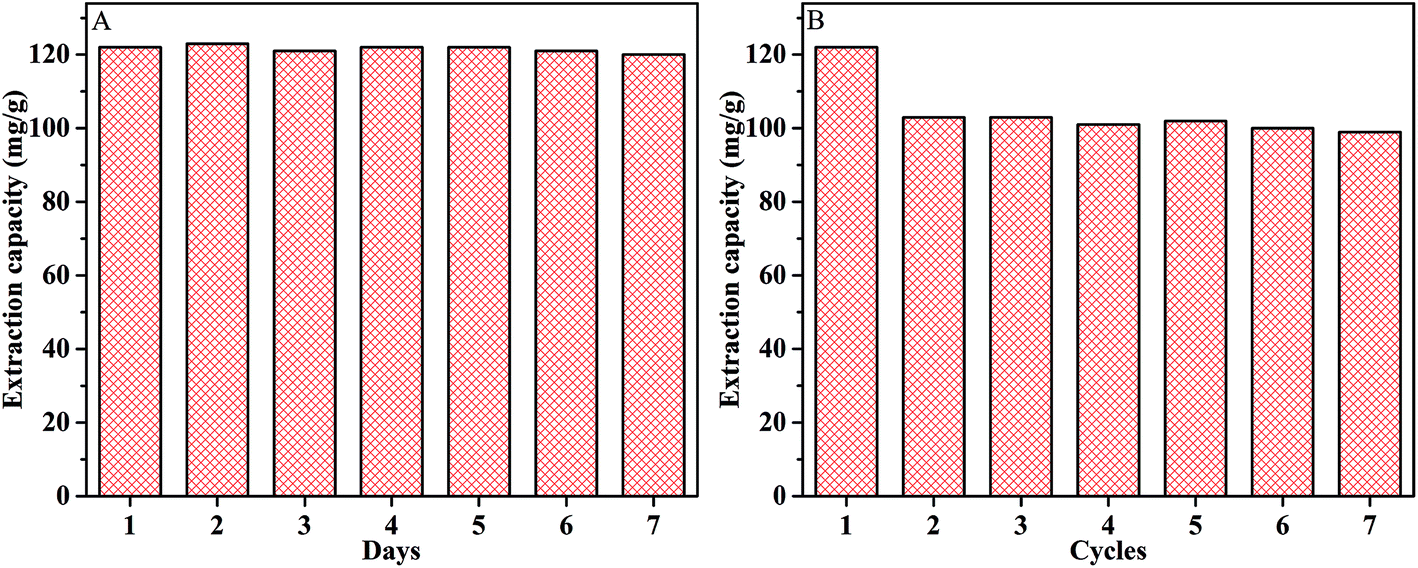 | ||
| Fig. 9 Extraction stability (A) and reproducibility (B) of Fe3O4@CMC@PPDIL. | ||
In addition, the Fe3O4@CMC@PPDIL nanocomposite was used for extraction and desorption repeatedly to study the reproductivity. The result in Fig. 9B shows that the extraction capacity for α-Chy decreases slightly in the second cycle but keeps unchanged in the next several cycles, which is still a satisfactory value of 99 mg g−1 (81.15% of the initial extraction capacity).
Besides, the precision of the Fe3O4@CMC@PPDIL-based MSPE method was also investigated. As shown in Table 1, the RSD turns out to be 0.33% in the experiments of precision, which provides a convincing proof that the proposed method is of excellent precision.
| Repeats | 1 | 2 | 3 | 4 | 5 |
| Extraction capacity (mg g−1) | 121.49 | 120.95 | 120.78 | 120.42 | 121.13 |
| RSD (%) | 0.33 |
3.7. Analysis of real sample
As α-Chy used in this work comes from porcine pancreas, the porcine pancreas crude extract was selected as the real sample in the practical part of this work. Referred to the literature,32 the porcine pancreas crude extract was prepared. The analytical result by sodium dodecyl sulfate polyacrylamide gel electrophoresis (SDS-PAGE) is demonstrated in Fig. 10. The specific band of α-Chy in the extracted real sample (lane C) obviously fades compared with the sample before extraction (lane B), which proves that Fe3O4@CMC@PPDIL indeed possesses extraction ability for α-Chy. What's more, the clearer band of α-Chy than that of other proteins in lane D implies that the purity of α-Chy can be improved through the MSPE method based on Fe3O4@CMC@PPDIL.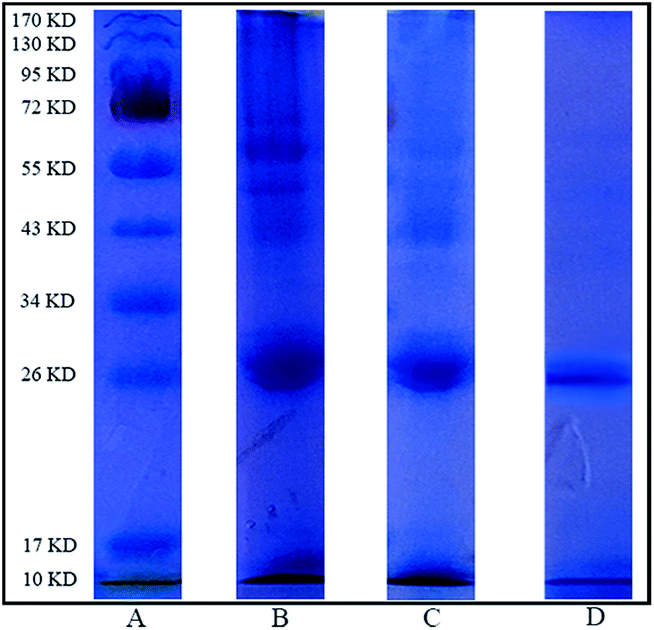 | ||
| Fig. 10 Results of SDS-PAGE analysis: protein molecular weight marker (A), porcine pancreas crude extract (B), porcine pancreas crude extract after extraction (C) and eluate from Fe3O4@CMC@PPDIL (D). | ||
4. Conclusions
In this work, a novel MSPE method based on Fe3O4@CMC@PPDIL nanomaterial was proposed and applied to the extraction of α-Chy for the first time. Compared with the other three kinds of extractants, Fe3O4@CMC@PPDIL nanocomposite possesses quite superior extraction capacity for α-Chy. Besides, after the optimization of single factor experiments, both the extraction capacity and selectivity of Fe3O4@CMC@PPDIL for α-Chy have been improved apparently. Moreover, the new MSPE method is proved to be of satisfactory stability, reproductivity and precision. And the result of real sample analysis suggests that the Fe3O4@CMC@PPDIL-based MSPE method has potential application in pretreatment of biological samples.Conflicts of interest
There are no conflicts to declare.Acknowledgements
The authors greatly appreciate the financial supports by the National Natural Science Foundation of China (No. 21375035; No. 21675048) and the Foundation for Innovative Research Groups of NSFC (Grant 21521063).References
- G. Chen, Y. Xie, H. Zhang, P. Wang, H. Y. Cheung, M. Yang and H. Sun, RSC Adv., 2014, 4, 6560–6563 RSC.
- P. Esakkiraj, B. Meleppat, A. K. Lakra, R. Ayyanna and V. Arul, RSC Adv., 2016, 6, 38611–38616 RSC.
- T. Miyazawa, K. Tanaka, E. Ensatsu, R. Yanagihara and T. Yamada, J. Chem. Soc., Perkin Trans. 1, 2001, 87–94 RSC.
- A. Szabo and M. Sahin-Toth, FEBS J., 2012, 279, 4283–4292 CrossRef CAS PubMed.
- H. Chen, Y. C. Zhu, R. J. Whitworth, J. C. Reese and M. S. Chen, Insect Biochem. Mol. Biol., 2013, 43, 701–711 CrossRef CAS PubMed.
- G. Telford, A. P. Brown, R. A. Seabra, A. J. Horobin, A. Rich, J. S. English and D. I. Pritchard, Br. J. Dermatol., 2010, 163, 523–531 CrossRef CAS PubMed.
- T. Miyazawa, S. i. Nakajo, M. Nishikawa, K. Hamahara, K. Imagawa, E. Ensatsu, R. Yanagihara and T. Yamada, J. Chem. Soc., Perkin Trans. 1, 2001, 82–86 RSC.
- C. Kim and M.-J. Kim, Bull. Korean Chem. Soc., 2013, 34, 715–716 CrossRef CAS.
- G. T. Wei, Z. Yang and C. J. Chen, Anal. Chim. Acta, 2003, 488, 183–192 CrossRef CAS.
- C. F. Poole, Trends Anal. Chem., 2003, 22, 362–373 CrossRef CAS.
- M. J. Trujillo-Rodríguez, V. Pino, E. Psillakis, J. L. Anderson, J. H. Ayala, E. Yiantzi and A. M. Afonso, Anal. Chim. Acta, 2017, 962, 41–51 CrossRef PubMed.
- S. Ma, M. He, B. Chen, W. Deng, Q. Zheng and B. Hu, Talanta, 2016, 146, 93–99 CrossRef CAS PubMed.
- M. Khan, E. Yilmaz, B. Sevinc, E. Sahmetlioglu, J. Shah, M. R. Jan and M. Soylak, Talanta, 2016, 146, 130–137 CrossRef CAS PubMed.
- E. Fernández, L. Vidal and A. Canals, J. Chromatogr. A, 2016, 1458, 18–24 CrossRef PubMed.
- J. Chen and X. Zhu, Food Chem., 2016, 200, 10–15 CrossRef CAS PubMed.
- S. Mahpishanian and H. Sereshti, J. Chromatogr. A, 2016, 1443, 43–53 CrossRef CAS PubMed.
- Y. Tao, D. Su, Y. Du, W. Li, B. Cai, L. Di, L. Shi and L. Hu, RSC Adv., 2016, 6, 109730–109741 RSC.
- C. Wu, G. Zhu, J. Fan and J. Wang, RSC Adv., 2016, 6, 86428–86435 RSC.
- L. C. dos Reis, L. Vidal and A. Canals, Anal. Bioanal. Chem., 2017, 409, 2665–2674 CrossRef PubMed.
- M. A. Habila, Z. A. ALOthman, A. M. El-Toni, S. A. Al-Tamrah, M. Soylak and J. P. Labis, Microchim. Acta, 2017, 1–7 Search PubMed.
- Y. Huang, Y. Wang, Y. Wang, Q. Pan, X. Ding, K. Xu, N. Li and Q. Wen, RSC Adv., 2016, 6, 5718–5728 RSC.
- L. Liu, D. Liu, M. Wang, G. Du and J. Chen, Eur. Polym. J., 2007, 43, 2672–2681 CrossRef CAS.
- V. V. Alange, R. P. Birajdar and R. V. Kulkarni, J. Biomater. Sci., Polym. Ed., 2017, 28, 139–161 CrossRef CAS PubMed.
- I. Pacheco-Fernández, A. Najafi, V. Pino, J. L. Anderson, J. H. Ayala and A. M. Afonso, Talanta, 2016, 158, 125–133 CrossRef PubMed.
- S. Wang, Q. X. Shi, Y. S. Ye, Y. Xue, Y. Wang, H. Y. Peng, X. L. Xie and Y. W. Mai, Nano Energy, 2017, 33, 110–123 CrossRef CAS.
- B. Wu, Z. W. Zhang, M. H. Huang and Y. Peng, RSC Adv., 2017, 7, 5394–5401 RSC.
- Q. Yang, Y. Wang, H. Zhang, K. Xu, X. Wei, P. Xu and Y. Zhou, Talanta, 2017, 174, 139–147 CrossRef CAS PubMed.
- S. Sitthichai, C. Pilapong, T. Thongtem and S. Thongtem, Appl. Surf. Sci., 2015, 356, 972–977 CrossRef CAS.
- Q. P. Liu, X. D. Hou, N. Li and M. H. Zong, Green Chem., 2012, 14, 304–307 RSC.
- J. Ge, Y. Hu, T. Zhang and Y. Yin, J. Am. Chem. Soc., 2007, 129, 8974–8975 CrossRef CAS PubMed.
- D. V. Volodkin, R. von Klitzing and H. Mohwald, Angew. Chem., Int. Ed. Engl., 2010, 49, 9258–9261 CrossRef CAS PubMed.
- K. Xu, Y. Wang, Y. Li, Y. Lin, H. Zhang and Y. Zhou, Anal. Chim. Acta, 2016, 946, 64–72 CrossRef CAS PubMed.
Footnote |
| † Electronic supplementary information (ESI) available. See DOI: 10.1039/c7ra09434e |
| This journal is © The Royal Society of Chemistry 2017 |