 Open Access Article
Stability of liquid bridges with elastic interface
Paulo Hoyera and
Vladimir Alvarado *ab
*ab
aUniversity of Wyoming, Department of Petroleum Engineering, 1000 University Ave, Laramie, Wyoming 82071, USA. E-mail: valvarad@uwyo.edu
bUniversity of Wyoming, Department of Chemical Engineering, 1000 University Ave, Laramie, Wyoming 82071, USA
First published on 23rd October 2017
Abstract
Low salinity waterflooding (LSWF) has been proposed as way to increase oil recovery. Albeit various proposed mechanisms for LSWF improved oil recovery, no consensus exists currently. Alvarado et al. showed that a strong correlation between incremental oil recovery and high interfacial viscoelasticity exists. This interfacial response to LSWF has been proposed to hinder snap-off. Our work provides compelling evidence that snap-off suppression correlates with crude oil–water interfacial elasticity (IFE) and interfacial tension (IFT). The proposed mechanisms is tested using a novel fluid bridge setup. IFT and IFE were measured in deionized water containing either sodium chloride or/and sodium sulfate. Bridge experiments were conducted with the same oil-aqueous phase combinations as those used in IFT experiments. The bridge geometry was tracked while the oil was pumped out until bridge failure. The critical neck diameter (CND), corresponding to the minimum neck diameter before snap-off, represents our stability proxy. Results show that as the interfacial elasticity increases over time, the bridge becomes more resilient against deformation. This behavior is explained by adducing that a decreasing local interfacial area produces a larger IFT drop, if the IFE increases. The smaller IFT lowers the bridge fluid's pressure gradient, consequently decreasing the fluid pump-out action. This is the first time, to the best of our knowledge, that a fluid bridge has been used to evaluate the stability of an elastic interface. The technique has potential broader impacts, including the understanding of biological membranes and enhanced oil recovery, among others.
Introduction
Low-salinity waterflooding has been studied as a method to improve oil recovery for more than 50 years.2 However the understanding of the mechanisms responsible for the additional oil extraction over traditional waterflooding remains a challenge. During the last two decades, much attention has been given to rock–fluid interactions to explain why low-salinity water enhances crude oil production in certain reservoirs.3–15Despite a currently assumed good correlation between wettability alteration and oil recovery,13 this is a limited view on intricate fluid–fluid–rock interactions occurring during multiphase flow processes in porous media, as it focuses only on fluid–rock mechanisms. In contrast to this point of view, Rücker et al.16 show that fluid–fluid processes, the so-called ganglion dynamics, can be as relevant to fluid flow as fluid–rock processes including early stages of forced imbibition, in the so-called connected pathway process. During the final stages of the forced imbibition, ganglion dynamics becomes dominant over the connected pathway process in terms of controlling the fate of trapped ganglia in porous media, namely to determine the residual oil saturation.
According to Rücker et al.,16 during forced imbibition, ganglion dynamics is controlled by the non-wetting phase ganglia snap-off and coalescence events occurring with different frequencies for each stage of the process. The difference between the snap-off and coalescence events determine the number of non-wetting phase ganglia formed. During the initial stage, the frequency of snap-off and coalescence events is high and ganglia become larger and more mobile. During the final stage snap-off events still occur, but coalesce events decrease in frequency and the ganglia turn out smaller and less mobile. Consequently, the competition between snap-off and coalescence can dramatically impact the resulting oil recovery. In this sense, if snap-off can be suppressed, the ganglia will remain mobile during flooding and more oil will likely be produced.
The influence of water and oil chemical properties on coalescence has been well studied.17–28 Several authors have correlated model oils (or crude oils)–brines interfacial rheology with emulsion stability. Sjöblom et al.23,28 present a good correlation between interfacial visco-elasticity and oil emulsion stability in the case of an asphaltenic model oil, for a range of asphaltene concentration, solvent aromaticity, water pH, ageing time and nonionic surfactant concentration. Yarranton et al.19,20 concluded that a similar emulsion behavior under different values of temperature, surface area, ageing time, and type of solvents occurs for model oils containing asphaltenes. Banerjee et al.26 studied asphaltene adsorption onto the oil–water interface at very low asphaltene concentration in model oils. They showed that a critical asphaltene surface concentration exists that leads to an interfacial elasticity transition. The value of concentration at which the interfacial elasticity changes is denominated the glass transition point. Kilpatrick et al.18,21 show that a correlation between interfacial rheology and emulsion stability exists under different conditions of solvent blending and ageing time. Wang and Alvarado22 probed the water-in-crude oil emulsion stability using electrorheology for high- and low-asphaltene content crude oils and different cations in the aqueous phase. They showed that divalent cations in water and higher asphaltene concentration lead to stronger emulsions under a destabilizing electric DC field under shear-rheological conditions. Alvarado et al.24 tested the effect of salinity on water-in-crude oil emulsions through drop-size distribution. They compared the effects of high and low salinity of synthetic reservoir brines along time and discovered that emulsions are more stable at lower aqueous phase ionic strength.
As aforementioned, the scientific literature is relatively rich on how coalescence of crude oil dispersed in water is suppressed in low-salinity environments and how this phenomenon correlates to interfacial elasticity. However, the other side of the ganglion dynamic problem, i.e. crude oil ganglia snap-off, is not known well. Although the interface breakup is well studied,2,29–39 just a few publications discuss snap-off of interfaces with enhanced elasticity. Zhao et al.40 use a microfluidic device to examine the influence of interfacial elasticity on droplet breakup modifying the interfacial rheology with designed peptide surfactants. They were able to correlate the dimensionless droplet size with a dimensionless group that combines flow rate ratio, interfacial tension and interfacial elasticity. Alvarado et al.1 performed coreflooding, shear interfacial visco-elasticity, and microfluidic droplet generator experiments, to show effects of interfacial elasticity on snap-off. The study showed that oil recovery, interfacial visco-elasticity and produced droplet size increase with ageing time, asphaltene concentration in the crude oil and brine dilution. In a previous publication,41 we proved theoretically that the break-up time of an inviscid droplet in a constricted capillary increases with the ratio between the dilational elasticity and the interfacial tension.
This work shows both qualitatively and quantitatively the correlation between interfacial elasticity and snap-off suppression through a liquid bridge stability assay. The experiment consists in deflating the bridge with its extremities immobile until the interface's break up. Meseguer et al.42 used a similar procedure to study interface stability and called it liquid bridge stability limit of minimum volume. In the present study, we use a similar technique to test crude oil–water interfaces that have more complex behavior. The crude oil filament immersed in water is tested at different ageing times and for various values of water salinity, salt types and geometries. Implications of snap-off suppression on capillary trapping during imbibition will be discussed.
Experimental section
A drop-shape tensiometer from First Ten Angstrom model FTA 1000, shown in Fig. 1, is used to perform pendant drop experiments with which interfacial tension and interfacial visco-elasticity can be determined. Additionally, liquid bridge stability experiments are conducted using the same apparatus basic setup with the addition of a two-needle configuration. The instrument is basically composed of a camera Appro black and white BV-7105 attached to a lens Navitar 1-60135, a chamber to control the temperature of a cuvette containing the aqueous phase into which the pendant oil droplet or the oil bridge is immersed, depending on the experiment type. A back light illuminates the pendant drop or bridge through a circular window to allow the camera to capture the image. A J-shaped needle gage 20 is necessary to create an inverted pendant due the lower oil density compared to water density. In the case of the bridge stability experiment, two straight gage 18 needles are used. The bottom one is positioned upwards and has no duct inside, i.e. it has a flat top surface. The upper needle has a duct that connects the bridge with the oil syringe. This syringe is controlled by a motor pump.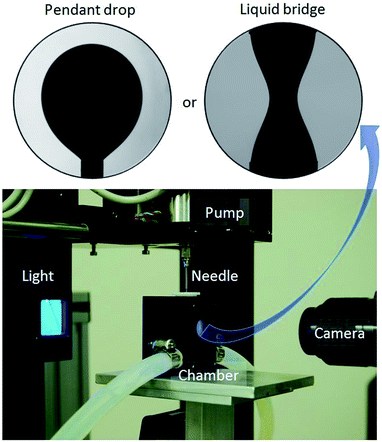 | ||
| Fig. 1 Drop shape tensiometer used to measure interfacial tension, interfacial visco-elasticity, and to conduct fluid bridge stability experiments. | ||
Pendant drop experiment
The droplet is created by imposing a flow rate of 1 [μL s−1] and the final drop volume is approximately 45 [μL]. The interfacial tension is calculated by fitting the drop shape with the solution of the ordinary differential equation derived from a force balance between the drop buoyancy and the capillary forces given by the Young–Laplace equation.44 If the area of a droplet with a viscoelastic interface is oscillated with pre-selected frequency and amplitude, the interfacial tension oscillates with the same frequency, but with delay in the amplitude. The area and interfacial oscillation curves generated are used by the First Ten Angstroms FTA 1000 Analyzer System to calculate the interfacial viscous and elastic moduli.Liquid bridge experiment
The liquid bridge is an oil column formed between to needle tips immersed in a brine. Its initial geometry is approximately cylindrical due to a small bond number and a small slenderness ratio. If the initial bridge diameter is equal to the external needle diameter D, and the bridge length is L, the slenderness ratio is defined as Λ = L/D. A large slenderness ratio relates to a more unstable bridge. Two values of the slenderness ratio are used in the experiments, namely Λ = 1 and 2 for the short and long bridges, respectively. The bond number represents the ratio between gravitational and capillary forces. For our experiments, the radial bond number is roughly 0.01, if we consider Bo = gΔρ(D/2)2/σ, where g is the gravity acceleration, Δρ is the density difference between water and crude oil, and σ is the interfacial tension.To enable the creation of the oil bridge, the top needle must be aligned with bottom one. The top needle is centered by a perforated Teflon lead and the bottom needle is mounted on a Teflon base that goes inside the cuvette. The short bridge is created firstly positioning the needles at L = D and then dispensing the oil until the droplet from the upper needle touches the bottom needle surface. The bridge is formed quickly if the bottom needle surface is pre-wetted with oil. The long bridge is created initially as a small bridge, and then a sequence of oil pump-out and top needle small upward movements is conducted until the distance between needle surfaces is L = 2D. In both cases, enough oil should be dispensed after the bridge creation until it is essentially cylindrical. For both cases, i.e. short and long bridge experiments, the ageing time is measured just after the bridge is created, namely when the oil droplet touches the bottom needle surface.
After a certain ageing time, the bridge is deflated very slowly by pumping in the oil back to the syringe at a flow rate of 0.1034 [μL s−1] until the bridge breaks up. The process is recorded by the camera at a frequency of 7.5 frames per second. The acquired images are used to measure the bridge neck diameter along the entire process. At the beginning, the neck diameter changes slowly, but at the end of the pumping process, i.e. during the neck breakup, the diameter decreases rapidly. For practical reasons, we stipulate that the neck diameter is zero when the bridge is broken. The first picture with neck diameter zero is related to the ultimate bridge diameter. We also specify that the critical neck diameter (CND) is the antepenult bridge diameter.
Materials
The experiments are performed with a crude oil (Gibbs) from Wyoming with a density 0.906 [g per cc] and C5-asphaltene content of 10.33 [%], and brines prepared dissolving analytical-grade NaCl and Na2SO4 in deionized water. Both 100% NaCl and 100% Na2SO4 brines have the same ionic strength of 0.6724 M. A different percentage index for a certain brine represents a given fraction by dilution of a 100% brine of that salt.Results
Process until bridge stabilization
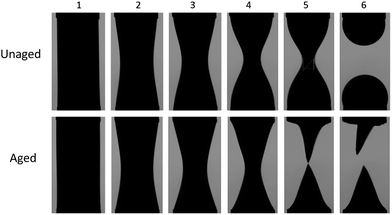
First, long-bridge experimental results are presented (Fig. 2). If the interface is not allowed to age, it remains unaffected. If the oil from the bridge is retired at this point, the behavior is very similar to that of an unenhanced interface bridge and the Critical Neck Diameter (CND) value is approximately the same as what theory predicts when the interfacial tension is equal to a constant value. However, after a sufficiently long ageing time, the breakup process is altered. At the beginning, both unaged and aged bridges shapes develop similarly, but after a certain time, the aged bridge depresses in regions close to the needles and the overall bridge profile diameter decreases along the bridge length. A pronounced narrowed neck forms that chokes later in the process.After the neck breakup, the difference between unaged and aged interfaces is quite apparent (Fig. 2). While the bridge with an unaged interface produces two hemi-spherical surfaces, the bridge with the aged interface produces two conical surfaces. The unaged interfaces present axisymmetric surface stress state while the aged interfaces have an anisotropic surface stress state. It is interesting to notice that the more elastic droplets sustain their shape, including the tips, long after the breakup events have ended. The sharp tips represent regions with a singularity at the surface radius. This observation implies that the bridge surface alteration modified completely the surface stress state along the oil pump-out process.
Observation of the neck diameter time evolution shows that only the aged interface (more elastic) case produces a stable bridge until the neck diameter is near zero, as shown in Fig. 3. This provides direct experimental evidence that a more elastic fluid–fluid interface suppresses the potential of snap-off. This observation has a tremendous impact on ganglion dynamics during low-salinity water forced imbibition (waterflooding) in porous media with asphaltenic crude oil. If this stabilizing mechanism were to occur in porous media, oil ganglia would remain connected more effectively during the oil production process. The connected crude oil pathway continues mobilizing oil under the influence of viscous forces associated to the surrounding displacing fluid. On the other hand, the crude oil ganglia have their size decreased more slowly during the imbibition process and the ganglion dynamic process mobilize the discontinuous phase for longer. The result is fewer crude oil ganglia are trapped and lower residual oil saturation is obtained.
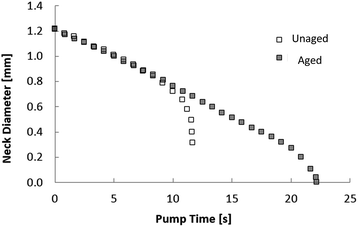 | ||
| Fig. 3 Neck diameter evolution for unaged and aged interface cases. Note how fast the unaged interface bridge breaks up and that the enhanced-elasticity interface bridge is stable for longer. | ||
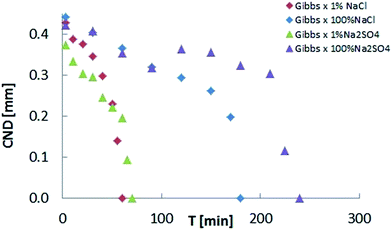
Upon confirmation of the stabilizing effects of interfacial elasticity, the next step is to understand how this happens and whether other physical parameters are involved in the process. To this end, we plot the CND against the interfacial elasticity for various ageing time. The effect of electrolyte dissolution on long bridge stability was initially tested using NaCl brine at two concentration values (1% and 100%). Results are depicted in Fig. 4. The oil bridge immersed in 1% NaCl brine reached a CND = 0, i.e. its stability limit, faster than the one immersed in the 100% NaCl brine. In other words, the lower salinity aqueous phase produced a stable liquid bridge faster than the high salinity case. Since two-phase flow in porous media is highly dynamic, the rate needed to stabilize the non-wetting phase highly influences its mobilization and production.
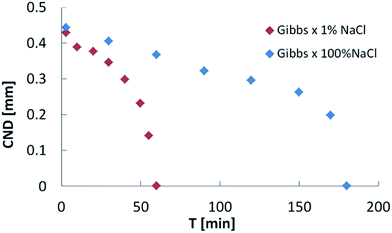 | ||
| Fig. 4 Critical neck diameter (CND) vs. ageing time for low (1% NaCl) and high (100% NaCl) salinities. The low-salinity case becomes stable (CND = 0) three time faster that the high salinity case. | ||
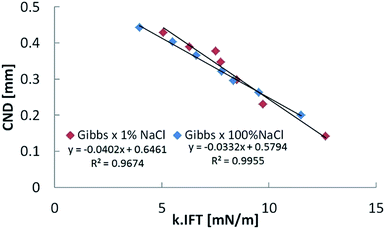
Analysis of interface breakup yields a linear relationship between the CND and the relative interfacial elasticity acting at the neck interface, k, as shown in Fig. 5. k is given by the following relationship:
 | (1) |
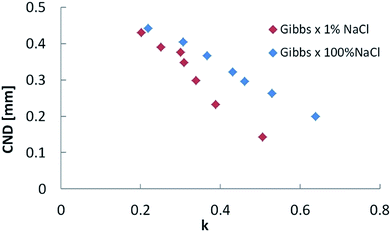 | ||
| Fig. 5 Critical neck diameter (CND) as a function of relative interfacial elasticity (k) for low (1% NaCl) and high (100% NaCl) salinities. | ||
The direct effect of IFT on CND can be eliminated, as Fig. 6 shows. By plotting CND as a function of the k × IFT product, the two cases corresponding to 1% and 100% NaCl trends overlap. This latter result shows that the response of crude oil filaments exposed to aqueous phases with the same ion types can be made more universal by parametrizing with a combination of interfacial elasticity and interfacial tension, provided the initial bridge diameter is the same. In porous media, we speculate that the pore throat geometry would be one parameter to consider when analyzing the snap-off effect during waterflooding.
Results to this point demonstrate that low-salinity water is more efficient at suppressing snap-off of an asphaltenic crude oil. On the other hand, effects of different ions in solution have been reported. To establish a comparison between chloride and sulfate anions, experiments with 1% and 100% Na2SO4 were performed with the long bridge setup (Fig. 7). Surprisingly, the ageing time necessary for the bridge to become stable was larger for sodium sulfate. In contrast to NaCl cases, the 1% salinity CND result for Na2SO4 differs less from its corresponding 100% salinity case.
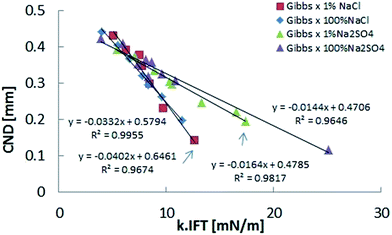
Fig. 8 depicts the CND dependence on k × IFT, as previously shown in Fig. 6, but the sodium sulfate results have been added. As in the case of sodium chloride, this representation eliminates the salinity dependence, but highlights the dependence on specific ions, since the trends are apparently different, with NaCl slope being larger. We suspect that this results from the influence of the dilation along the axial direction (Fig. 9).
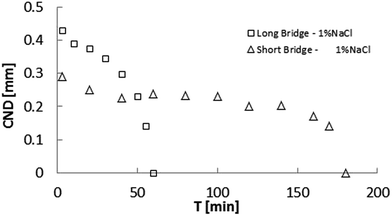 | ||
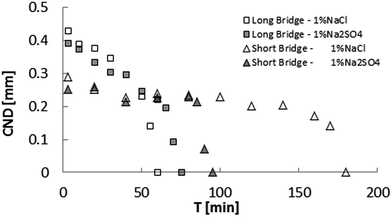
| Fig. 9 Comparison of critical neck diameter (CND) for low 1% NaCl for long (Λ = 2) and short (Λ = 1) bridges. The stabilization (CND = 0) time is 3 times greater for the short bridge. | ||
In view of the suspected influence of axial deformation, the experiments were repeated with the short bridge, which yielded smaller CND, confirming higher stability. Additionally, the bridge immersed in 1% NaCl brine took longer to attain stability (time to reach CND = 0).
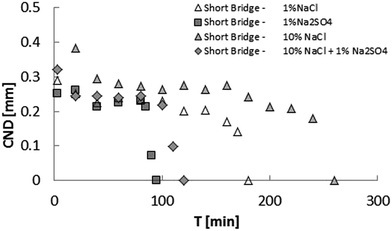
On the other hand, for the short bridge experiments, the bridge immersed in 1% Na2SO4 brine took almost half the time of the 1% NaCl case to stabilize (as shown in Fig. 10). Since both brines contain the same concentration of sodium cations, this result shows that the interface formed in the presence of sulfate is more resistant than the that formed in the presence of chloride, when the surface geometrical transformation is under severe stretching.
The same behavior happens for a high ionic strength aqueous phase. It is worth mentioning that the short bridge immersed in 1% Na2SO4 brine stabilized faster than the short bridge immersed in 1% NaCl brine.
The next results are intended to show what happens with the short-bridge stability when mixed brines are tested. Although the 10% NaCl brine case reaches elastic stability slower than the 1% NaCl one, when a small quantity of sodium sulfate is added, the elastic stability is reached much faster than 1% NaCl brine case. This surprising result proves that sulfate changes the mechanical behavior of the crude oil–water interface dramatically and can shed light on the reasons why some corefloodings experiments using sulfated water yield high recovery factor.43
Process after bridge stabilization
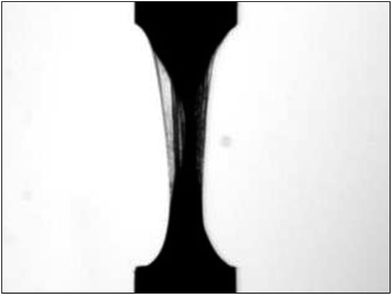
When the bridge is aged for longer than the stabilization time (when CND = 0), it is necessary to continue removing oil from it to force the bridge breakup. If the ageing time is such that it produces a solid-like film, as the case shown on Fig. 12, the bridge continues deflation wrinkles and folds up the interface such that the bridge becomes stable even with a tiny remaining volume of oil.The stabilization caused by the solid-like film is so strong that the oil can be pumped in and out the bridge for an indefinite number of times without breaking it. The bridge acts like a thin-walled tube inside which the oil flows towards the smaller pressure region without direct contact with the external fluid. This scenario is radically different from the initially considered fluid–fluid system defined by the liquid bridge. Analogously, flow in a porous media would evolve to a different complex fluid system in which the non-wetting phase would flow inside a thin-walled capillary network surrounded by the wetting phase.
Underlying mechanisms and downscaling
Process until bridge stabilization
The adaptation of a pendant drop apparatus to the liquid bridge experiment was very simple, but allowed us to access unprecedented relationships between crude oil/water interfacial rheology and interfacial stability with the same apparatus. Important parameters, such as ageing time and surface-to-volume ratio, were easily equalized for the two experiments. Besides, the equality of complementary parameters, such as applied temperature and image acquisition frequency, was guaranteed because the instrument calibration was maintained during all the experiments.The adoption of the critical neck diameter (CND) as a stability parameter allowed us to bypass complications related to high interface velocity achieved by the interface when it is about to breakup. However, it should be noted that CND is a camera velocity-dependent parameter. Therefore, the frame grabbing rate was the same for all the stability experiments.
The interface is subjected to a two different processes. The first is ageing, in which a structured film is formed, the interfacial tension decreases, and interfacial elasticity increases. During this stage, the surface stress remains equal to the interfacial tension because there is no surface deformation. The second process is the bridge's deflation. At this point, due to the presence of the elastic film, negative circumferential and positive longitudinal strains induce compressive circumferential and extensional longitudinal surface stresses.
The basic result shown in the previous section is that the bridge stabilization is caused by interface elasticity. This is direct experimental proof that interfacial elasticity does suppress snap-off. The important consequence of this relates to the way crude oil–water flows through porous media is understood. Until now, wettability alteration has been considered the dominant mechanism responsible for changes in irreducible oil saturation during smart waterflooding. Our results add strong evidence that snap-off suppression is a direct consequence of liquid–liquid interfacial dynamics, i.e. elasticity, and represents an alternative mechanism to oil mobilization.
An aged bridge is more stable due to the lower capillary pressure gradient along its length. During the deflation process, the surface stress follows the bridge diameter. So, via Young–Laplace equation, we can see that the pressure acting on the fluid surrounded by the neck is not necessarily larger than that near the boundaries defined by the needles. On the other hand, this is not true for a situation when the interfacial tension is constant with surface area changes. In this case, the pressure of the fluid surrounded by the neck is inversely proportional to the decreasing neck diameter and the fluid is pumped out toward the bridge ends, causing its eventual instability and breakup.41
Our results also show that bridges with the same interfacial dilational elasticity can present distinct stability. This is the case of bridges immersed in brines contained different electrolytes (Fig. 8). This behavior provides clues to indicate that another material parameter, besides the interfacial dilational elasticity, is also affecting the interfacial rheology and consequently the bridge stability.
Since the bridge's deflation imposes an anisotropic deformation to the interface, we will expand the scope of the analysis by using the two dimensional Hook's law. The latter takes into account two material parameters. One of them is the dilational modulus K. The other parameter, the surface Poisson's ratio ν, which combines linearly circumferential and longitudinal strains εθθ and εxx to define the surface stresses in those principal directions. Hook's law for surfaces relates the principal surface stresses σθθ and σxx to the surface strains εθθ and εxx as follows:
 | (2) |
The surface Poisson's Ratio, ν, should be in the range −1 < ν < 1, in contrast to the three-dimensional Poisson's ratio ν3D, which must follow the condition −1 < ν3D < 1/2. ν can be determined experimentally using a special pendant drop method proposed by Danov et al.45 However this method is not commercially available yet.
The different behavior of the bridges immersed in sodium sulfate and sodium chloride, shown in Fig. 8, can be related to the difference of surface Poisson's ratios generated by each electrolyte.
The Poisson's ratio can also help to explain the difference between the results of the long and short bridges. Fig. 11 suggests that the presence of sulfate in a sodium chloride brine promotes changes to ν of the bridge interface, making it more stable. Given a certain neck diameter, the short bridge experiment imposes a larger longitudinal deformations on the interface, i.e. a larger longitudinal strain εxx. Since εxx > 0 and εθθ < 0, eqn (2) implies that the circumferential surface tension σθθ will be smaller and the longitudinal tension σxx will be larger. The bigger the value of the Poisson's ratio, the larger the difference between the surface stress state at the interface of the bridge neck for long and short bridges.
Another possibility to find the surface Poisson's ratio is through the relation ν = (K − G)/(K + G), where G is the interfacial shear modulus. However, the experimental setup used to measure G should be calibrated such that the surface area-to-oil volume ratio is as close as possible to that of the liquid bridge stability experiment. Nonetheless, the maturity of the interface of both experiments could still present some differences due to the impact of other experimental inconsistencies. For example, the device that measures shear modulus uses a planar interface which has an intrinsic diffusive time scale different from the one of a cylindrical interface of the bridge.46
Using the dilational and shear interfacial moduli, the eqn (2) becomes:
 | (3) |
Note that this equation is valid while the interface works in the linear region of surface deformation and until the surface reaches the CND point, when the interface's displacement can still be considered quasi-static.
If the extensional deformation suffered by the interface along the longitudinal direction stretches it beyond the yield point, the interface will be damaged. After this point, the interface loses its ability to respond to deformation linearly and behaves more like a clean interface with lower stability. Another plausible explanation for the different behavior of the bridges immersed in sodium sulfate and sodium chloride is that sodium sulfate brine promotes a larger velocity of the interface immersed in sodium sulfate in “healing” after reaching the yield point, i.e. the capacity that the constituents of the interface have to crosslink again and rebuild an elastic film. In this case, Fig. 11 indicates that sodium sulfate can enhance the “healing” capacity of the interface even in the presence of sodium chloride.
Beyond the CND point, since the radial velocity of the bridge increases dramatically, causing the rate of interfacial strain ![[small epsi, Greek, dot above]](https://www.rsc.org/images/entities/i_char_e0a1.gif) to affect the bridge stability process, the interfacial dilational and shear viscous moduli, K′′ and G′′, should be taken into account. In this case, the surface stress state is related to the surface strain state with the following relations:47
to affect the bridge stability process, the interfacial dilational and shear viscous moduli, K′′ and G′′, should be taken into account. In this case, the surface stress state is related to the surface strain state with the following relations:47
 | (4) |
The importance of the interfacial dilational and shear viscous moduli is that they increase in a dynamic environment where the interface can suffer sudden changes, e.g. when Hayne's jump takes place. In this case, the interfacial viscosity acts, increasing the interface's stability.
We should also note that the interfacial visco-elastic parameters can change substantially with velocity of the interface since they are subject to processes such as diffusion and adsorption of molecules and aggregates. As is known, the viscoelastic properties of the interface are frequency-dependent. For example, if we consider diffusion controlled interfaces,49 the interfacial dilational elasticity K presents a maximum at moderate interface velocities and decreases for high velocities, while the interfacial dilational viscosity K′′ increases with velocity and reaches a plateau value for higher velocities. At large velocities, the interfacial dilational viscosity value can surpass the interfacial dilational elasticity.
Now, we analyse the case where CND = 0. At the initial bridge cylindrical geometry, the pressure jump through the water–oil interface is Δp = p0 − pw = σ/R where R is the bridge radius. When CND = 0 (Fig. 2, image aged 6), a cone is formed. The Young–Laplace equation for this case is ΔpCND = po,CND − pw = σθθ(x)/r(x) + σxx(x)/∞ = σθθ(x)/r(x), where x is the distance from the tip of the triangular droplet. The curvature of the cone surface is r(x) = 2x/LRa, were L is the bridge length, and  for the long bridge, and
  for the small bridge. So, the surface stress in the azimuthal direction is proportional to the distance from the tip, i.e., σθθ(x) = 2x/LRaΔpCND. In particular, at the tip of the triangular drop σθθ(0) = 0, and at the basis of the triangular drop, σθθ(L/2) = ΔpCNDRa. In other words, the surface stress at azimuthal direction at the tip is necessarily zero and at the drop basis, it depends on the bridge length, needle radius, and ΔpCND.
Notice that during the deflation process the bridge's surface area changes differently from the tip to the base, generating a gradient on surface concentration, which will lead to a Marangoni effect until the droplet becomes round again.
Process after bridge stabilization
If the bridge is allowed to age beyond the time when CND = 0, Fig. 12, wrinkles appear at the bridge neck before its diameter is zero. The older the interface, the sooner the wrinkles appear when the bridge is deflated. As aforementioned, when CND = 0 the azimuthal tension σθθ at the tip of the triangular drop is zero. When the bridge is aged for longer than the stabilization time, i.e. when CND = 0, the interface becomes so elastic that the circumferential stress becomes negative before the bridge neck reaches zero diameter. If the module of compressive surface stress is greater than the critical buckling surface stress, the interface buckles and wrinkles are formed. The typical time scale for the critical buckling stress can be estimated by the equation of the isotropic case48 σθθ,crit = 1/4E/(1 − ν2)t4/R4, where t the film thickness. In our case, t ≪ R, so the critical buckling stress σθθ,crit ≅ 0.50,51The first wrinkling mode has a wavelength Wc given by Wc = 16π2Et2LW/θxx, where LW is the wrinkle length.52 This equation shows that when small and large bridges have the same wrinkle length, the small bridge presents a smaller wrinkle wavelength than the large bridge.
We observed that if a wrinkled bridge is allowed to rest, the wrinkles tend to disappear after a while indicating that the interface molecules tend to rearrange to revert the surface bending.
One or more of the interfacial properties can be the reason why bridges immersed in brines containing sodium sulfate are more stable for the short bridge case. Since the short bridge test imposes a more severe longitudinal extensional deformation than the long bridge, sodium sulfate brine could generate an interface with a bigger yield point than sodium chloride brine. On the other hand, the presence of sodium sulfate in water could generate an interface with a lower Poisson ratio or with a different buckling limit. Nevertheless, we resort of linear moduli to explain the behavior of the interface, even if the interfacial deformation is beyond the linear region, an analogue analysis can be made to compare two types of interfaces.
When the crude oil–water interface is aged for much longer than the necessary time for stabilization of the bridge (CND = 0), the interfacial viscoelastic moduli becomes so high that before the bridge neck reaches diameter zero, the circumferential stress σθθ becomes negative. If the absolute value of circumferential stress is greater the buckling stress, or |σθθ| > σθθ,crit, the interface buckles and wrinkles appear. In this extreme case, the interface is so elastic that it behaves like a solid membrane. Surprisingly, the bridge can be almost totally deflated and the membrane will still remain connected to the needles. If we reinject oil into this empty, wrinkled, collapsed, transparent, thin walled tube, the bridge reconstitutes its previous form.
Downscaling
We speculate on the impact of downscaling the bridge to micrometer scale. First, the critical buckling stress will be much higher, since it is inversely proportional to the bridge radius to the fourth power. This implies that the circumferential stress can reach much higher compressive values and make the bridge even more stable. Second, since the specific surface is inversely proportional to the bridge radius, the mass of indigenous crude oil surfactants that can form the elastic interface, e.g. asphaltenes, can be depleted before a strong elastic interface develops.53 In this case, the asphaltene content should be higher to stabilize a micrometer crude oil bridge at the same time as a millimeter-scale crude oil bridge. If the bridge is confined by a small volume of brine, the electrolytes can be subject to depletion too. In this case, the bridge can behave as if being immersed in a lower concentration brine. Third, the higher bridge curvature can affect the diffusion process of asphaltenes to the interface.46,53,54Closing remarks
Low salinity waterflooding has been proposed for decades as a cost-effective method to increase oil recovery. Many authors have relied on wettability alteration to explain why forced imbibition of water with lower electrolytes content reduces the residual oil saturation. However, recent experiments using synchrotron-based X-ray visualization of two-phase flow16 in porous media showed that ganglion dynamics dominates over connected pathway flow; i.e. the volume of oil mobilized by capillary forces, mainly due to snap-off and coalescence, is bigger than that generated by viscous forces. Now, if snap-off is suppressed, the number of trapped oil ganglia decreases, and so the irreducible oil saturation. We qualitatively and quantitatively showed that low salinity water suppresses snap-off of a given crude oil bridge. This suppression, quantified by the critical neck diameter, is dependent of the interfacial tension, the interfacial elasticity moduli, the liquid bridge aspect ratio or slenderness, and the electrolyte type. In addition, we showed that sodium chloride stabilized longer bridges faster while sodium sulfate was more efficient to stabilize smaller bridges. Besides, crude oil bridges immersed in sodium sulfate brines where more stable when more severe axial positive strains were applied, which happens in high pore to throat ratio cases. Interestingly, sodium sulfate stabilizes the interface even in presence of sodium chloride. In this case, relatively higher ionic strength blends of sodium sulfate and sodium chloride brines suppressed snap-off better than pure low salinity sodium chloride indicating that the presence of sulfate is important for waterflooding. The fundamental changes in the bridge stability indicate that the behavior of an aged crude oil–water flow in a porous media can be radically different from the one where pure oil and water are considered. The implication of this is significant due the fact that the multiphase flow through porous media theory, mostly used in the oil industry, considers a clean fluid–fluid interface model.Conflicts of interest
There are no conflicts to declare.References
- V. Alvarado, M. Moradi Bidhendi, G. Garcia-Olvera, B. Morin, and J. S. Oakey, in SPE Improved Oil Recovery Symposium, April, 2014 Search PubMed
.
- O. R. Wagner and R. O. Leach, Trans. AIME, 1959, 216(01), 65–72 CrossRef
.
- N. C. Wardlaw, J. Can. Pet. Technol., 1982, 21(03), 21–27 CrossRef CAS
.
- I. Chatzis, N. R. Morrow and H. T. Lim, SPE J., 1983, 23(02), 311–326 CrossRef
.
- W. G. Anderson, J. Pet. Technol., 1987, 39(11), 1–453 Search PubMed
.
- M. Dong, F. A. L. Dullien and I. Chatzis, J. Colloid Interface Sci., 1995, 172(1), 21–36 CrossRef CAS
.
- G. Q. Tang and N. R. Morrow, SPE Reservoir Eng., 1997, 12(04), 269–276 CrossRef CAS
.
- J. S. Buckley and Y. Liu, J. Pet. Sci. Eng., 1998, 20(3), 155–160 CrossRef CAS
.
- N. R. Morrow, G. Q. Tang, M. Valat and X. Xie, J. Pet. Sci. Eng., 1998, 20(3), 267–276 CrossRef CAS
.
- G. Q. Tang and N. R. Morrow, J. Pet. Sci. Eng., 1999, 24(2), 99–111 CrossRef CAS
.
- J. S. Buckley and J. Wang, J. Pet. Sci. Eng., 2002, 33(1), 195–202 CrossRef CAS
.
- Y. Zhang and N. R. Morrow, SPE/DOE Symposium on Improved Oil Recovery, 2006 Search PubMed
.
- N. R. Morrow and J. S. Buckley, J. Pet. Technol., 2001, 63(05), 106–112 CrossRef
.
- R. A. Nasralla and H. A. Nasr-El-Din, SPE Reservoir Eval. Eng., 2014, 17(01), 49–59 CrossRef CAS
.
- P. C. Myint and A. Firoozabadi, Curr. Opin. Colloid Interface Sci., 2015, 20(2), 105–114 CrossRef CAS
.
- M. Rücker, S. Berg, R. T. Armstrong, A. Georgiadis, H. Ott, A. Schwing and M. Kersten, Geophys. Res. Lett., 2015, 42(10), 3888–3894 CrossRef
.
- O. K. Kimbler, R. L. Reed and I. H. Silberberg, SPE J., 1966, 6(02), 153–165 CrossRef CAS
.
- J. D. McLean and P. K. Kilpatrick, J. Colloid Interface Sci., 1997, 189(2), 242–253 CrossRef CAS
.
- H. W. Yarranton, D. M. Sztukowski and P. Urrutia, J. Colloid Interface Sci., 2007, 310(1), 246–252 CrossRef CAS PubMed
.
- H. W. Yarranton, P. Urrutia and D. M. Sztukowski, J. Colloid Interface Sci., 2007, 310(1), 253–259 CrossRef CAS PubMed
.
- X. Yang, V. J. Verruto and P. K. Kilpatrick, Energy Fuels, 2007, 21(3), 1343–1349 CrossRef CAS
.
- X. Wang and V. Alvarado, J. Phys. Chem. B, 2009, 113, 13811–13819 CrossRef CAS PubMed
.
- Y. Fan, S. Simon and J. Sjöblom, Colloids Surf., A, 2010, 366(1), 120–128 CrossRef CAS
.
- V. Alvarado, X. Wang and M. Moradi, Energies, 2011, 4(7), 1058–1086 CrossRef CAS
.
- P. Erni, H. A. Jerri, K. Wong and A. Parker, Soft Matter, 2012, 8(26), 6958–6967 RSC
.
- V. Pauchard, J. P. Rane and S. Banerjee, Langmuir, 2014, 30(43), 12795–12803 CrossRef CAS PubMed
.
- D. Harbottle, Q. Chen, K. Moorthy, L. Wang, S. Xu, Q. Liu and Z. Xu, Langmuir, 2014, 30(23), 6730–6738 CrossRef CAS PubMed
.
- A. L. Nenningsland, S. Simon and J. Sjöblom, J. Dispersion Sci. Technol., 2014, 35(2), 231–243 CrossRef CAS
.
- J. G. Roof, SPE J., 1970, 10(01), 85–90 CrossRef
.
- L. Yu and N. C. Wardlaw, J. Colloid Interface Sci., 1986, 109(2), 461–472 CrossRef CAS
.
- T. C. Ransohoff, P. A. Gauglitz and C. J. Radke, AIChE J., 1987, 33(5), 753–765 CrossRef CAS
.
- P. A. Gauglitz and C. J. Radke, Chem. Eng. Sci., 1988, 43(7), 1457–1465 CrossRef CAS
.
- A. R. Kovscek and C. J. Radke, Colloids Surf., A, 1996, 117(1), 55–76 CrossRef CAS
.
- P. A. Gauglitz and C. J. Radke, J. Colloid Interface Sci., 1990, 134(1), 14–40 CrossRef CAS
.
- W. B. Lindquist, A. Venkatarangan, J. Dunsmuir and T. F. Wong, J. Geophys. Res.: Solid Earth, 2000, 105(B9), 21509–21527 CrossRef
.
- I. B. Bazhlekov, P. D. Anderson and H. E. Meijer, J. Colloid Interface Sci., 2006, 298(1), 369–394 CrossRef CAS PubMed
.
- A. R. Kovscek, G. Q. Tang and C. J. Radke, Colloids Surf., A, 2007, 302(1), 251–260 CrossRef CAS
.
- I. A. Beresnev and W. Deng, Phys. Fluids, 2010, 22(1), 012105 CrossRef
.
- M. Roché and H. Kellay, Europhys. Lett., 2011, 95(5), 54003 CrossRef
.
- C. X. Zhao, E. Miller, J. J. Cooper-White and A. P. Middelberg, AIChE J., 2011, 57(7), 1669–1677 CrossRef CAS
.
- P. Hoyer, V. Alvarado and M. S. Carvalho, Phys. Fluids, 2016, 28(1), 012104 CrossRef
.
- J. L. Espino, J. Meseguer and A. Laverón-Simavilla, Phys. Fluids, 2002, 14(10), 3710–3713 CrossRef CAS
.
- G. Garcia-Olvera and V. Alvarado, Fuel, 2017, 207, 402–412 CrossRef CAS
.
- A. W. Adamson, and A. P. Gast, Physical Chemistry of Surfaces, Wiley, 1967, pp. 400–408 Search PubMed
.
- K. D. Danov, R. D. Stanimirova, P. A. Kralchevsky, K. G. Marinova, N. A. Alexandrov, S. D. Stoyanov, T. B. J. Blijdenstein and E. G. Pelan, J. Colloid Interface Sci., 2015, 440, 168–178 CrossRef CAS PubMed
.
- N. J. Alvarez, L. M. Walker and S. L. Anna, Langmuir, 2010, 26(16), 13310–13319 CrossRef CAS PubMed
.
- J. T. Petkov, T. D. Gurkov, B. E. Campbelland and R. P. Borwankar, Langmuir, 2000, 16(8), 3703–3711 CrossRef CAS
.
- S. P. Timoshenko and J. M. Gere, Theory of elastic stability, Courier Corporation, 2009 Search PubMed
.
- J. Lucassen and M. Van Den Tempel, Chem. Eng. Sci., 1972, 27(6), 1283–1291 CrossRef CAS
.
- D. Barthes-Biesel, A. Diaz and E. Dhenin, J. Fluid Mech., 2002, 460, 211–222 CAS
.
- G. Papadakis, Int. J. Solids Struct., 2008, 45(20), 5308–5321 CrossRef
.
- S. Knoche, D. Vella, E. Aumaitre, P. Degen, H. Rehage, P. Cicuta and J. Kierfeld, Langmuir, 2013, 29(40), 12463–12471 CrossRef CAS PubMed
.
- N. J. Alvarez, L. M. Walker and S. L. Anna, Soft Matter, 2012, 8(34), 8917–8925 RSC
.
- N. J. Alvarez, L. M. Walker and S. L. Anna, Phys. Rev. E, 2010, 82(1), 011604 CrossRef PubMed
.
| This journal is © The Royal Society of Chemistry 2017 |

