 Open Access Article
Creative Commons Attribution 3.0 Unported Licence
Structural transformation of Pd-α-Fe2O3 and Pd-γ-Fe2O3 catalysts and application in the CO oxidation reaction
Hong Xu a,
Ke Nia,
Xiaokun Lia,
Guangzong Fangb and
Guohong Fan*a
aSchool of Chemistry and Chemical Engineering, Anhui University of Technology, Maanshan, Anhui 243002, P. R. China. E-mail: ghfan8@ahut.edu.cn
bState Key Laboratory of Catalysis, Dalian Institute of Chemical Physics, Chinese Academy of Sciences, Dalian, 116023, P. R. China
First published on 6th November 2017
Abstract
Pd-α-Fe2O3 and Pd-γ-Fe2O3 catalysts were acquired by treating Pd–Fe catalysts with redox pretreatment. These catalysts were characterized by various techniques and applied in the CO oxidation reaction. Characterization reveals that the Pd-α-Fe2O3 catalyst is obtained after calcination in air at 400 °C. The following reduction at lower temperature forms the Pd-γ-Fe2O3 catalyst. In the case of larger Pd (or PdO) and Fe2O3 nanoparticles, the Pd-γ-Fe2O3 catalyst is highly active for low temperature CO oxidation compared with the Pd-α-Fe2O3 catalyst, which may originate from the high oxygen storage properties of γ-Fe2O3 and stronger interaction between Pd and γ-Fe2O3. Higher reduction temperature results in much larger particle sizes and decreased activity. Stability tests also indicate that the highly active Pd-γ-Fe2O3 catalyst could transform to Pd-α-Fe2O3 in reactive atmosphere, leading to catalyst deactivation. Re-reduction treatment of the inactivated catalyst results in reproduction of the activity.
Introduction
CO catalytic oxidation has received great attention due to its important applications in the fields of air purification,1,2 automotive emissions control,3,4 and proton exchange membrane fuel cells.5–8 Noble metal (NM) catalysts have been developed to improve the performance and stability of the CO oxidation reaction, for example, Pt,9–11 Au,12,13 and Pd14,15 supported catalysts etc. Recently, Pd based catalysts have been studied widely because of their lower price and superior catalytic activity in low temperature reactions. However, the reactive performance of supported Pd catalysts was markedly influenced by a series of parameters, including the size and shape of palladium nanoparticles,16 the chemical valence of the palladium,17–20 and the interaction between the palladium and oxide support. The former two factors were mainly studied in the mono-Pd catalysts. Nevertheless, the mono-Pd catalysts exhibited low activity for low temperature CO oxidation because of the competition between CO adsorption and the formation of active oxygen.21From the aspect of reaction mechanism analysis, adding reducible metal oxides (CeO2,22,23 TiO2,24 FeOx,25–27 CoOx (ref. 28,29) etc.) is an effective approach to improve the CO oxidation activity, especially at low temperatures. Luo et al.30 compared the CO oxidation activity of Pd supported on different oxides and found the activity followed the order: Pd/CeO2 > Pd/ZrO2 > Pd/TiO2 > Pd/Al2O3 > Pd/SiO2. In addition, the performance of CO oxidation over Pd–Fe–Ox was distinctly superior to that over other Pd–M–O (M = Co, Zr, Mn, Cr, Ni, Zn, Cu, and Mo) catalysts.26 Satsuma et al.31 also found Pd/CeO2 and Pd/TiO2 had a relatively lower light-off temperature in CO oxidation. In recent years, increasing evidence has demonstrated the Mars–Van Krevelen (redox) mechanism32,33 which presents a new pathway for CO oxidation, especially over reducible oxides supported NM catalysts, which provide extra active centers to activate oxygen. Based on the results of previous research, it is found that the key properties of reducible oxides for oxygen storage and release significantly impacted on the catalytic performance of CO oxidation. The boundaries between NM and oxide support23,34 provided special active structures for CO and O2 activation, thus greatly improving the reactive activity of the CO oxidation reaction. In some cases, various factors may together influence the catalytic activity. For instance, Han et al. found the main active species in Pd–Fe/meso-C catalysts were PdO2 and FeOOH for CO oxidation.35,36 Liu et al. suggested the metallic Pd and partly reduced FeOx were active sites for CO and O2 activation respectively in CO oxidation.25 Although the study of the relationship between the active site and activity has been focused upon by a large number of researchers, this question is still the subject of broad discussion.
It is generally known that additional pretreatment is critical for catalyst activation before subjecting the catalyst to reactions. Pretreatment gas atmosphere and temperature can exert a significant influence on the final structure and reactive performance of the catalyst. Thus, understanding the different aspects involved in the thermal treatment for catalytic applications is of fundamental importance. For this purpose, we investigated the relationship between the active species and the catalytic activity of Pd–Fe catalysts treated in oxidative and reductive atmospheres, and found interesting dynamic transformation of the active species (Pd-α-Fe2O3 ↔ Pd-γ-Fe2O3) in various environments.
Results and discussion
Structure of Pd-α-Fe2O3 and Pd-γ-Fe2O3 catalysts
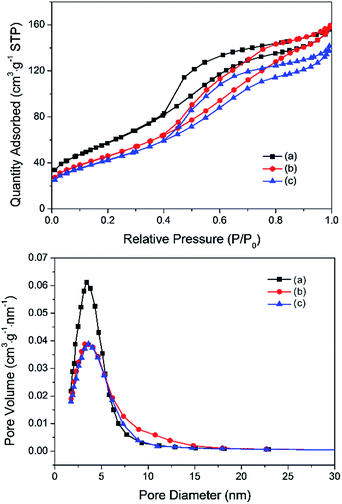
The Pd–Fe catalysts were prepared by the co-precipitation method as described in the experimental section. The Pd-α-Fe2O3 catalyst was acquired by treating the Pd–Fe sample in air at 400 °C (400-air), while the Pd-γ-Fe2O3 catalyst was acquired by treating the calcined Pd–Fe sample in H2 at 100 °C (100-H) or 200 °C (200-H). To illustrate the phase transformation of Pd–Fe/Al2O3 with redox pretreatment, various characterizations were performed. Fig. 1 displays the nitrogen adsorption/desorption isotherms and average pore diameter distributions. All samples exhibit typical IV shape isotherms associated with the inflection point in the P/P0 position,37 which are characteristic of mesopores. Pore diameter distributions also suggest these catalysts possess a mesoporous structure. The surface area, pore volume and average pore diameter of these three Pd–Fe/Al2O3 catalysts treated differently are summarized in Table 1. The BET surface area of the calcined catalyst is measured to be 209.2 m2 g−1, and that decreases significantly to 168.8 m2 g−1 for the catalyst reduced at 100 °C. Meanwhile, the BET surface area further decreases slightly with the increasing reduction temperature to 200 °C. The results of BET measurements indicate that the surface areas of Pd–Fe/Al2O3 catalysts are closely related to their pretreatments. The low BET surface area of reduced samples may be caused by sintering or blocking by metal particles on the support.38| Sample | BET surface area (m2 g−1) | Pore volume (cm3 g−1) | Pore diameter (nm) | Amount of CO chemisorption (μmol g−1) | Pd dispersion (%) | Active particle diameter (nm) |
|---|---|---|---|---|---|---|
| Pd–Fe-400-air | 209.23 | 0.242 | 4.62 | 92 | 48.9 | 2.3 |
| Pd–Fe-100-H | 168.88 | 0.247 | 5.84 | 22 | 11.6 | 9.7 |
| Pd–Fe-200-H | 156.07 | 0.219 | 5.61 | 36 | 19.3 | 5.8 |
Fig. 2 exhibits the XRD patterns of the as-prepared Pd–Fe/Al2O3 catalyst and catalysts after various treatments. The diffraction peaks at 45.9° and 67.1° are characteristic of the Al2O3 support in all samples. The as-prepared sample (Fig. 2(a)) shows the same diffraction pattern as Fe(OH)3 with the diffraction peaks at 35.0° and 62.7°.29,36 For the calcined catalyst (Fig. 2(b)), the diffraction peaks with low intensity around 2θ values of 33.1° and 35.8° can be observed, corresponding to characteristic peaks of hematite (α-Fe2O3).39,40 It is confirmed that phase transformation occurred from iron hydroxide to hematite during the calcination process. Additionally, broad and weak diffraction peaks of calcined catalyst may result from the amorphous state of iron oxides.39 After 100 °C H2 reduction (Fig. 2(c)), the diffraction peaks appear at 30.3°, 35.8°, 43.3°, 54°, 57.3°, 62.9°, which can be assigned to maghemite-C (γ-Fe2O3) or magnetite (Fe3O4).6 Nevertheless, differentiation between these two oxide states is impossible because of their similar diffraction peak positions in the XRD spectra. Thus, FeOx was expressed for the two oxide states at present. Furthermore, diffraction peaks of FeOx are significantly sharper than that of α-Fe2O3, indicating larger crystallite sizes in the reduced sample. No appearance of diffraction peaks of Pd or Pd oxides in the both samples (Fig. 2(b, c)) implies that that Pd species are highly dispersed on the surface of support. When the reduction temperature increased to 200 °C, apart from the diffraction peaks of FeOx, additional peak at 39.9° starts to appear in the diffraction pattern, which can be attributed to the (111) lattice of metallic Pd. This suggests the segregation of Pd particles becomes more noticeable under such reduction treatment at higher temperature. Comparatively, FeOx was formed in a H2 atmosphere at lower temperature because of the H2 spill-over effect from the Pd surface to the neighboring α-Fe2O3.41 On the other hand, the mean crystallite sizes of FeOx are calculated to be approximately 7 nm and 12 nm in the samples reduced at 100 °C and 200 °C respectively based on the Scherrer equation. On the basis of the XRD results, it is demonstrated that the reduction of α-Fe2O3 and Pd oxides occurs under a reducing atmosphere at elevated temperature and crystallite sizes increase due to the reduction treatment, this is in good agreement with the BET results of the lower specific surface area of reduced catalysts.
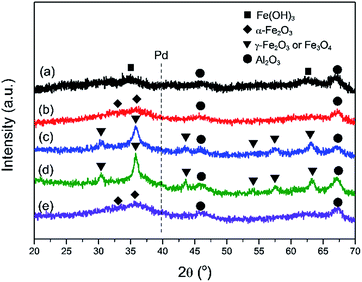 | ||
| Fig. 2 XRD patterns of various Pd–Fe/Al2O3 catalysts: (a) as-prepared; (b) calcined at 400 °C; (c) reduced at 100 °C; (d) reduced at 200 °C; (e) inactivated after reaction test. | ||
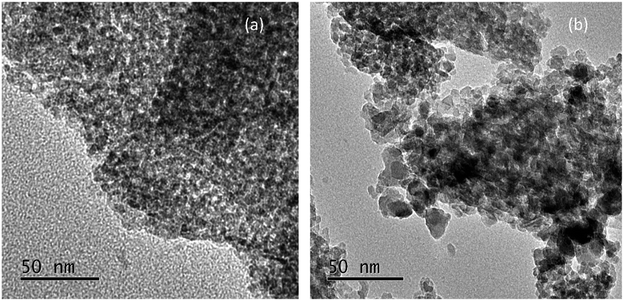
Fig. 3 displays the TEM images of Pd–Fe/Al2O3 catalysts reduced at 100 °C and 200 °C. As illustrated in Fig. 3(a), no obvious particles were observed in the full region of the image, which indicates that Pd or Pd oxide particles disperse well on the surface of the support. Although increasing size of iron oxide particles can be observed in the XRD spectra, the low-contrast of iron oxide and Al2O3 support results in invisibility of the iron oxide particles in the images. In contrast, the particle grown has occurred noticeably in the 200 °C reduced sample with a wide size distribution of 4–10 nm.
The chemical state and surface composition were evaluated by XPS measurements, as depicted in Fig. 4. For Pd–Fe catalyst calcined at 400 °C (Fig. 4(a)), the spectrum shows two peaks with the binding energy (BE) of Pd 3d5/2 and Pd 3d3/2 at 337.2 eV and at 342.5 eV, which can be attributed to PdO, consistent with the reported value of Pd2+ BE at 336.8–337.4 eV.18,42,43 In addition, no other Pd species is observed, which implies the existence of PdO as the only Pd compound in the calcined catalyst. For the catalyst reduced at 100 °C, two species are observed with the Pd 3d5/2 BEs located at 337.1 eV and 335.2 eV. These can be assigned to PdO and metallic Pd respectively, which indicates that PdO can be reduced easily at lower temperature, in agreement with other reports.38 The peaks of PdO and metallic Pd are also observed in the catalyst reduced at 200 °C at the Pd 3d5/2 BEs of 336.9 eV and 335.2 eV. The slightly shift to lower BE value compared with that in the 100 °C reduced catalyst may be caused by the increased particle size,44 as evidenced by XRD and TEM results. Meanwhile, the atomic ratio of Pd0/Pd0 + Pd2+ calculated from the XPS peak fitting increased from 0.16 to 0.26 when the reduction temperature increased from 100 °C to 200 °C in Table 2.
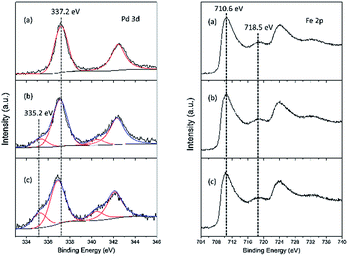 | ||
| Fig. 4 Pd 3d and Fe 2p XPS spectra of Pd–Fe/Al2O3 catalysts (a) calcined at 400 °C; (b) reduced at 100 °C; (c) reduced at 200 °C. | ||
| Sample | Pd 3d5/2 BE (eV) | Fe 2p3/2 BE (eV) | Pd/Al atomic ratio | Fe/Al atomic ratio | Pd0/(Pd2+ + Pd0) |
|---|---|---|---|---|---|
| Pd–Fe-400-air | 337.2 | 710.6 | 0.72 | 18.7 | 0 |
| Pd–Fe-100-H | 337.1, 335.2 | 710.6 | 0.60 | 12.1 | 0.16 |
| Pd–Fe-200-H | 336.9, 335.2 | 710.6 | 0.53 | 11.3 | 0.26 |
For the Fe 2p XPS spectra, the main peaks of Fe 2p3/2 located at approximately 710.6 eV, with the presence of satellites at 718.5 eV, are observed in all catalysts. As suggested by XRD results, Fe species exist in the form of α-Fe2O3 over the calcined catalyst. However, whether γ-Fe2O3 or Fe3O4 exists in the reduced catalyst is not clear from the XRD analysis. From Fig. 4(b, c), the XPS spectra of Fe in the reduced catalysts are nearly same as that in the calcined catalyst. It has been previously reported that the BEs of Fe 2p3/2 for Fe3O4 and γ-Fe2O3 were similar, located between 710.6 eV and 711.2 eV. In contrast, the associated satellite peak was observed for the Fe 2p3/2 peak of γ-Fe2O3, which was located approximately 8 eV higher than the main Fe 2p3/2 peak. The satellite peak was not observed in the Fe3O4 spectrum.45–48 Therefore, we believe that the main oxides are most likely γ-Fe2O3 over the reduced catalysts. Although most studies found that the Fe3O4 phase was formed by reducing α-Fe2O3 in H2,39,40,49 Aharoni et al. suggested that the γ-Fe2O3 was the intermediate phase during the process of reducing α-Fe2O3 to Fe3O4.50 Han et al. also found γ-Fe2O3 could be directly acquired from α-Fe2O3 in a reduced atmosphere at appropriate temperature,48 proving our viewpoint. Accordingly, it is believed that the most probable form was the γ-Fe2O3 compound in the reduced samples. The atomic ratio of Pd/Al and Fe/Al is also listed in Table 2. For the calcined sample, 100 °C reduced sample and 200 °C reduced sample, the Pd/Al and Fe/Al atomic ratio always decreased. As XPS is a surface sensitive measurement, these results indicate the overgrowth of Fe2O3 and Pd (or PdO) particles during the reducing process, which is in excellent agreement with the XRD results.
Activity of Pd-α-Fe2O3 and Pd-γ-Fe2O3 catalysts
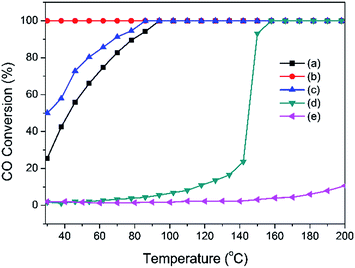
On the basis of the analysis discussed above, we confirm that the Pd-α-Fe2O3 catalyst was formed after calcination at 400 °C, and Pd-γ-Fe2O3 catalyst was formed after reduction in H2 atmosphere at moderate temperature (100 °C or 200 °C). The sinter of nanoparticles occurred in the process of reduction. The catalytic performances of the CO oxidation reaction were investigated over Pd-α-Fe2O3 and Pd-γ-Fe2O3 catalysts. The CO conversions as a function of reaction temperature are shown in Fig. 5. For comparison, the activities of Pd/Al2O3 and Fe/Al2O3 samples prepared by co-precipitation method were also tested in CO oxidation. It is found that the activities of Pd/Al2O3 and Fe/Al2O3 are very low compared with Pd–Fe/Al2O3 catalysts, and have little relationship to the pretreatment condition (not shown here). Furthermore, the Pd-α-Fe2O3 catalyst (400-air) exhibits a lower activity with approximately 20% CO conversion at RT and 100% CO conversion at approximately 100 °C. Pd-γ-Fe2O3 was formed after reduction at 100 °C, showing a superior performance with CO complete conversion in the range of RT to 200 °C. By contrast, reduction at higher temperature (200 °C) leads to the activity declining further.For a deeper understanding of the relationship between the catalyst structure and the reactive activity of CO oxidation, CO chemisorption experiments were carried out to study the surface properties of catalysts treated in various conditions, as shown in Table 1. The amount of CO chemisorption is 92 μmol g−1 for the calcined catalyst, and then sharply decreases to 22 μmol g−1 for 100 °C reduced catalyst. However, the amount of CO chemisorption increased to 36 μmol g−1 when the reduction temperature increased to 200 °C. The Pd dispersion and active particle diameter were calculated from the amount of CO chemisorption. It should be noted that the active particle diameters of the calcined catalyst and the 200 °C reduced catalyst are approximately the same as that determined by XRD and TEM results. However, particles in the catalyst reduced at 100 °C have an average diameter of about 9.7 nm determined by CO chemisorption. As revealed by the TEM images and XRD results, the majority of Pd particles in the catalyst with 100 °C reduction had a homogenous dispersion on the surface of the support, many were below 2 nm, as well as that in the calcined catalyst. These results are dissimilar to that obtained by CO chemisorption. Therefore, the lower amount of CO chemisorption for 100 °C reduced catalyst may result from strong interaction between the palladium species and the iron oxide support. It was proposed that a strong metal-support interaction was universally present in the NM catalysts supported on reducible oxides after reduction.39,49,51 Moreover, the electronic environment of the Pd species could be modified by interacting with Fe oxides,25 further weakening the CO chemisorption amount. Hence, we propose that strong interaction exists in the 100 °C reduced sample and impacts on the chemisorption ability. Other studies found that the surface of Pd particles was gradually covered by iron oxides overlayers when the catalyst is exposed to H2 atmosphere at certain temperatures,39 causing the decrease of Pd chemisorption capacity. If this phenomenon occurred, the uncovered surface of the Pd particles would be less after reduction at 200 °C. Then, the lower CO amount would be chemisorbed on the particle surface of the 200 °C reduced catalyst. However, the chemisorption amount of CO for 200 °C reduced catalyst increases compared with that for 100 °C reduced catalyst. The possible explanation for this is that the strong interaction in the 100 °C reduced catalyst becomes weak or even disappears in the 200 °C reduced catalyst because of the larger particles of Pd (or PdO) and iron oxides.
On the basis of above mentioned results, we conclude that the γ-Fe2O3 phase was formed during the reduction process. Pd-γ-Fe2O3 catalyst exhibited higher catalytic performance than Pd-α-Fe2O3 catalyst, in case of the larger Pd (or PdO) and Fe2O3 particle sizes. A similar phenomenon was found in Au catalysts supported on γ-Fe2O3 and α-Fe2O3.55 In situ Raman measurements clearly demonstrated that cation vacancies existed in γ-Fe2O3 but not in α-Fe2O3, which played a critical role in adsorbing metal to form stronger interactions. The Au/γ-Fe2O3 catalyst could be reduced at lower temperature compared to the Au/α-Fe2O3 catalyst, presenting much higher activity in CO oxidation according to the redox mechanism. As CO can be adsorbed on the surface of Pd or PdO particles, it can be inferred that the main hinderance for CO oxidation is O2 activation. γ-Fe2O3 has a higher property for O2 activation because of the vacancies in the cation sublattice,56,57 which may be the reason for the superior performance of Pd-γ-Fe2O3.
Fig. 6 presents the Arrhenius-type plots of Pd–Fe/Al2O3 catalysts with special treatments. The apparent activation energies (Eas) were calculated to be about 31, 16, and 28 kJ mol−1 for calcined, 100 °C reduced and 200 °C reduced catalysts respectively, in which the Ea value over the catalyst reduced at 100 °C is the lowest. The lower Ea value of the catalyst with 100 °C reduction (Pd-γ-Fe2O3) may account for the high activity at low temperature. Additionally, turnover frequencies (TOFs) of the three catalysts were calculated from the CO chemisorption data. The TOF value of the 100 °C reduced catalyst (Pd-γ-Fe2O3) for CO oxidation at 50 °C is 175 × 10−3 s−1, which is much higher than that of the calcined catalyst (9.4 × 10⁻³ s−1) and the 200 °C reduced catalyst (35.2 × 10⁻³ s−1). Table 3 shows the comparison of previously reported catalytic performances of various Pd–Fe related catalysts in the CO oxidation reaction. The values of Ea and reaction rate of the 100 °C reduced catalyst (Pd-γ-Fe2O3) are slightly lower than that of the Pd/γ-Fe2O3-R catalyst reported by Wang et al.52 However, the activity of the 100 °C reduced catalyst (Pd-γ-Fe2O3) is comparable to, or even much higher than, the activities of other catalysts.
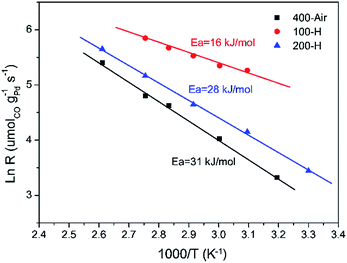 | ||
| Fig. 6 Arrhenius plots of the reaction rate versus 1/T for CO oxidation over typical Pd–Fe/Al2O3 catalysts. | ||
| Catalysta (methodb) | Pd loading (wt%) | Reactive gas | GHSV (mL g−1 h−1) | T100 (oC) | Ea (kJ mol−1) | Reaction rate (μmolCO·gPd−1 s−1) | TOF × 103 (s−1) | Ref. |
|---|---|---|---|---|---|---|---|---|
| a H: H2 treatment, R: reduction.b CP: co-precipitation, DP: deposition–precipitation, SG: sol–gel method. | ||||||||
| Pd–Fe-100-H (CP) | 1.8 | 1% CO, 20% O2, Ar | 30![[thin space (1/6-em)]](https://www.rsc.org/images/entities/char_2009.gif) 000 000 |
30 | 16 | 193 | 175 | The present work |
| Pd/γ-Fe2O3-R (DP) | 0.9 | 1% CO, air | 15![[thin space (1/6-em)]](https://www.rsc.org/images/entities/char_2009.gif) 000 000 |
0 | 12.5 | 216 | — | 52 |
| Pd–Fe/meso-C (CP) | 0.65 | 1% CO, air | 10![[thin space (1/6-em)]](https://www.rsc.org/images/entities/char_2009.gif) 000 000 |
30 | — | — | — | 35 |
| Pd/Fe2O3-H (CP) | 1.8 | 0.01% CO, air | 120![[thin space (1/6-em)]](https://www.rsc.org/images/entities/char_2009.gif) 000 000 |
40 | — | 29.7 | 38 | 38 |
| Pd/FeOx (CP) | 1.9 | 1% CO, air | — | — | 34.3 | 150 | 36.8 | 25 |
| Pd–Fe/zeolite (CP) | 0.63 | 1% CO, 24% O2, N2 | 10![[thin space (1/6-em)]](https://www.rsc.org/images/entities/char_2009.gif) 000 000 |
40 | — | — | 41.3 | 53 |
| Pd–Fe–Ox/Al2O3-R (SG) | 1 | 1% CO, air | 15![[thin space (1/6-em)]](https://www.rsc.org/images/entities/char_2009.gif) 000 000 |
25 | — | — | — | 54 |
Stability of Pd-γ-Fe2O3 catalyst
The stability performance of Pd–Fe/Al2O3 with 100 °C reduction (Pd-γ-Fe2O3) was performed at 30 °C, and the CO conversion data are presented in Fig. 7. The catalytic activity was maintained for 1.5 h with 100% CO conversion at GHSV of 30![[thin space (1/6-em)]](https://www.rsc.org/images/entities/char_2009.gif) 000 mL g−1 h−1. Then, the activity declined with the time on stream and to lower than 50% after about 6.5 h. To examine the possible reason of deactivation behavior, we performed XRD on this inactivated catalyst (Fig. 2(e)). It is found that the XRD pattern of the inactivated catalyst is very similar to that of the calcined catalyst, which has the broad and weak diffraction peaks of amorphous α-Fe2O3. These results suggest that the deactivation of the Pd–Fe catalyst in the reaction process may result from the dynamic transformation of γ-Fe2O3 to α-Fe2O3 in the O2-rich atmosphere. It was reported that γ-Fe2O3 can be transferred to α-Fe2O3 when calcined at an appropriate temperature.58,59 Despite the stability test being performed at 30 °C, the released heat during the reaction process may cause a higher temperature of the catalyst bed because CO oxidation is a highly exothermic reaction.21 On the other hand, Pd addition may make this phase transformation easier at lower temperature. Therefore, α-Fe2O3 formation in the reaction probably leads to the catalyst deactivation. When the inactivated catalyst was reduced at 100 °C again, 100% CO conversion was eventually reproducible. Also, when GHSV was controlled at 15
000 mL g−1 h−1. Then, the activity declined with the time on stream and to lower than 50% after about 6.5 h. To examine the possible reason of deactivation behavior, we performed XRD on this inactivated catalyst (Fig. 2(e)). It is found that the XRD pattern of the inactivated catalyst is very similar to that of the calcined catalyst, which has the broad and weak diffraction peaks of amorphous α-Fe2O3. These results suggest that the deactivation of the Pd–Fe catalyst in the reaction process may result from the dynamic transformation of γ-Fe2O3 to α-Fe2O3 in the O2-rich atmosphere. It was reported that γ-Fe2O3 can be transferred to α-Fe2O3 when calcined at an appropriate temperature.58,59 Despite the stability test being performed at 30 °C, the released heat during the reaction process may cause a higher temperature of the catalyst bed because CO oxidation is a highly exothermic reaction.21 On the other hand, Pd addition may make this phase transformation easier at lower temperature. Therefore, α-Fe2O3 formation in the reaction probably leads to the catalyst deactivation. When the inactivated catalyst was reduced at 100 °C again, 100% CO conversion was eventually reproducible. Also, when GHSV was controlled at 15![[thin space (1/6-em)]](https://www.rsc.org/images/entities/char_2009.gif) 000 mL g−1 h−1, the 100% CO conversion was maintained for at least 32 h. Therefore, we conclude that Pd-γ-Fe2O3 and Pd-α-Fe2O3 were prepared via a simple method with the redox treatment at the appropriate temperature. Pd-γ-Fe2O3 showed a much higher performance towards CO oxidation than Pd-α-Fe2O3. Phase transformation from Pd-γ-Fe2O3 to Pd-α-Fe2O3 occurred during the reaction process, causing the catalyst deactivation.
000 mL g−1 h−1, the 100% CO conversion was maintained for at least 32 h. Therefore, we conclude that Pd-γ-Fe2O3 and Pd-α-Fe2O3 were prepared via a simple method with the redox treatment at the appropriate temperature. Pd-γ-Fe2O3 showed a much higher performance towards CO oxidation than Pd-α-Fe2O3. Phase transformation from Pd-γ-Fe2O3 to Pd-α-Fe2O3 occurred during the reaction process, causing the catalyst deactivation.
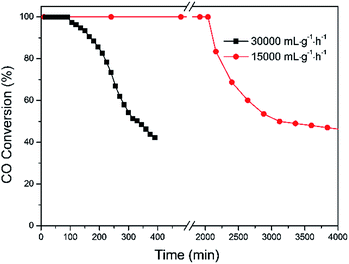 | ||
Fig. 7 CO conversion versus time over Pd–Fe/Al2O3 catalysts reduced at 100 °C under 30![[thin space (1/6-em)]](https://www.rsc.org/images/entities/char_2009.gif) 000 mL g−1 h−1 and 15 000 mL g−1 h−1 and 15![[thin space (1/6-em)]](https://www.rsc.org/images/entities/char_2009.gif) 000 mL g−1 h−1. 000 mL g−1 h−1. | ||
Experimental
Catalyst preparation
The Pd-α-Fe2O3/Al2O3 and Pd-γ-Fe2O3/Al2O3 samples were obtained via the following procedure: the Pd–Fe/Al2O3 catalysts were prepared by a traditional co-precipitation method with the metal loadings of 2 wt% Pd and 30 wt% Fe. Briefly, a certain amount of Pd(NO3)2 and Fe(NO3)3 solutions were added to 100 mL deionized water. Then, 0.2 g Al2O3 was added to the solution. After stirring for 30 min, the final pH was adjusted to 8.5 by dropping 0.4 mol L−1 Na2CO3 solution into the suspended solution under continuous stirring. After 4 h stirring, the solid sample was filtrated, washed with deionized water and dried overnight. The obtained sample was noted as as-prepared Pd–Fe catalyst. Then, the Pd-α-Fe2O3/Al2O3 sample was obtained by heating the dried sample in air at 400 °C for 2 h. After calcination, the calcined sample was further heated in flowing H2 at lower temperature for 1 h to produce Pd-γ-Fe2O3/Al2O3 sample.The Pd/Al2O3 and Fe/Al2O3 samples with the same metal content were synthesized in the same way for comparison.
Catalyst characterization
The surface areas, pore volume and pore size were measured by the Brunauer–Emmett–Teller (BET) method. Prior to measurements, the sample was degassed at 200 °C for 6 h under vacuum. Then nitrogen adsorption–desorption isotherms were recorded at −196 °C using a TriStar II Plus instrument (Micromeritics). X-ray diffraction (XRD) measurements were carried out on a Rigaku D/Max 2500 diffractometer with a Cu Kα (λ = 1.5406 Å) radiation. The scanning speed was controlled at 2°·min−1 and the scanning scope was set from 10° to 70°. Transmission electron microscopy (TEM) experiments were carried out using a JEOL JEM2100F Microscope with an accelerating voltage of 200 kV. X-ray photoelectron spectroscopy (XPS) measurements were performed on a Thermo Scientific ESCALAB 250Xi instrument with an Al Kα X-ray source. The binding energy of C 1s (284.6 eV) was used to calibrate the XPS spectra as a reference. CO chemisorption measurements were carried out at 50 °C on a Micromeritics Chemisorption Analyzer (Auto Chem II 2920). Before measurement, the catalyst was treated at the selected environment and cooled down to 50 °C in pure Ar gas. CO pulse was injected into the pretreated sample and the CO concentration was detected by a thermal conductivity detector (TCD). Assuming that the stoichiometry of the chemisorbed CO on surface Pd atom was one, the corresponding Pd dispersion and average particle size were calculated according to chemisorption data and the total Pd amount.Measurements of activity
The CO oxidation reaction was carried out under atmospheric pressure in a fixed-bed microreactor. The gas hourly space velocity (WHSV) was controlled at 30![[thin space (1/6-em)]](https://www.rsc.org/images/entities/char_2009.gif) 000 mL g−1 h−1 if not specified. The reaction gas contained 1% CO, 20% O2, 79% Ar. Before reaction, the as-prepared catalyst was treated in air or H2 to produce Pd-α-Fe2O3 and Pd-γ-Fe2O3 catalysts and cooled down to RT in Ar gas. Subsequently, the reaction gas was introduced to pass through the catalyst bed. The catalytic performance was investigated from RT to 200 °C with a heating rate of 1 °C min−1, expressed with the CO conversion. CO concentration in the effluent gas was analyzed by an online gas chromatograph equipped with a TCD. Kinetic measurements were performed with the CO conversion less than 20% over catalyst diluted with inert silica. All of the activity tests were carried out after the reaction had reached a steady state.
000 mL g−1 h−1 if not specified. The reaction gas contained 1% CO, 20% O2, 79% Ar. Before reaction, the as-prepared catalyst was treated in air or H2 to produce Pd-α-Fe2O3 and Pd-γ-Fe2O3 catalysts and cooled down to RT in Ar gas. Subsequently, the reaction gas was introduced to pass through the catalyst bed. The catalytic performance was investigated from RT to 200 °C with a heating rate of 1 °C min−1, expressed with the CO conversion. CO concentration in the effluent gas was analyzed by an online gas chromatograph equipped with a TCD. Kinetic measurements were performed with the CO conversion less than 20% over catalyst diluted with inert silica. All of the activity tests were carried out after the reaction had reached a steady state.
Conclusions
In summary, we have synthesized Pd–Fe catalysts with the classical co-precipitation method and evaluated the influence of redox pretreatment on the catalytic performance of the CO oxidation reaction. Interestingly, Pd-α-Fe2O3 and Pd-γ-Fe2O3 catalysts were obtained by oxidation or reduction treatment at special temperatures. The structure and phase of Pd-α-Fe2O3 and Pd-γ-Fe2O3 catalysts were confirmed by various characterizations. Despite the larger particles existing in the Pd-γ-Fe2O3 catalyst, it has a higher activity in CO oxidation compared to Pd-α-Fe2O3. The Pd-γ-Fe2O3 catalyst has a lower Ea and higher TOF value. The high activity might result from the higher ability for O2 activation in γ-Fe2O3 and stronger interaction between Pd and γ-Fe2O3. The Pd-γ-Fe2O3 catalyst transforms to Pd-α-Fe2O3 in the reactive atmosphere, leading to the catalyst deactivation. The activity of the inactivated catalyst can be recovered by reduction once again, which may regenerate the highly active Pd-γ-Fe2O3 structure.Conflicts of interest
There are no conflicts to declare.Acknowledgements
This work was financially supported by the National Natural Science Foundation of China (No. 21403004, No. 21403003).Notes and references
- P. C. Novelli, K. A. Masarie and P. M. Lan, J. Geophys. Res., 1998, 103, 19015–19033 CrossRef CAS.
- M. A. K. Khalil and R. A. Rasmussen, Nature, 1988, 332, 242–245 CrossRef CAS.
- M. V. Twigg, Catal. Today, 2011, 163, 33–41 CrossRef CAS.
- R. M. Heck and R. J. Farrauto, Appl. Catal., A, 2001, 221, 443–457 CrossRef CAS.
- C. Wang, B. Li, H. Lin and Y. Yuan, J. Power Sources, 2012, 202, 200–208 CrossRef CAS.
- L. Q. Liu, B. T. Qiao, Y. D. He, F. Zhou, B. Q. Yang and Y. Q. Deng, J. Catal., 2012, 294, 29–36 CrossRef CAS.
- K. Liu, A. Q. Wang and T. Zhang, ACS Catal., 2012, 2, 1165–1178 CrossRef CAS.
- Y. Huang, A. Wang, X. Wang and T. Zhang, Int. J. Hydrogen Energy, 2007, 32, 3880–3886 CrossRef CAS.
- H. Xu, Q. Fu, X. G. Guo and X. H. Bao, ChemCatChem, 2012, 4, 1645–1652 CrossRef CAS.
- H. Xu, Q. Fu, Y. X. Yao and X. H. Bao, Energy Environ. Sci., 2012, 5, 6313–6320 CAS.
- H. Xu, K. Ni, X. Li, S. Zhu and G. Fan, Chin. J. Catal., 2017, 38, 1261–1269 CrossRef CAS.
- X. J. Xu, Q. Fu, X. G. Guo and X. H. Bao, ACS Catal., 2013, 3, 1810–1818 CrossRef CAS.
- L. Yu, Y. Liu, F. Yang, J. Evans, J. A. Rodriguez and P. Liu, J. Phys. Chem. C, 2015, 119, 16614–16622 CAS.
- G. L. Dong, J. G. Wang, Y. B. Gao and S. Y. Chen, Catal. Lett., 1999, 58, 37–41 CrossRef CAS.
- Y. Zhou, Z. Wang and C. Liu, Catal. Sci. Technol., 2015, 5, 69–81 CAS.
- M. S. Jin, H. Y. Liu, H. Zhang, Z. X. Xie, J. Y. Liu and Y. N. Xia, Nano Res., 2010, 4, 83–91 CrossRef.
- M. Haneda, M. Todo, Y. Nakamura and M. Hattori, Catal. Today, 2017, 281, 447–453 CrossRef CAS.
- Y. Zhang, Y. Cai, Y. Guo, H. Wang, L. Wang, Y. Lou, Y. Guo, G. Lu and Y. Wang, Catal. Sci. Technol., 2014, 4, 3973–3980 CAS.
- H. Kondoh, R. Toyoshima, Y. Monya, M. Yoshida, K. Mase, K. Amemiya and B. S. Mun, Catal. Lett., 2016, 260, 14–20 CAS.
- K. Zorn, S. Giorgio, E. Halwax, C. R. Henry, H. Grönbeck and G. Rupprechter, J. Phys. Chem. C, 2011, 115, 1103–1111 CAS.
- A. Martínez-Arias, J. Catal., 2004, 221, 85–92 CrossRef.
- Z. Hu, X. Liu, D. Meng, Y. Guo, Y. Guo and G. Lu, ACS Catal., 2016, 6, 2265–2279 CrossRef CAS.
- M. Cargnello, V. V. T. Doan-Nguyen, T. R. Gordon, R. E. Diaz, E. A. Stach, R. J. Gorte, P. Fornasiero and C. B. Murray, Science, 2013, 341, 771–773 CrossRef CAS PubMed.
- J. Y. Park, J. R. Renzas, B. B. Hsu and G. A. Somorjai, J. Phys. Chem. C, 2007, 111, 15331–15336 CAS.
- L. Q. Liu, F. Zhou, L. G. Wang, X. J. Qi, F. Shi and Y. Q. Deng, J. Catal., 2010, 274, 1–10 CrossRef CAS.
- Y. S. Bi, L. Chen and G. X. Lu, J. Mol. Catal. A: Chem., 2007, 266, 173–179 CrossRef CAS.
- A. S. Ivanova, E. M. Slavinskaya, O. A. Stonkus, R. V. Gulyaev, T. S. Glazneva, A. S. Noskov and A. I. Boronin, Catal. Sci. Technol., 2016, 6, 3918–3928 CAS.
- H. M. A. Hassan, M. A. Betiha, R. F. M. Elshaarawy and M. Samy El-Shall, Appl. Surf. Sci., 2017, 402, 99–107 CrossRef CAS.
- B. Qiao, L. Liu, J. Zhang and Y. Deng, J. Catal., 2009, 261, 241–244 CrossRef CAS.
- M.-F. Luo, Z.-Y. Hou, X.-X. Yuan and X.-M. Zheng, Catal. Lett., 1998, 50, 205–209 CrossRef CAS.
- A. Satsuma, K. Osaki, M. Yanagihara, J. Ohyama and K. Shimizu, Appl. Catal., B, 2013, 132–133, 511–518 CrossRef CAS.
- L. Li, A. Wang, B. Qiao, J. Lin, Y. Huang, X. Wang and T. Zhang, J. Catal., 2013, 299, 90–100 CrossRef CAS.
- H. Y. Kim and G. Henkelman, J. Phys. Chem. Lett., 2013, 4, 216–221 CrossRef CAS PubMed.
- B. Liu, J. Liu, T. Li, Z. Zhao, X.-Q. Gong, Y. Chen, A. Duan, G. Jiang and Y. Wei, J. Phys. Chem. C, 2015, 119, 12923–12934 CAS.
- W. L. Han, G. D. Zhang, K. Zhao, G. X. Lu and Z. C. Tang, Phys. Chem. Chem. Phys., 2015, 17, 29027–29035 RSC.
- W. L. Han, Z. C. Tang, P. Zhang and G. X. Lu, RSC Adv., 2014, 4, 23262 RSC.
- K. S. W. Sing, D. H. Everett, R. A. W. Haul, L. Moscou, R. A. Pierotti, J. Rouquérol and T. Siemieniewska, Pure Appl. Chem., 1985, 57, 603–619 CrossRef CAS.
- F. G. Wang, Y. Xu, K. F. Zhao and D. N. He, Nano-Micro Lett., 2014, 6, 233–241 CrossRef.
- R. Naumann d'Alnoncourt, M. Friedrich, E. Kunkes, D. Rosenthal, F. Girgsdies, B. S. Zhang, L. D. Shao, M. Schuster, M. Behrens and R. Schlögl, J. Catal., 2014, 317, 220–228 CrossRef.
- X. Zhang, Y. Niu, X. Meng, Y. Li and J. Zhao, CrystEngComm, 2013, 15, 8166 RSC.
- W. C. Conner and J. L. Falconer, Chem. Rev., 1995, 95, 759–788 CrossRef CAS.
- M. R. Mucalo and C. R. Bullen, J. Mater. Sci., 2001, 20, 1853–1856 CAS.
- L. S. Kibis, A. I. Titkov, A. I. Stadnichenko, S. V. Koscheev and A. I. Boronin, Appl. Surf. Sci., 2009, 255, 9248–9254 CrossRef CAS.
- C. N. R. Rao, G. U. Kulkarni, P. John Thomas and P. P. Edwards, Chem.–Eur. J., 2002, 8, 28–35 CrossRef CAS.
- T. Yamashita and P. Hayes, Appl. Surf. Sci., 2008, 254, 2441–2449 CrossRef CAS.
- M. Muhler, R. Schlögl and G. Ertl, J. Catal., 1992, 138, 413–444 CrossRef CAS.
- D. D. Hawn and B. M. DeKoven, Surf. Interface Anal., 1987, 10, 63–74 CrossRef CAS.
- Q. Han, Z. Liu, Y. Xu, Z. Chen, T. Wang and H. Zhang, J. Phys. Chem. C, 2007, 111, 5034–5038 CAS.
- P. Kast, M. Friedrich, D. Teschner, F. Girgsdies, T. Lunkenbein, R. Naumann d'Alnoncourt, M. Behrens and R. Schlögl, Appl. Catal., A, 2015, 502, 8–17 CrossRef CAS.
- A. Aharoni., E. H. Frei and M. Schieber, J. Phys. Chem. Solids, 1962, 23, 545–554 CrossRef CAS.
- E. W. Zhao, H. B. Zheng, K. Ludden, Y. Xin, H. E. Hagelin-Weaver and C. Bowers, ACS Catal., 2016, 6, 974–978 CrossRef CAS.
- L. Wang, C. Pu, L. Xu, Y. Cai, Y. Guo, Y. Guo and G. Lu, Fuel Process. Technol., 2017, 160, 152–157 CrossRef CAS.
- Y. S. Bi, G. Y. Dang, X. H. Zhao, X. F. Meng, H. J. Lu and J. T. Jin, J. Hazard. Mater., 2012, 229–230, 245–250 CrossRef CAS PubMed.
- L. Cai, G. Lu, W. Zhan, Y. Guo, Y. Guo, Q. Yang and Z. Zhang, J. Mater. Sci.: Mater. Electron., 2011, 46, 5639–5644 CrossRef CAS.
- K. Zhao, H. Tang, B. Qiao, L. Li and J. Wang, ACS Catal., 2015, 5, 3528–3539 CrossRef CAS.
- T. Belin, N. Guigue-Millot, T. Caillot, D. Aymes and J. C. Niepce, J. Solid State Chem., 2002, 163, 459–465 CrossRef CAS.
- P. Guo, X. Guo and C. Zheng, Appl. Surf. Sci., 2010, 256, 6991–6996 CrossRef CAS.
- J. Lai, K. V. P. M. Shafi, K. Loos, A. Ulman, Y. Lee, T. Vogt and C. Estournès, J. Am. Chem. Soc., 2003, 125, 11470–11471 CrossRef CAS PubMed.
- S. S. Pati, L. H. Singh, J. C. M. Ochoa, E. M. Guimarãesa, M. J. A. Sales, J. A. H. Coaquira, A. C. Oliveira and V. K. Garg, Mater. Res. Express, 2015, 2, 045003 CrossRef.
| This journal is © The Royal Society of Chemistry 2017 |

