 Open Access Article
Silkworm feces extract improves iron deficiency anemia via suppressing hepcidin expression and promoting iron-regulatory proteins expression†
Xiao Huanga,
Jun Wub,
Qiang Lia,
Saisai Gub,
Zehong Chena and
Kaiping Wang *b
*b
aUnion Hospital of Tongji Medical College, Huazhong University of Science and Technology, No. 1277, Jiefang Road, 430022, Wuhan, China
bHubei Key Laboratory of Nature Medicinal Chemistry and Resource Evaluation, Tongji Medical College of Huazhong University of Science and Technology, No. 13, Hangkong Road, 430030, Wuhan, China. E-mail: wkpzqc@126.com; Fax: +86 27 63559222; Tel: +86 27 63559222
First published on 30th October 2017
Abstract
Iron deficiency anemia (IDA) is a global public health problem that imposes negative effects on human quality of life, especially in pregnant women and children. Silkworm feces extract (SFE) has been used for improving renal anemia of maintenance hemodialysis patients. In this study, we aimed to explore the preventive efficacy of SFE toward iron deficiency anemia in rats and clarify the underlying mechanisms. Our study demonstrated that SFE treatment improved hematological parameters, decreased TIBC, increased serum iron, transferrin saturation, liver iron and spleen iron of IDA rats. Western blot analysis showed that SFE upregulated iron-regulatory proteins (IRPs) expression and downregulated ferritin expression in livers. Furthermore, SFE inhibited hepcidin expression and increased ferroportin1 expression by blocking JAK2/STAT3, BMP6/SMAD, and HFE/TfR2 pathways. And SFE also attenuated hepcidin expression induced by IL-6 and BMP6 in HepG2 cells. These findings suggested that SFE may be an efficient oral iron supplement to ameliorate iron deficiency anemia.
1. Introduction
As a trace element for sustaining life, iron is an important component of hemoglobin, myoglobin, and a variety of enzymes, which are widely involved in oxygen transport, redox reactions, and energy metabolism.1,2 Iron deficiency is one of the most prevalent nutritional deficiencies worldwide.3 Iron deficiency anemia (IDA) is caused by inadequate iron absorption, increased iron demand, iron utilization obstacles or chronic blood loss in the body.4 Many drugs can lead to iron deficiency. For example, proton-pump inhibitors and H2 receptor antagonists could decrease iron absorption5 and non-steroidal anti-inflammatory drugs could increase blood loss.6 Lately, studies showed that iron deficiency anemia was also frequently reported in chronic disorders,7 such as inflammatory bowel diseases, chronic heart failure,8 chronic kidney disease,9 cancer,10 rheumatoid arthritis,11 and obesity.12,13 Whatever its cause, iron deficiency anemia has a negative effect on our quality of life, including normal growth, immune function, physical performance, and even intellectual development.14 Therefore, it is important to maintain iron homeostasis and prevent iron deficiency anemia in at-risk populations.Several oral iron supplements were used for the prevention and treatment of iron deficiency anemia, such as ferrous sulfate, ferrous carbonate, ferrous fumarate, and ferrous citrate.15 Additionally, these compounds may have serious gastrointestinal side effects, including abdominal pain, nausea, vomiting, and constipation.16 Besides, the bioavailability of traditional iron compounds such as ferrous sulfate is influenced by foods ingested. For example, wheat, cocoa, tea, and soya beans, which contain poly phenol compounds or phytic acid, could decrease iron absorption because they form complexes that are not absorbed from the gut.17,18 Therefore, a safe and efficient iron supplement is needed. Silkworm feces extract (SFE), which consists of a sodium iron chlorophyllin and chlorophyll derivative, is a water-soluble iron complex. Chlorophyll was extracted from the feces of silkworms and the magnesium ion in the chlorophyll porphyrin ring was removed to obtain a chlorophyll derivative, which then was complexed with iron to form sodium iron chlorophyllin. The structure of sodium iron chlorophyllin was similar to that of heme; it was stable under simulated gastrointestinal juices and its bioavailability was less affected by polyphenols.19 Previous studies showed that SFE exerted a significant effect on improving anemia conditions of maintenance hemodialysis patients and their quality of life.20 However, the effects of SFE and its underlying mechanisms in improving iron deficiency anemia have not yet been investigated.
There are two regulatory systems that maintain iron homeostasis: one system mainly controls cellular iron metabolism through iron-regulatory proteins (IRPs) that bind iron-responsive elements (IREs) in regulated mRNAs, and another system functions systemically and relies on the hormone hepcidin and the iron exporter ferroportin.21,22 The interactions of IREs with IRPs coordinately regulate expression of the genes involved in iron uptake, use, storage, and export at the post-transcriptional level.23 Hepcidin, a 25-amino-acid antimicrobial peptide produced by hepatocytes, is the central regulator of systemic iron metabolism.24 Hepcidin binds to ferroportin, the channel for cellular iron efflux, triggering its internalization, ubiquitination, and subsequent lysosomal degradation. That hampers iron efflux from duodenal enterocytes, macrophages, and hepatocytes into circulation.25,26 Recently, since erythropoietin was proved to be effective in suppressing hepcidin expression by promoting erythropoiesis, erythropoietin administration was used to treat hepcidin-induced anemia.27
In the present study, we established an IDA rat model to evaluate the preventive effects of SFE and investigated the underlying mechanism in vivo and in vitro. This study may provide a theoretical basis for clinical applications of SFE as an iron supplement.
2. Materials and methods
2.1. Materials and reagents
Silkworm feces extract, the active pharmaceutical ingredient of Shengxuening tablet (GYZZ Z20030088, Wuhan United Pharmaceutical Company, Wuhan, China), was obtained from Wuhan United Pharmaceutical Company. The formulations of Silkworm feces extract are shown in Table 1S (ESI†). Human hepatocellular carcinoma (HepG2) cells were purchased from American Type Culture Collection (ATCC). Fetal bovine serum (FBS), DMEM medium, trypsin EDTA, penicillin, and streptomycin were obtained from Gibco (Grand Island, NY, USA). Anti-mouse β-actin antibody, horseradish peroxidase-conjugated anti-mouse, and anti-rabbit secondary antibodies were purchased from Sigma (St. Louis, MO, USA). Primary antibodies against IRP1 (ab126595), IRP2 (ab181153), transferrin receptor1 (TfR1; ab1086), ferroportin1 (ab85370), ferritin (ab69090), BMP6 (ab155963), and hepcidin (ab30760) were obtained from Abcam (Cambridge, MA, USA). Primary antibodies against phospho-STAT3 (#9145), phospho-JAK2 (#3776), SMAD4 (#38454), phospho-SMAD1/5/8 (#13820), and MAPK (#8690) were obtained from Cell Signaling Technology (Danvers, MA, USA). Bicinchoninic acid protein assay kit was purchased from Beyotime biotechnology (Shanghai, China). Other reagents and chemicals were of analytical grade.2.2. Animals and treatments
Animal experiments were approved by the Institutional Animal Care and Use Committee of Tongji Medical College, Huazhong University of Science and Technology. The animal care and experimental procedures were carried out in accordance with internationally accepted and harmonised guidelines which are the Guidelines of the Institutional Animal Care and Use Committee of Tongji Medical College and the National Institutes of Health Guide for the Care and Use of Laboratory Animals (permit number: SYXK (Hubei) 2015-0018). Male Sprague-Dawley rats were purchased from the Center for Experimental Animal Research (Wuhan, China) and maintained in polypropylene cages (six in each cage) in an air-conditioned room (25 ± 1 °C, relative humidity 50 ± 20%, 12 hour light/dark cycle).The diets were purchased from the Center for Experimental Animal Research (Wuhan, China). An iron-deficient diet was prepared using corn starch as its main component. Formula was as follows: corn starch about 99%, salt about 0.7%, mixed vitamin approximately 0.1%, trace elements about 0.1%, choline chloride about 0.1%, and the iron content was 10.1 mg kg−1 as determined by flame atomic absorption spectrometry.
Forty-eight rats were randomly divided into six groups of eight rats per group, called normal control group (NC), IDA group, RhEPO group, SFE high dose (HSFE) group, SFE low dose (LSFE) group, and chlorophyll derivative (CLD) group, respectively. The daily dosage of SFE for rats in the LSFE and HSFE groups were calculated according to body surface area conversion to the human equivalent dosing regimen of 300 mg per day and 600 mg per day. The normal control group was fed a standard diet. The other five groups were fed an iron-deficient diet combined with repeating bleeding from the orbital vein plexus every other day. At the same time, the NC group, IDA group, and RhEPO group were intragastrically administered with 1 mL distilled water each day for 28 days, two SFE treatment groups (27 and 54 mg per kg per day, referred as LSFE and HSFE group, respectively) were intragastrically administered with SFE for 28 days. The CLD group was intragastrically administered with the chlorophyll derivative (27 mg kg−1) each day for 28 days. Besides, the RhEPO treatment group was given recombinant human erythropoietin (rhEPO, Sunshine Pharmaceutical Co., Shenyang, China) by intraperitoneal injection at a dose of 2000 U kg−1 thrice on three consecutive days, starting from day 25 after feeding an iron-deficient diet. All rats had access to food and distilled water from an iron-free apparatus which was used to preclude extraneous iron intake from water. The total experimental procedure was strictly controlled to avoid iron contamination.
After 28 days of treatment, the rats were anesthetized by injection of 3% sodium pentobarbital (150 mg kg−1), blood was collected from the orbital vein plexus and then the rats were euthanized. After perfusion, liver and spleen tissues from each rat were harvested for iron content and protein extraction.
2.3. Hematological and iron analysis
Blood in ethylenediamine tetra-acetic acid (EDTA)-containing vacuum tubes was analyzed by a MEK-6318K Multispecies Hematology Analyzer (Nihon Kohden, Tokyo, Japan) for the determination of hemoglobin (Hb), red blood cell count (RBC), hematocrit (HCT), mean corpuscular volume (MCV), mean corpuscular hemoglobin (MCH), mean corpuscular hemoglobin concentration (MCHC), and red blood cell volume distribution width (RDW-CV). Blood samples collected in Eppendorf tubes were centrifuged at 12![[thin space (1/6-em)]](https://www.rsc.org/images/entities/char_2009.gif) 000 rpm for 15 min after two hours at room temperature, and then supernatant serum was stored at −80 °C until analysis.
000 rpm for 15 min after two hours at room temperature, and then supernatant serum was stored at −80 °C until analysis.
Serum hepcidin was determined by an enzyme-linked immunosorbent assay (ELISA) according to the manufacturer's instructions (USCN Life Co., Houston, TX, USA).28 The limit of detection of this kit was 25 ng mL−1. Serum iron, liver iron content, and spleen iron content were determined with a flame atomic-absorption spectrometer (Model AA-240 FS, VARIAN Co., Palo Alto, CA, USA).29 The limit of detection of iron content was 0.0267 mg L−1 in this study. Serum total iron binding capacity (TIBC) was determined using commercially available kits (Nanjing Jiancheng Bioengineering Institute, Nanjing, China).30 The limit of detection of this kit was 0.05 mg L−1.
2.4. Cell culture and treatments
HepG2 cells were cultured in DMEM medium supplemented with 10% FBS and 1% penicillin/streptomycin solution at 37 °C, 5% CO2. HepG2 cells were seeded in six-well plates at 1 × 10⁶ cells per well. For interleukin-6 (IL-6) treatment, HepG2 cells were incubated with 50 ng mL−1 recombinant human IL-6 (Peprotech, Rocky Hill, Connecticut, USA) in the presence or absence of SFE (200 μg mL−1) for 24 hours. For BMP6 treatment, HepG2 cells were stimulated with 25 ng mL−1 recombinant human BMP6 (Peprotech, Rocky Hill, Connecticut, USA) in the presence or absence of SFE (200 μg mL−1) for 24 hours.2.5. Western blot analysis
For western blotting analysis, total protein extracts were prepared from frozen rat livers or HepG2 cells in RIPA lysis buffer (25 mM Tris–HCl, 25 mM NaCl, 0.5 mM EDTA, 1% Triton X-100 and 0.1% SDS) containing 1% PMSF, protease inhibitors, and phosphatase inhibitors (Beyotime, Shanghai, China). Protein content was determined by bicinchoninic acid assay (BCA assay, Beyotime, Shanghai, China), and 80 μg of total protein was separated by 10% SDS-PAGE and transferred to a nitrocellulose membrane (NC, Amersham Pharmacia Biotech, England). Membranes were blocked for two hours at room temperature with 5% skimmed milk or 5% BSA in TBST, and then were probed with IRP1-antibody, IRP2-antibody, TfR1-antibody, ferroportin1-antibody, ferritin-antibody, p-JAK2-antibody, p-STAT3-antibody, BMP6-antibody, SMAD4-antibody, p-SMAD1/5/8-antibody, MAPK-antibody, and hepcidin-antibody. β-Actin was used as a loading control. The membranes were then washed and incubated with horseradish peroxidase-conjugated anti-mouse or anti-rabbit secondary antibodies for one hour at room temperature. Membranes were washed again and then developed with enhanced chemiluminescence (ECL, Thermo scientific, Waltham, MA, USA) and visualized with the Gene Gnome XRQ (Syngene, UK). Protein levels were quantified by densitometry using Image J programs (version 1.48v, National Institutes of Health, USA).2.6. Quantitative real-time polymerase chain reaction analysis
Total RNA was extracted from HepG2 cells using Trizol (Invitrogen, Carlsbad, CA, USA) following the manufacturer's protocol. Complementary DNA was synthesized in a 20 μL reaction using the All-in-One™ First-Strand cDNA Synthesis kit (GeneCopoeia, USA). Complementary DNA was diluted in 80 μL of water to achieve 5-fold dilution and then used as the template for real-time quantitative polymerase chain reaction (qRT-PCR). Quantitative reverse transcription PCR was carried out in an ABI 7900 real-time PCR system (Illumina, San Diego, CA, USA) for 40 cycles using the All-in-One™ qPCR SYBR Green Mix (GeneCopoeia, USA). The primers were purchased commercially (Tsingke Biological Technology, Beijing, China). The sequences of the primers used were as follows: hepcidin forward, 5′-CCTGACCAGTGGCTCTGTTT-3′; and reverse, 5′-CACATCCCACACTTTGATCG-3′; β-actin forward, 5′-AGCGAGCATCCCCCAAAGTT-3′, and reverse, 5′-GGGCACGAAGGCTCATCATT-3′. Experiments were performed in triplicate, and each was repeated 3 times with consistent results.2.7. RNA immunoprecipitation analysis
RNA immunoprecipitation (RIP) experiments were performed using a Magna RIP RNA-binding protein immunoprecipitation kit (Millipore) according to the manufacturer's instructions. Antibodies for RIP assays of IRP1 (ab151242) and IRP2 (ab129069) were obtained from Abcam (Cambridge, MA, USA). The co-precipitated RNAs were detected by conventional RT-PCR. The sequences of the primers used were as follows: TfR1 forward, 5′-CAGTGACCTCCATATGTTACAC-3′; and reverse, 5′-ACTAAAACTAAGGCGCTACAG-3′; ferritin-L forward, 5′-CGAGGATCTGTATCTTGCTT-3′, and reverse, 5′-TCGGTGGAATAATTCTGACG-3′. Then the PCR products were electrophoresed on agarose gel and stained with ethidium bromide and the gel was visualized using a standard UV transilluminator and photographed.2.8. Statistical analysis
Data were presented as means ± standard error of mean (SEM). Comparisons between multiple groups in this study were performed by one-way analysis of variance (ANOVA) with either LSD (assuming equal variances) or Dunnett's T3 (not assuming equal variances) for post hoc analysis. A corrected P value less than 0.05 was regarded as statistically significant. All data were analyzed with SPSS version 19.0 software (SPSS, Chicago, IL, USA).3. Results and discussion
3.1. SFE ameliorates anemia and serum iron of IDA rats
After 4 weeks, rats in the IDA group exhibited listless, unresponsive and slow-growing behavior and their ears and paws were obviously pale while these phenomena did not appear in the two SFE treatment groups and NC group, indicating that SFE administration effectively ameliorated IDA-related symptoms of rats. Previous studies have demonstrated that IDA is characterized by low serum concentrations of iron and Hb, decreased HCT, and increased RDW-CV.31 Table 1 showed that the Hb, RBC, HCT, MCV, MCH, MCHC, serum iron, and body weight were distinctly decreased, and the RDW-CV was notably increased in the IDA group rats. Compared to the IDA group, the blood routine, serum iron, and body weights of SFE-treated rats were markedly improved, especially serum iron, MCV, MCH and RDW-CV, which were better than those of the RhEPO group. And there was no obvious difference between the HSFE group and LSFE group. We also evaluated the effects of the chlorophyll derivative (CLD group) and found that it had no significant efficacy for improving iron deficiency anemia. Taken together, these results suggested that SFE exerted an appreciable preventative effect on iron deficiency anemia and the main active ingredient of SFE was sodium iron chlorophyllin rather than the chlorophyll derivative. Recent studies also have proven that the combination of conventional western medicine and sodium iron chlorophyllin can effectively improve anemia conditions in MHD patients.32| NC | IDA | RhEPO | LSFE | HSFE | CLD | |
|---|---|---|---|---|---|---|
| a Hb, hemoglobin; RBC, red blood cell count; HCT, hematocrit; MCV, mean corpuscular volume; MCH, mean corpuscular hemoglobin; MCHC, mean corpuscular hemoglobin concentration; RDW-CV, red blood cell volume distribution width; SI, serum iron; BW, body weight. The values are given as the mean ± SEM, n = 8. #P < 0.05, ##P < 0.01 versus the NC group. *P < 0.05, **P < 0.01 versus the IDA group. | ||||||
| Hb (g L−1) | 153.83 ± 6.43 | 80.67 ± 4.68## | 147.67 ± 12.69** | 137.67 ± 10.99** | 143.00 ± 4.14** | 95.02 ± 14.51 |
| RBC (1012 L−1) | 8.26 ± 0.40 | 6.70 ± 0.36## | 9.39 ± 0.61** | 7.97 ± 0.36** | 8.00 ± 0.22** | 7.23 ± 0.32 |
| HCT (%) | 45.86 ± 1.56 | 28.50 ± 1.72## | 47.47 ± 5.05** | 41.90 ± 6.97** | 46.23 ± 1.30** | 32.14 ± 7.29 |
| MCV (fL) | 56.33 ± 1.65 | 41.92 ± 2.42## | 49.40 ± 6.99* | 52.08 ± 6.95** | 58.03 ± 2.67** | 44.91 ± 4.99 |
| MCH (pg) | 19.15 ± 0.54 | 11.77 ± 0.52## | 15.35 ± 1.85** | 15.82 ± 2.30** | 17.95 ± 0.70** | 13.19 ± 2.02 |
| MCHC (g L−1) | 343.00 ± 5.22 | 282.50 ± 9.57## | 311.50 ± 27.03** | 302.83 ± 8.16** | 309.17 ± 4.54** | 293.38 ± 5.52 |
| RDW-CV (%) | 15.05 ± 0.40 | 30.62 ± 1.74## | 28.43 ± 6.64 | 22.73 ± 4.22** | 19.03 ± 0.18** | 29.44 ± 4.42 |
| SI (mg L−1) | 5.09 ± 0.31 | 1.92 ± 0.07## | 2.27 ± 0.21 | 3.52 ± 0.23** | 3.68 ± 0.27** | 2.25 ± 0.66 |
| BW (g) | 243.14 ± 12.65 | 150.66 ± 10.74## | 157.33 ± 5.33 | 171.83 ± 9.24* | 171.17 ± 7.18* | 155.83 ± 12.55 |
3.2. Effects of SFE on iron-related indices
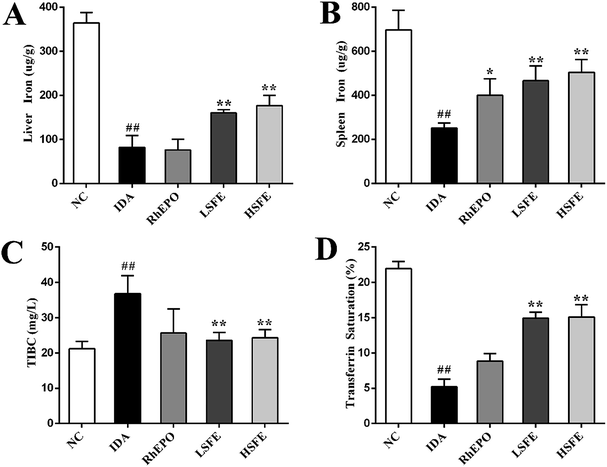
To further determine the effects of SFE on iron metabolism, we examined liver iron and spleen iron contents using a flame atomic-absorption spectrometer. As described in Fig. 1A and B, rats in the IDA group presented a substantial reduction of iron stores. In contrast to the IDA group, SFE intervention observably increased liver iron and spleen iron content. Subsequently, we measured TIBC and serum transferrin saturation, the ratio of serum iron to TIBC, which reflects the balance of iron entering the serum (from intestinal absorption, macrophage iron release, and hepatic iron mobilization) and iron leaving the serum (primarily for utilization in erythropoiesis).33 Fig. 1C and D illustrate that TIBC was remarkably increased and serum transferrin saturation was significantly decreased in the IDA group. These changes were effectively reversed by SFE treatment, and there was no significant difference between the RhEPO group and IDA group. Therefore, it was speculated that SFE not only increased iron supply as an iron supplement, but also may mobilize stored iron for hemoglobin synthesis.3.3. Regulation of SFE on IRP/IRE signaling pathway
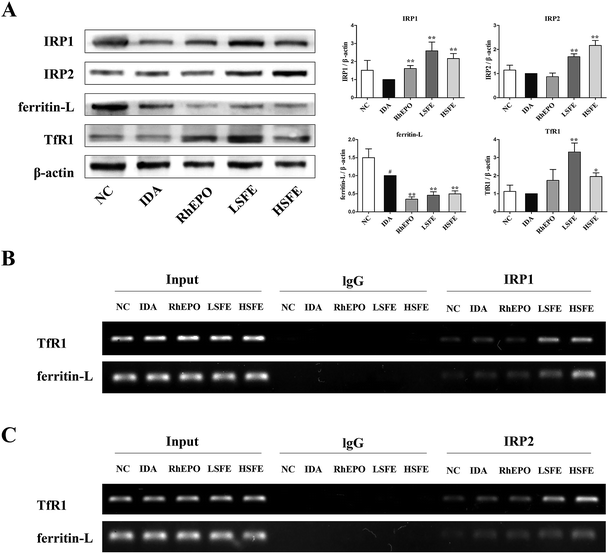
To explore the potential mechanism of SFE on iron metabolism, we analyzed the expressions of ferritin, TfR1, IRP1, and IRP2 in the liver by western blotting. Previous research indicated that IRP/IRE interactions regulate expression of the mRNAs encoding proteins for iron acquisition (TfR1) and storage (ferritin).34 IRP1 and IRP2 are similar (but not identical) proteins with partially overlapping and complementary functions, and control iron metabolism by binding to IREs.23 Under conditions of iron deficiency, IRP1 and IRP2 bind with high affinity to the IRE in the 5′-UTR of ferritin mRNAs, and thereby inhibit their translation by a steric hindrance mechanism. Likewise, they bind to the IREs in the 3′-UTR of TfR1 mRNA and thereby protect it against endonucleolytic degradation. This homeostatic response mediates increased cellular iron uptake from transferrin and prevents storage of iron.35 As shown in Fig. 2A, compared to the IDA group, SFE treatment distinctly decreased ferritin expression, indicating that stored iron may be utilized to fulfill erythropoietic needs. In addition, SFE intervention markedly increased TfR1 expression in the liver. This may decrease the combination of TfR2 and hereditary hemochromatosis protein (HFE), which has higher affinity for TfR1 than TfR2. But TfR1 serves to sequester HFE, and HFE acts to induce hepcidin expression when it binds to TfR2 in hepatocytes.36 As a result, the augment of TfR1 expression in the liver may downregulate the expression of hepcidin. Then, we measured the expression of IRP1 and IRP2 in the liver and found that the IRPs expression of SFE treatment groups were notably higher than those of the IDA group. Moreover, RNA immunoprecipitation (RIP) was conducted to detect the binding affinities of IRPs with IREs. Agarose gel electrophoresis analysis showed that SFE treatment significantly enhanced the binding affinities of IRP1 (Fig. 2B) or IRP2 (Fig. 2C) with the untranslated regions of TfR1 mRNA and ferritin-L mRNA compared to the IDA group. Results of the present study suggested that SFE could enhance the expression of IRPs and the binding affinities of IRPs with TfR1 mRNA and ferritin-L mRNA, thus counteracting iron storage and releasing liver iron into the plasma to satisfy iron demands.3.4. SFE administration inhibits hepcidin expression in IDA rats
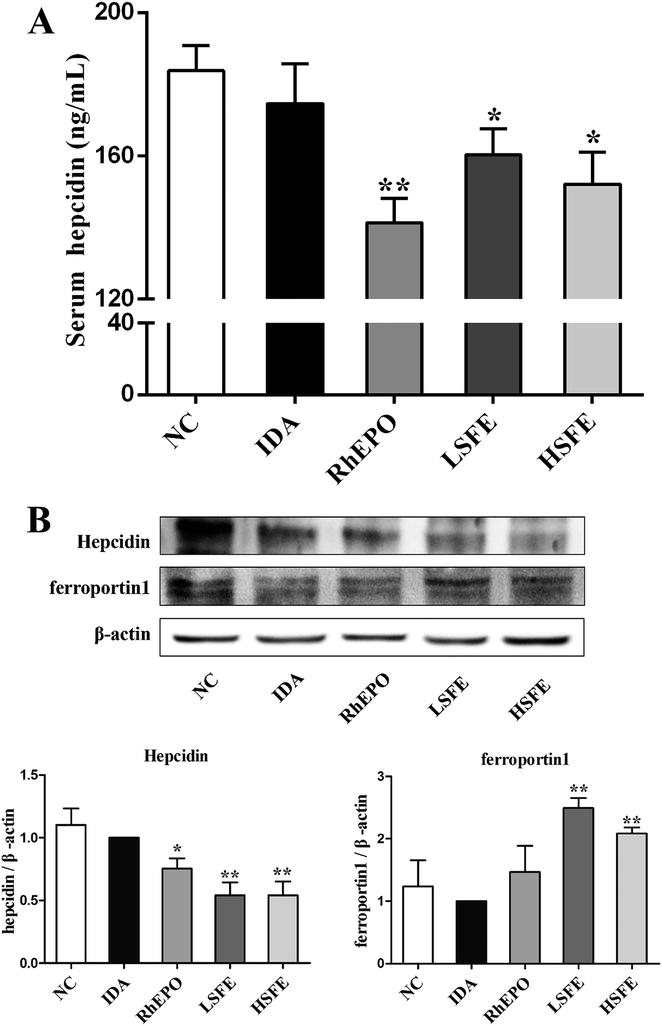
Based on the above results, we assessed the effect of SFE on hepcidin expression, which is regulated by the iron status, erythropoiesis, hypoxia, and inflammation.37 In this study, we measured serum hepcidin levels and the protein expression levels of hepcidin in the liver. As described in Fig. 3A and B, SFE treatment obviously reduced serum hepcidin levels and suppressed hepcidin expression in the liver compared with IDA rats, which were similar to rhEPO treatment. Then, western blot was performed to examine the expression of ferroprotin1, which showed that ferroportin1 expression of SFE-treated groups was much higher than that of the IDA group. Therefore, SFE promoted iron release from macrophages by reducing the internalization and degradation of ferroportin1. Previous studies indicated that the majority of iron came from recycling of senescent erythrocytes by macrophages when iron absorption was insufficient.38 In this way, SFE administration provided adequate iron for erythropoiesis, and further improved iron deficiency anemia.To investigate the potential mechanism in hepcidin suppression caused by SFE, we next explored the expression of proteins involved in the three upstream regulating pathways. The HFE/TfR2 pathway which is affected by iron signals,39 the JAK2/STAT3 pathway which increases hepcidin expression in response to inflammatory mediators,40 and the BMP6/SMAD pathway which mediates hepcidin up-regulation by iron signals and hypoxia.41
3.5. SFE inhibits HFE/TfR2 pathway
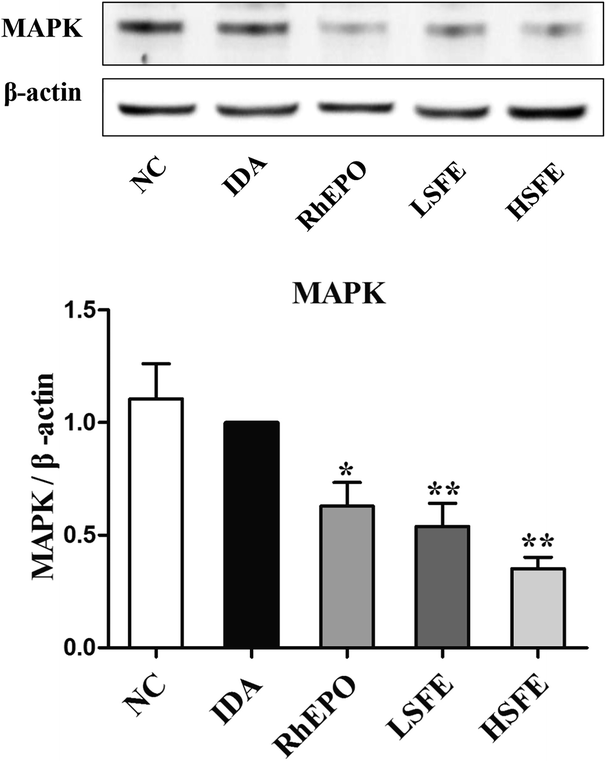
As mentioned above, the HFE/TfR2 pathway is involved in iron-dependent regulation of hepcidin.42 HFE competes with transferrin-bound iron (Fe2-Tf) for binding to TfR1 due to overlapping binding sites on TfR1, while TfR2 can simultaneously interact with both HFE and Fe2-Tf.36 When serum Fe2-Tf levels increase, HFE is released from TfR1 and binds to TfR2 to form a HFE/TfR2/Tf complex,43 which activates its downstream protein MAPK to translocate to the nucleus, bind to BMP-responsive elements, and upregulate hepcidin transcription.44 To explore whether SFE treatment could attenuate the HFE/TfR2 signaling pathway, we analyzed the protein expression levels of MAPK. In SFE treatment groups, a significant reduction was observed in MAPK expression compared with the IDA group (Fig. 4). Collectively, the increase of TfR1 expression and the decrease of MAPK expression by SFE intervention suppressed the HFE/TfR2 signaling pathway, which further inhibited hepcidin expression.3.6. SFE blocks JAK2/STAT3 pathway in vivo and in vitro
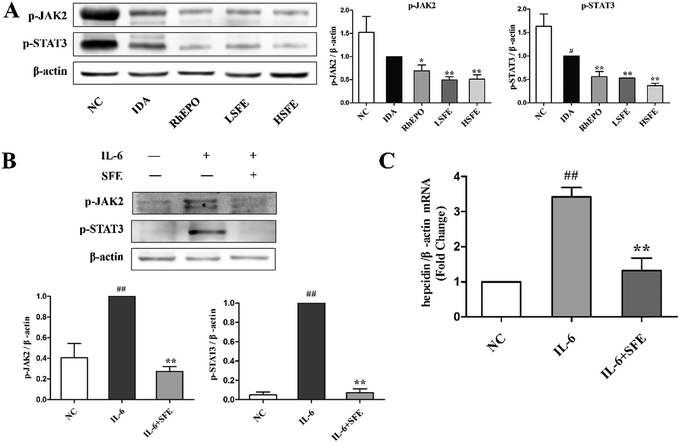
Previous studies showed that inflammation stimulates hepcidin expression.45 Although several pro-inflammatory cytokines have been shown to increase hepcidin expression, the inflammatory cytokine IL-6 has been the best studied. IL-6 is a major inducer of hepcidin expression both in vivo and in vitro.46 It binds to the IL-6 receptor to form an interleukin receptor–ligand complex that activates the JAK2/STAT3 signaling and phosphorylates the STAT3 protein to p-STAT3. Then, p-STAT3 translocates from the cytoplasm to the nucleus and induces the transcription of the hepcidin gene by binding to the STAT3-responsive element on the hepcidin promoter.47,48Fig. 5A illustrates that SFE administration notably reduced the expression of p-JAK2 and p-STAT3 proteins in the liver, which was similar to the effects of rhEPO. Moreover, to confirm the involvement of JAK2/STAT3 pathway inhibition by SFE in hepcidin expression, we treated the HepG2 cells with IL-6. Western blot and qRT-PCR analyses were performed with HepG2 cells. Fig. 5B shows that the expressions of p-JAK2 and p-STAT3 proteins were dramatically increased after IL-6 stimulation but were attenuated by SFE. And qRT-PCR analysis showed that hepcidin expression was markedly enhanced after the IL-6 challenge but was inhibited by SFE (Fig. 5C). These results indicated that SFE could downregulate hepcidin expression by blocking the JAK2/STAT3 signaling pathway in vivo and in vitro.
3.7. SFE suppresses BMP6/SMAD pathway in vivo and in vitro
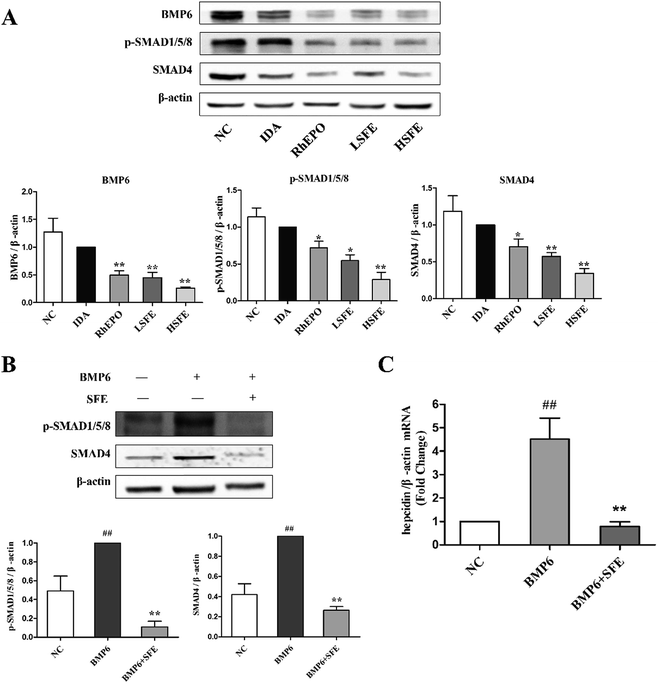
It is recognized that the BMP6/SMAD signaling pathway plays a major role in hepcidin regulation and iron homeostasis.49 BMP6 is the specific endogenous regulator of hepcidin,50 acting by binding to the BMP type II receptor, which results in the phosphorylation of BMP type I receptor. And this in turn initiates the phosphorylation of the transcription factors SMAD1/5/8, which subsequently forms a complex with SMAD4 and translocates to the nucleus. Then, the complex binds to the BMP-responsive elements on the hepcidin promoter and upregulates the transcription of hepcidin gene.51,52 Our studies showed that SFE tremendously reduced the expression levels of BMP6, SMAD4, and p-SMAD1/5/8 in comparison with the IDA group (Fig. 6A). Furthermore, to ascertain the effects of SFE on BMP6-induced hepcidin expression in HepG2 cells, we evaluated the expression levels of hepcidin and downstream proteins of the BMP6 signaling pathway. As shown in Fig. 6B and C, the binding of BMP6 to its receptors caused an elevation of p-SMAD1/5/8 and SMAD4 expression, and hepcidin mRNA levels were also significantly increased after BMP6 challenge. While compared to the BMP6 group, SFE intervention distinctly inhibited SMAD4 expression, SMAD1/5/8 phosphorylation, and hepcidin expression induced by BMP6. As revealed by these results, SFE could inhibit the BMP6/SMAD signaling pathway and lead to hepcidin suppression.4. Conclusion
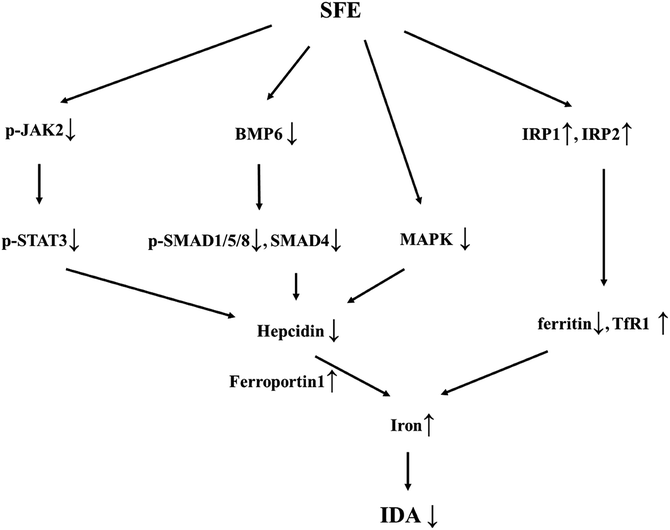
In conclusion, the present study demonstrated that SFE not only replenished iron supply as an iron source, but also increased IRPs expression and suppressed hepcidin expression by blocking JAK2/STAT3, BMP6/SMAD, and HEF/TfR2 pathways (Fig. 7), which promoted the release of stored iron. In this manner, SFE supplied sufficient iron to meet erythropoietic needs, resulting in a significant preventative effect on iron deficiency anemia. Considering its role in regulating iron metabolism and hepcidin expression, SFE may be used as prophylactic administration in diseases that may cause iron deficiency anemia and applied in diseases associated with hepcidin over-expression. Further studies on intestinal iron absorption may provide a greater understanding of SFE in iron metabolism.Conflicts of interest
There are no conflicts of interest to declare.Acknowledgements
We would like to express our thanks to Analysis and Testing Center of Huazhong University of Science.References
- Y. S. Kim, J. J. Lee, S. Y. Lee, T. G. Jo and C. Kim, RSC Adv., 2016, 6, 61505–61515 RSC.
- C. Pan, K. Wang, S. Ji, H. Wang, Z. Li, H. He and Y. Huo, RSC Adv., 2017, 7, 36007–36014 RSC.
- P. Santiago, Sci. World J., 2012, 2012, 846824 CrossRef PubMed.
- B. Y. Srinivasu, G. Mitra, M. Muralidharan, D. Srivastava, J. Pinto, P. Thankachan, S. Suresh, A. Shet, S. Rao, G. Ravikumar, T. S. Thomas, A. V. Kurpad and A. K. Mandal, RSC Adv., 2015, 5, 61678–61687 RSC.
- K. E. McColl, Am. J. Gastroenterol., 2009, 104(suppl. 2), S5–S9 CrossRef CAS PubMed.
- L. Maiden, B. Thjodleifsson, A. Theodors, J. Gonzalez and I. Bjarnason, Gastroenterology, 2005, 128, 1172–1178 CrossRef.
- G. Weiss and L. T. Goodnough, N. Engl. J. Med., 2005, 352, 1011–1023 CrossRef CAS PubMed.
- C. Enjuanes, I. T. Klip, J. Bruguera, M. Cladellas, P. Ponikowski, W. Banasiak, D. J. van Veldhuisen, P. van der Meer, E. A. Jankowska and J. Comin-Colet, Int. J. Cardiol., 2014, 174, 268–275 CrossRef PubMed.
- S. Fishbane, S. Pollack, H. I. Feldman and M. M. Joffe, Clin. J. Am. Soc. Nephrol., 2009, 4, 57–61 CrossRef CAS PubMed.
- J. A. Gilreath, D. D. Stenehjem and G. M. Rodgers, Am. J. Hematol., 2014, 89, 203–212 CrossRef PubMed.
- C. Masson, Jt., Bone, Spine, 2011, 78, 131–137 CrossRef CAS PubMed.
- J. Chung, M. S. Kim and S. N. Han, Nutr. Res., 2011, 31, 915–921 CrossRef CAS PubMed.
- A. Lopez, P. Cacoub, I. C. Macdougall and L. Peyrin-Biroulet, Lancet, 2016, 387, 907–916 CrossRef CAS.
- W. Reinisch, M. Staun, S. Bhandari and M. Munoz, J. Crohns Colitis, 2013, 7, 429–440 CrossRef PubMed.
- C. Camaschella, Hematology, 2015, 2015, 8–13 CrossRef PubMed.
- A. Kumar, S. Jain, N. P. Singh and T. Singh, Int. J. Gynecol. Obstet., 2005, 89, 7–13 CrossRef CAS PubMed.
- R. F. Hurrell, M. B. Reddy, M. A. Juillerat and J. D. Cook, Am. J. Clin. Nutr., 2003, 77, 1213–1219 CAS.
- M. Brune, L. Rossander and L. Hallberg, Am. J. Clin. Nutr., 1989, 49, 542–545 CAS.
- S. Miret, S. Tascioglu, M. van der Burg, L. Frenken and W. Klaffke, J. Agric. Food Chem., 2010, 58, 1327–1332 CrossRef CAS PubMed.
- X. Cheng, G. Yu, J. Hu, X. Xu, F. Luo, P. Shen, G. Zhang and N. Yang, Exp. Ther. Med., 2016, 12, 157–160 CrossRef CAS PubMed.
- M. W. Hentze, M. U. Muckenthaler, B. Galy and C. Camaschella, Cell, 2010, 142, 24–38 CrossRef CAS PubMed.
- Y. Zhang, X. Sun, C. Xie, X. Shu, A. O. Oso, Z. Ruan, Z. Y. Deng, X. Wu and Y. Yin, Genes Nutr., 2015, 10, 54 CrossRef PubMed.
- S. Recalcati, G. Minotti and G. Cairo, Antioxid. Redox Signaling, 2010, 13, 1593–1616 CrossRef CAS PubMed.
- E. Nemeth and T. Ganz, Annu. Rev. Nutr., 2006, 26, 323–342 CrossRef CAS PubMed.
- T. Ganz and E. Nemeth, Biochim. Biophys. Acta, Mol. Cell Res., 2012, 1823, 1434–1443 CrossRef CAS PubMed.
- X. Du, E. She, T. Gelbart, J. Truksa, P. Lee, Y. Xia, K. Khovananth, S. Mudd, N. Mann, E. M. Moresco, E. Beutler and B. Beutler, Science, 2008, 320, 1088–1092 CrossRef CAS PubMed.
- G. J. Handelman and N. W. Levin, Heart Failure Rev., 2008, 13, 393–404 CrossRef.
- Y. Zhang, Y. Cheng, N. Wang, Q. Zhang and K. Wang, Food Funct., 2014, 5, 1381–1388 CAS.
- F. R. Wang, Z. G. Xie, X. Q. Ye, S. G. Deng, Y. Q. Hu, X. Guo and S. G. Chen, Food Funct., 2014, 5, 123–128 CAS.
- X. G. Zhang, G. X. Wei, W. N. Wang, G. D. Ma, P. Tang and X. Q. Chen, Food Funct., 2016, 7, 3184–3192 CAS.
- J. Diaz-Castro, M. J. Alferez, I. Lopez-Aliaga, T. Nestares, S. Granados, M. Barrionuevo and M. S. Campos, Nutrition, 2008, 24, 1167–1173 CrossRef CAS PubMed.
- X. F. Xu, J. P. Hu, X. Cheng, G. J. Yu, F. Luo, G. S. Zhang, N. Yang and P. Shen, J. Biol. Regul. Homeostatic Agents, 2016, 30, 135–140 CAS.
- P. J. Schmidt, P. T. Toran, A. M. Giannetti, P. J. Bjorkman and N. C. Andrews, Cell Metab., 2008, 7, 205–214 CrossRef CAS PubMed.
- T. A. Rouault, Nat. Chem. Biol., 2006, 2, 406–414 CrossRef CAS PubMed.
- N. Wilkinson and K. Pantopoulos, Front. Pharmacol., 2014, 5, 176 Search PubMed.
- J. Gao, J. Chen, M. Kramer, H. Tsukamoto, A. S. Zhang and C. A. Enns, Cell Metab., 2009, 9, 217–227 CrossRef CAS PubMed.
- G. Nicolas, C. Chauvet, L. Viatte, J. L. Danan, X. Bigard, I. Devaux, C. Beaumont, A. Kahn and S. Vaulont, J. Clin. Invest., 2002, 110, 1037–1044 CrossRef CAS PubMed.
- P. Ruchala and E. Nemeth, Trends Pharmacol. Sci., 2014, 35, 155–161 CrossRef CAS PubMed.
- M. Poli, M. Asperti, P. Ruzzenenti, M. Regoni and P. Arosio, Front. Pharmacol., 2014, 5, 86 Search PubMed.
- D. M. Wrighting and N. C. Andrews, Blood, 2006, 108, 3204–3209 CrossRef CAS PubMed.
- L. Kautz, D. Meynard, A. Monnier, V. Darnaud, R. Bouvet, R. H. Wang, C. Deng, S. Vaulont, J. Mosser, H. Coppin and M. P. Roth, Blood, 2008, 112, 1503–1509 CrossRef CAS PubMed.
- P. J. Schmidt, P. T. Toran, A. M. Giannetti, P. J. Bjorkman and N. C. Andrews, Cell Metab., 2008, 7, 205–214 CrossRef CAS PubMed.
- F. D'Alessio, M. W. Hentze and M. U. Muckenthaler, J. Hepatol., 2012, 57, 1052–1060 CrossRef PubMed.
- L. Rochette, A. Gudjoncik, C. Guenancia, M. Zeller, Y. Cottin and C. Vergely, Pharmacol. Ther., 2015, 146, 35–52 CrossRef CAS PubMed.
- E. Nemeth, E. V. Valore, M. Territo, G. Schiller, A. Lichtenstein and T. Ganz, Blood, 2003, 101, 2461–2463 CrossRef CAS PubMed.
- S. N. Song, N. Tomosugi, H. Kawabata, T. Ishikawa, T. Nishikawa and K. Yoshizaki, Blood, 2010, 116, 3627–3634 CrossRef CAS PubMed.
- F. M. Verga, S. M. Vujic, R. Kessler, J. Stolte, M. W. Hentze and M. U. Muckenthaler, Blood, 2007, 109, 353–358 CrossRef PubMed.
- D. M. Wrighting and N. C. Andrews, Blood, 2006, 108, 3204–3209 CrossRef CAS PubMed.
- N. L. Parrow and R. E. Fleming, Annu. Rev. Nutr., 2014, 34, 77–94 CrossRef CAS PubMed.
- B. J. Andriopoulos, E. Corradini, Y. Xia, S. A. Faasse, S. Chen, L. Grgurevic, M. D. Knutson, A. Pietrangelo, S. Vukicevic, H. Y. Lin and J. L. Babitt, Nat. Genet., 2009, 41, 482–487 CrossRef CAS PubMed.
- C. Mayeur, P. A. Leyton, S. A. Kolodziej, B. Yu and K. D. Bloch, Blood, 2014, 124, 2116–2123 CrossRef CAS PubMed.
- Y. Xia, J. L. Babitt, Y. Sidis, R. T. Chung and H. Y. Lin, Blood, 2008, 111, 5195–5204 CrossRef CAS PubMed.
Footnote |
| † Electronic supplementary information (ESI) available. See DOI: 10.1039/c7ra09576g |
| This journal is © The Royal Society of Chemistry 2017 |

