
 Open Access Article
 This Open Access Article is licensed under a
 Creative Commons Attribution 3.0 Unported Licence
The facile preparation of Ag decorated TiO2/ZnO nanotubes and their potent photocatalytic degradation efficiency
Shengzhe Zhao†
 a,
Zhiqiang Cheng†*ab,
Lijuan Kanga,
Mingtang Lia and
Zhiling Gaoc
a,
Zhiqiang Cheng†*ab,
Lijuan Kanga,
Mingtang Lia and
Zhiling Gaoc
aCollege of Resources and Environment, Jilin Agriculture University, Changchun 130118, China. E-mail: czq5974@163.com
bSchool of Aerospace Engineering, Tsinghua University, Beijing 100000, China
cCollege of Chemistry, Jilin University, Changchun 130118, China
First published on 27th October 2017
Abstract
Hollow TiO2 and TiO2/ZnO nanotubes were produced using a simple and novel approach combining electrospinning with an impregnation calcination method. Using a photoreduction method, silver nanoparticles (AgNps) were successfully decorated on the surface of nanotubes. During the synthesis process, the electrospinning procedure provided sacrificial templates for the fabrication of hollow nanotubes by producing PAN nanofibers, which can be immobilized on the TiO2 surface through a soaking method. Later, the composite nanofibers of TiO2/PAN were calcined into pure TiO2 nanotubes after complete combustion of the sacrificial templates. The morphology of the samples was characterized by scanning electron microscopy (SEM) and transmission electron microscopy (TEM). The structure and components of the samples were characterized by X-ray diffraction (XRD), energy dispersive X-ray analysis (EDX) and X-ray photoelectron spectroscopy (XPS). Upon blending ZnO into TiO2, a new crystallite ZnTiO3 was formed in addition to the ZnO and TiO2 crystallites, and the ultra-violet light absorption efficiency was detected using UV-vis diffuse reflectance spectroscopy (DRS). The photocatalytic properties were evaluated using the degradation of methyl orange (MO) dye. As observed from the results, the Ag/TiO2/ZnO nanotubes could degrade MO efficiently under UV irradiation, which showed excellent photocatalytic activity compared to pure TiO2. The synthetic mechanism of Ag/TiO2/ZnO nanotubes and the mechanism for the enhanced photocatalytic activity have been proposed.
Introduction
One-dimensional (1-D) semiconductor nanostructures have been utilized in the fields of sensing, solar energy conversion, catalysis, biomedicine and in various electronic components because of their excellent physical and chemical properties.1–4 Among the copious inorganic nanostructures reported, titanium dioxide (TiO2), a multifunctional semiconductor metal oxide, has attracted an extensive amount of research attention because of its unique optical, electronic, and antibacterial properties.5–7 Recently, the application of TiO2 photocatalysts has mainly been focused on decomposing organic pollutants in contaminated air or water, which is of importance for environmental protection.8,9 Although notable advances have been made, the high recombination rate of the photogenerated electron/hole pairs and the low utilization rate of ultra-violet light hinders their further application in industry.10–12 Therefore, a number of research groups have made great efforts to study the fabrication of photocatalysts with unique nanostructures.13 Compared with traditional TiO2 crystals, nanostructured TiO2 materials show enhanced photocatalytic activity due to their surface active sites, crystalline structure, specific surface area, crystal morphology and crystal size.14–19 With the development of nanotechnology, structures with special shapes have been prepared for nanocrystalline TiO2 in the form of nanorods, nanoflowers, nanotubes, nanofibers, and nanoparticles.20–24 To date, TiO2 nanotubes have been extensively pursued as a quintessential photocatalyst by virtue of their high surface-to-volume ratio and superior physicochemical properties.25 Moreover, TiO2 nanotubes have been shown to manifest intrinsic advantages over their TiO2 nanoparticle counterparts in terms of their size, shape, structure and properties. Moreover heterogeneous photocatalysts have also made significant progress in the field of photocatalysis.26–28 Coupling TiO2 with other semiconductors and noble metal-based heterostructures or composites provides a beneficial solution for their photocatalytic applications.5In addition, zinc oxide (ZnO) is also an excellent n-type semiconductor exhibiting comparable efficiency in various photocatalytic reactions to TiO2.29 Semiconductors comprising ZnO or noble metal silver modified TiO2 have been studied to improve the photocatalytic effect,30–32 which can reduce the recombination of charge carriers and increase the rate of the electron-transfer process.28 The most commonly used modification methods include the microemulsion hydrothermal process, metal–organic chemical vapor deposition, template induced method and wet chemical method, which have been used to successfully synthesize the desired heterostructures.33–36 To date, the synthesis methods used to prepare hollow nanotubes have included anodic oxidation to produce metal oxide nanotubes, hydrothermal treatment of fine TiO2 particles with an alkaline solution and chemical or physical deposition on sacrificial colloidal templates.37,38 These methods are often confronted with problems such as template removal, tedious operation procedures, and poor adhesion of nanotube to the underlying substrate.37 A simple and efficient synthesis method for hollow heterostructured nanotubes is constantly being looked for.
In this study, hollow TiO2, ZnO and TiO2/ZnO nanotubes were produced using a simple and novel approach combining electrospinning with an impregnation calcination method. Silver nanoparticles (AgNps) were successfully and efficiently decorated on the surface and inner walls of the TiO2/ZnO nanotubes. The surface morphology and dimensions of the samples were observed by SEM and TEM. XRD, XPS and EDX analyses identified that the sample was pure TiO2 with an anatase structure and the AgNps and ZnO were modified successfully. Because the hollow nanotube structure can provide a larger specific surface area and more active sites, the hybrid nanoparticles can increase the rate of electron-transfer process and reduce the recombination of charge carriers that the Ag/TiO2/ZnO photocatalyst have a much higher photocatalytic activity than pure TiO2.
Experimental
Materials
Polyacrylonitrile (PAN, Mw ≈ 80![[thin space (1/6-em)]](https://www.rsc.org/images/entities/char_2009.gif) 000), tetrabutyl titanate (TBOT, 97%), AgNO3 and methyl orange (MO) were purchased from Aladdin; N,N-dimethylformamide (DMF, 99%), absolute ethanol and zinc acetate (99%) were obtained from Beijing chemical works. All of the chemicals used in our experiments were of analytical grade and used without further purification.
000), tetrabutyl titanate (TBOT, 97%), AgNO3 and methyl orange (MO) were purchased from Aladdin; N,N-dimethylformamide (DMF, 99%), absolute ethanol and zinc acetate (99%) were obtained from Beijing chemical works. All of the chemicals used in our experiments were of analytical grade and used without further purification.
Methods
The solution was prepared by adding 0.62 g of PAN to 5.0 mL of DMF with magnetic stirring at 50 °C. After PAN was completely dissolved in DMF, the prepared precursor solution was loaded into a syringe, which was connected to a 16 kV high voltage. The flow rate of the solution was controlled at 0.5 mL h−1 and the distance from the needle to the rotate acceptor was 14 cm. The composite polymer films were prepared in a fume hood with the humidity kept below 30%. Then, the PAN fibers were soaked in the TBOT/ethanol precursor solution for 5 min in which the volume ratio of TBOT to ethanol solution was 1:10. After complete infiltration, the composite precursor fibers were placed in the air to dry naturally and were named P0. To obtain the TiO2/ZnO nanotubes, a certain amount of zinc acetate was dissolved in 10 mL of the TBOT ethanol solution. The composite fibers in which the precursor solution contained 0.01, 0.05 and 0.10 g of zinc acetate were named P1, P2 and P3, respectively.
The last step was calcination. The P0 to P3 precursors were calcined in a vacuum atmosphere at 550 °C for 2 h at a heating rate of 2 °C min−1 to stabilize the morphology of the precursor fibers. Meanwhile, vacuum calcining could carbonize the PAN fibers so that the sacrificial templates were decomposed completely in the subsequent aerobic calcination conditions. The precursor carbide fibers were calcined at 550 °C for 2 h to completely burn the carbide sacrificial templates at a heating rate of 2 °C min−1. After annealing, the hollow TiO2 and TiO2/ZnO nanotubes were obtained. The TiO2/ZnO samples were named TZ1, TZ2, and TZ3. As the final step, decoration with the AgNps was carried out using the TZ2 sample, which showed the best catalytic effect for further investigation. TZ2 was immersed in a 0.01 M AgNO3 solution with magnetic stirring in the dark for 1 h. Subsequently, the mixture was subjected to UV irradiation for 5 min. After cleaning and drying, the Ag decorated TiO2/ZnO nanotubes were obtained, and the Ag/TiO2/ZnO samples were named as ATZ.
Characterization
Information on the phases and purity of the samples was obtained by X-ray powder diffraction (XRD) measured on a D/MAX 2250 V diffractometer (Rigaku, Japan) using Cu Kα radiation (λ = 0.15418 nm) under 40 kV and 30 mA, and the scanning range was from 20° to 80°. The morphologies of the TiO2/ZnO nanotubes were observed by scanning electron microscopy (SEM, SHIMADZU X-550) equipped with energy dispersive X-ray analysis (EDX) and transmission electron microscopy (TEM, Tecnai G2, operating voltage: 15 kV). X-ray photoelectron spectroscopy (XPS) was performed on a VG ESCALAB LKII instrument with a Mg-Kα-ADES source (hν = 1253.6 eV) at a residual gas pressure below 1028 Pa. Photoluminescence (PL) spectra were measured on a fluorescence spectrometer (Hitachi F-4500) at an excitation wavelength of 370 nm. UV-vis spectra were recorded on a UV-vis spectrophotometer (Shimadzu, UV-2550) over a scanning range from 300 to 800 nm. The degradation process was monitored using UV-vis spectrophotometry measuring the absorption of MO at 465 nm.Photocatalytic experiments for MO
Methyl orange (MO) has been vastly used as a model compound to indicate photocatalytic activity, which is primarily attributed to its frequent occurrence in industrial waste discharge. The photocatalytic activity of the as-prepared samples was evaluated using the decomposition of MO under ultraviolet light irradiation. An aqueous solution of MO (40 mL, 10 mg L−1) was placed in a vessel and the samples (40 mg) were added. Then, the solution was magnetically stirred in the dark for 2 h to ensure the establishment of an adsorption–desorption equilibrium between the MO dye and the as-prepared samples. Later the mixture was exposed to an ultra-violet radiation lamp (Philips, TL/05, 125 W, distance 5 cm, spot size 365 nm), and the suspensions were magnetically stirred at ambient temperature to ensure that all of the catalysts were in contact with the dye solution. At given time intervals, a few millilitres of the solution were drawn from the mixture and centrifuged to separate the samples. Then, the solution was loaded into a UV-vis spectrophotometer (Shimadzu, UV-2550). The degradation efficiency of MO was monitored by comparing the characteristic absorption intensity of MO at 465 nm at different times with that of the original MO.Results and discussion
Fig. 1 shows the XRD patterns of the samples. The strong and sharp diffraction peaks indicate that the products were well crystallized. The figure shows that the main diffraction peaks of TiO2 located at 25.4°, 37.9°, 48.2°, 55.2° and 62.8° can be indexed to the (101), (004), (200), (211) and (204) directions, which characterize the anatase structure of TiO2 (JCPDS 21-1272) and no by-product peaks are found, illustrating that the purity of the sample was high. Compared with pure TiO2, the TZ2 and TZ3 samples display weak peaks at 32.8°, 35.3°, 48.9° and 53.5°, confirming the formation of the ZnTiO3 phase (JCPDS 26-1500), and there was also a certain amount of rutile phase at 27.4° in all of the TiO2/ZnO samples. Compared with the diffraction pattern of the three TiO2/ZnO samples, the peaks for ZnTiO3 and rutile show an enhanced trend due to the addition of metal ions (Zn2+), which indicates the Zn2+ could impede the TiO2 transition from anatase to rutile.38,39 Compared with pure TiO2/ZnO, the pattern observed for the ATZ sample showed weak peaks at 44.58° and 64.68°, which can be indexed to the (200) and (220) directions of Ag (JCPDS 03-0921), respectively and this phenomenon may due to the modified Ag being very small. The d-spacing of anatase at the (101) plane observed for ATZ was calculated to be 3.53 Å. This is in good agreement with the measured value observed from the HRTEM image (Fig. 3D).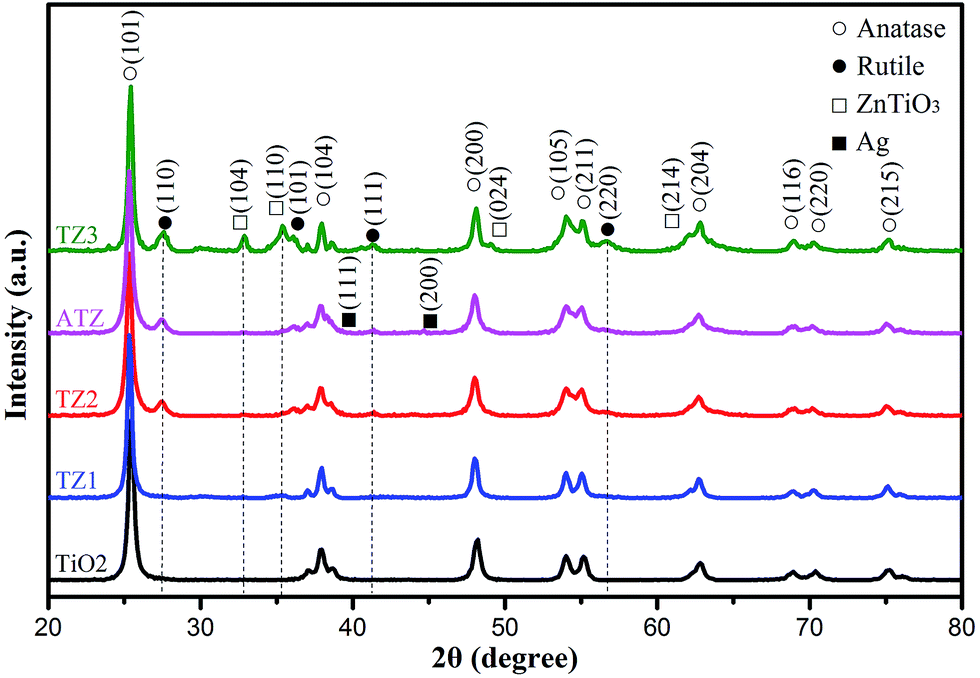 | ||
| Fig. 1 The XRD patterns of the samples. | ||
Morphology and formation mechanism
The morphology of the samples was characterized by SEM and TEM. Fig. 2A shows that PAN nanofibers with high porosity were produced by the electrospinning technique and used as the templates for fabricating the hollow nanotubes. Fig. 2B presents the porous ZnO hollow nanotubes, which were obtained by replacing the TBOT solution with a zinc acetate ethanol solution (mass fraction: 10%) keeping the other operations the same. The XRD pattern displayed in the inset demonstrates that the ZnO crystallites have a hexagonal crystalline phase. Fig. 2C demonstrates that the TiO2 samples are mainly comprise relatively regular and uniform smooth nanotubes. The mean diameter of the TiO2 nanotubes was 300 nm and the uniformity was above 80%, which indicate that the TBOT/ethanol solution permeates into the surface of the PAN template fibers successfully and without any aggregation in the calcination process. The SEM images of the three types of TiO2/ZnO samples are shown in Fig. 2D–F. Comparing the SEM images of TiO2, TZ1 and TZ2, we found that there were no differences in the morphology on the surface after doping with ZnO, which indicated that there was no obvious aggregation observed for the ZnO nanoparticles, and the ZnAc/TBOT/ethanol solution was evenly distributed on the surface of the fibers. Because of the existence of Zn ions, the TiO2 particles would react with zinc acetate to form the lattice type of ZnTiO3. Notably, TZ3 shown in Fig. 2F has a relatively rough surface, which may be due to too much Zn2+ doping leading to excessive internal stress in the crystallization process.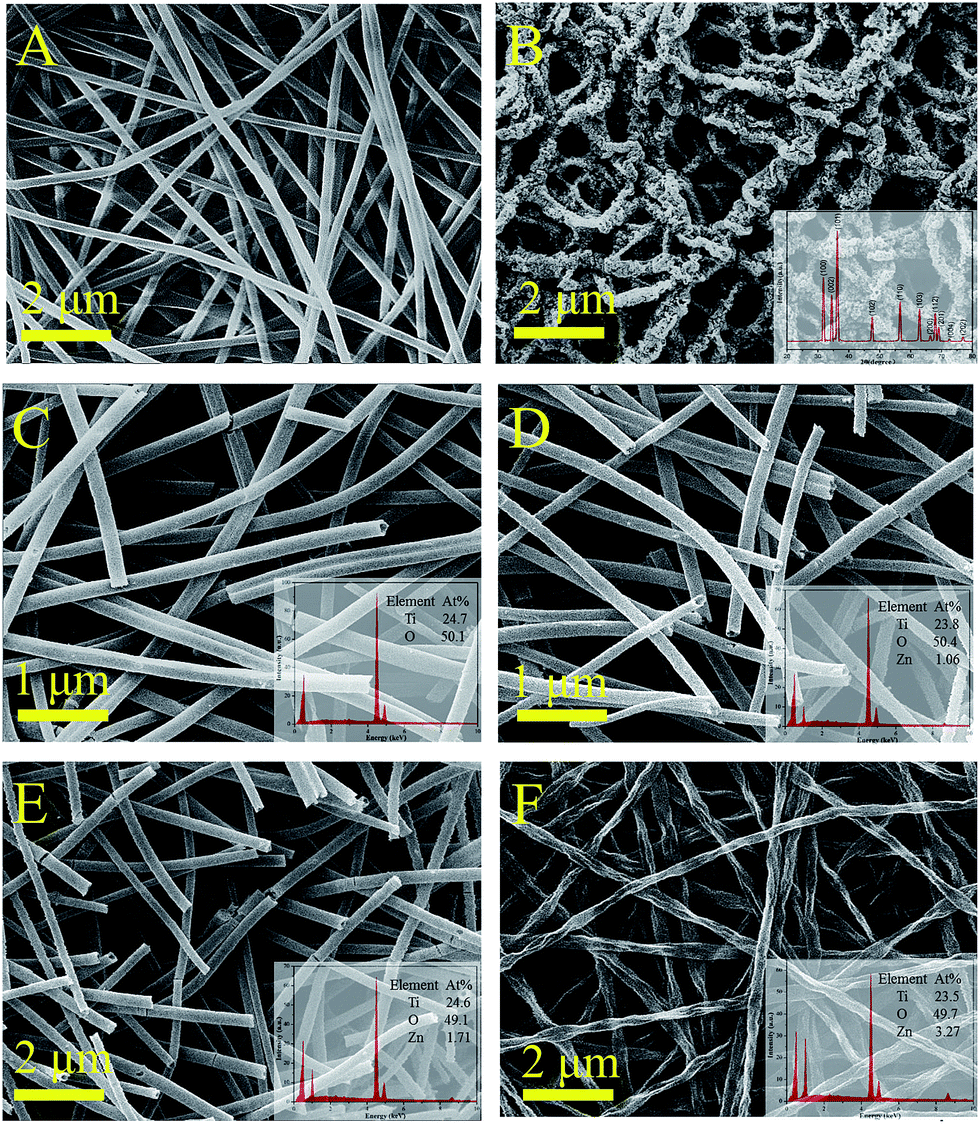 | ||
| Fig. 2 The SEM and the EDX (inset) images of the samples: (A) PAN nanofibers, (B) ZnO porous nanotubes, (C) TiO2 nanotubes, (D) TZ1 nanotubes, (E) TZ2 nanotubes and (F) TZ3 nanotubes. The XRD patterns are shown in the insets. | ||
Fig. 3B shows the SEM images of the ATZ nanotubes, which demonstrate no difference from the TiO2 nanotubes, which may be because the AgNps are very small. For proof of the existence of the AgNps, TEM was used to further examine the morphology of the samples. As shown in Fig. 3C, the TEM image of the ATZ sample clearly shows that the ZnO and AgNps are uniformly distributed on the surface compared with the TiO2 nanotubes (Fig. 3A). The diameter of the AgNps were in the range 5–30 nm, which demonstrate that the silver decoration was successful. Fig. 3D is the HRTEM image of ATZ, which was obtained under the same conditions as those for ATZ nanotubes displayed in Fig. 3C. The crystal lattice can be observed directly with d spacings of 0.285 nm and 0.237 nm corresponding to ZnO (100) and Ag (111), which are in good agreement with the XRD results and strong evidence for the existence of ZnO and the AgNps.
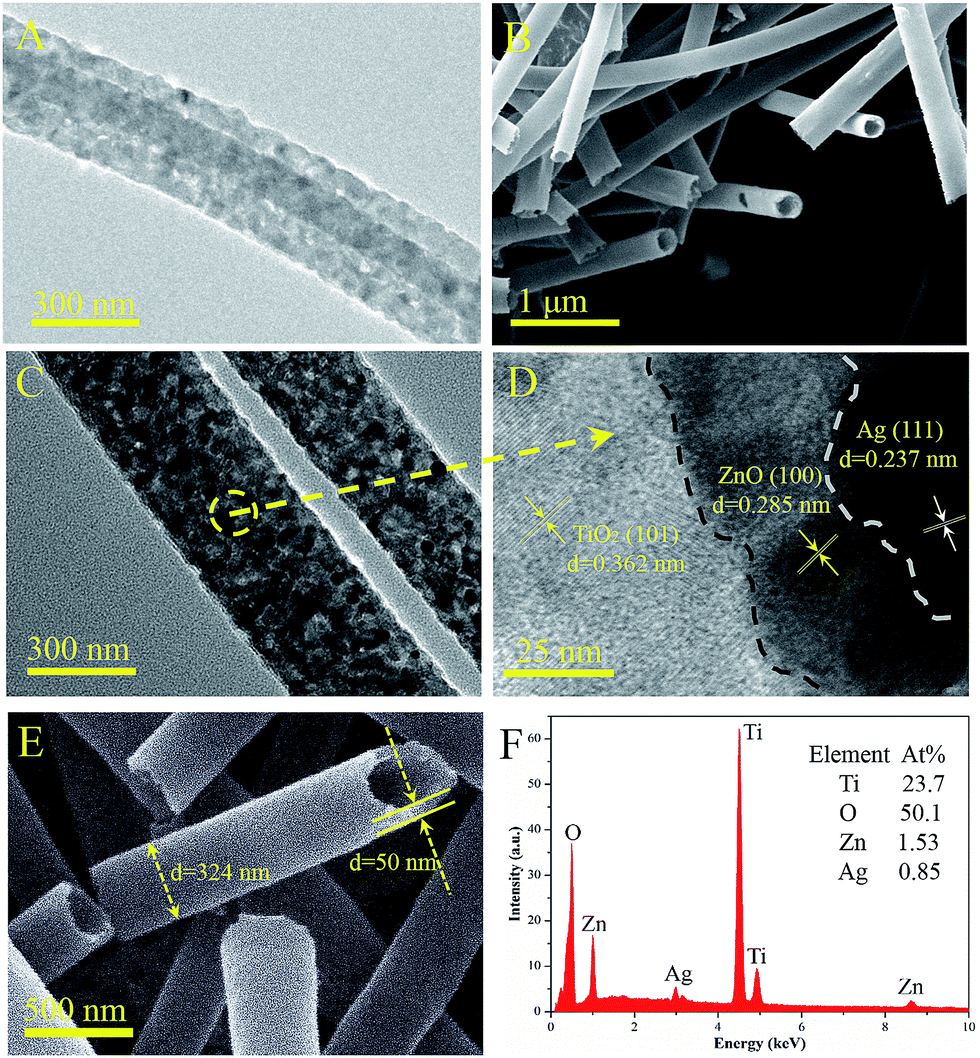 | ||
| Fig. 3 The TEM image of the TiO2 nanotubes (A). SEM image of the ATZ nanotubes (B). The TEM image of the ATZ nanotubes (C) and the HRTEM of the ATZ nanotubes (D). A high magnification SEM image of a ATZ nanotube (E) and the EDX spectra of the ATZ nanotubes (F). | ||
X-ray photoelectron spectroscopy (XPS) was introduced to clarify the elemental and chemical states in the samples. As shown in Fig. 4A, the Ti, Zn, Ag and O elements were visible in the fully scanned spectra of pure TiO2 and the ATZ sample, respectively. However, the spectra show not only Ti, Zn, Ag and O elements but also some C elements. In the EDX of the samples, we can only observe Ti, Zn, Ag and O. The XPS peak for C 1s can be ascribed to the hydrocarbons from the XPS instrument itself. The high resolution XPS spectra of Ti 2p are exhibited in Fig. 4B. The Ti 2p spectra show peaks at 458.2 eV and 463.8 eV, which correspond to Ti 2p3/2 and Ti 2p1/2, respectively. The distance between the two peaks was 5.6 eV, which is identical to that of neat TiO2, indicating that Ti was in the form of Ti4+.33 However, comparing to the Ti 2p of TiO2, the Ti 2p binding energy of ATZ was increased for the lower Fermi level than that of TiO2.39 These phenomena are attributed to the formation of Ag–Ti–O–Zn, which causes a change in the electrons surrounding Ti and was in accordance with the formation of ZnTiO3 suggested in the XRD spectrum.
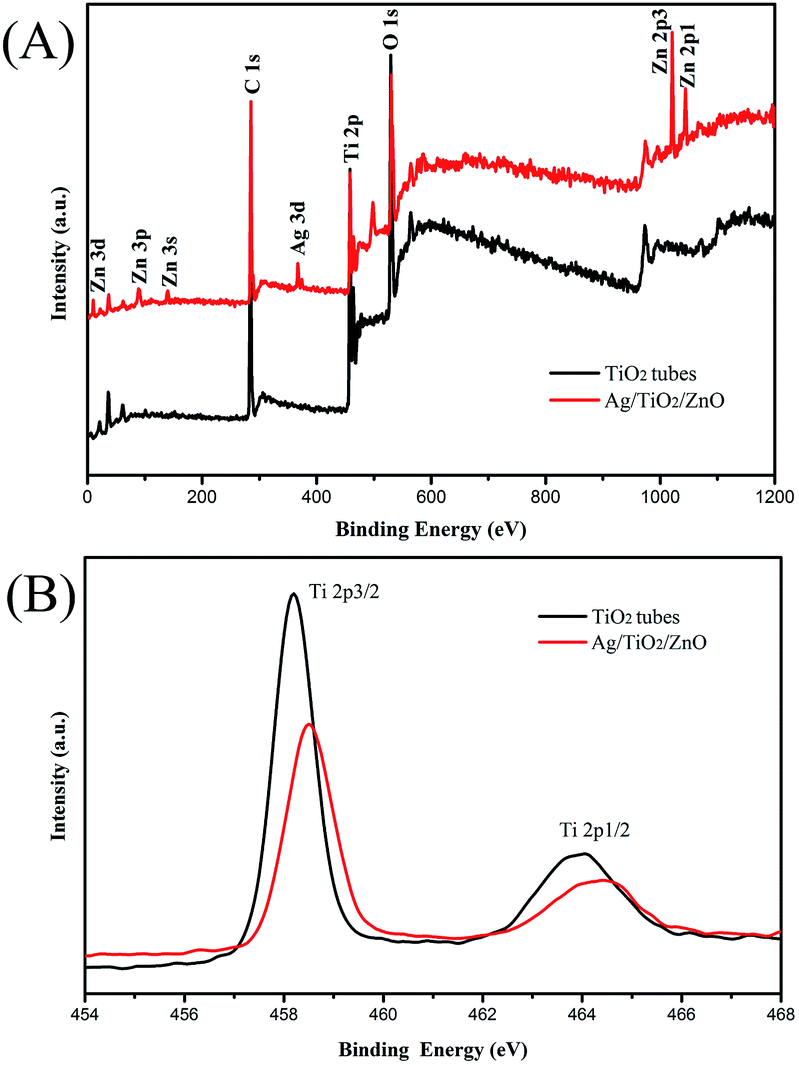 | ||
| Fig. 4 The XPS spectra of the TiO2 and ATZ nanotubes: (A) full spectrum of the sample and (B) the Ti 2p spectrum. | ||
The photocatalytic efficiency of the catalyst is highly related to the light absorption including the amount, wavelength range, and absorption peak position. To prove the light absorption properties of the samples at different wavelengths, the UV-vis diffuse reflectance spectra (DRS) were recorded. From the DRS results (Fig. 5A), the reflection spectra of the samples are shown. Compared with the pure TiO2 nanotubes, the TZ2 sample has a lower reflectivity in the range of 300–600 nm, particularly in the ultra-violet light region. With the addition of Zn2+, the energy absorbance for UV and visible light was increased. Therefore, the results indicate that the hollow tubes of TiO2/ZnO can absorb light in the ultra-violet region and the light could be utilized more efficiently for photocatalytic purposes. Moreover, as mentioned in the XRD results, the ZnTiO3 crystallites were formed in the hybrids and thus, this may induce defects in the crystal lattice structure of TiO2 or ZnO, leading to an increase in the absorption amount. Compared with TZ2, the absorption of TZ3 was slightly lower, which may due to such a large amount of ZnO doping in the ZnTiO3 crystallites that the overall structure was unstable. The ATZ nanotubes showed the lowest reflectivity in the ultra-violet and visible light region. The phenomenon of reflectance dramatic decline may due to the unique hollow structure, by the photoreduction method the AgNps were attach to the surface and inner wall of the TZ2 nanotubes form Ag–semiconductor–Ag sandwich structure, which means the receiving area of the light is increased and could be accepted many times that under the same intensity of light, all of this make the ATZ tubes could absorbance more energy.
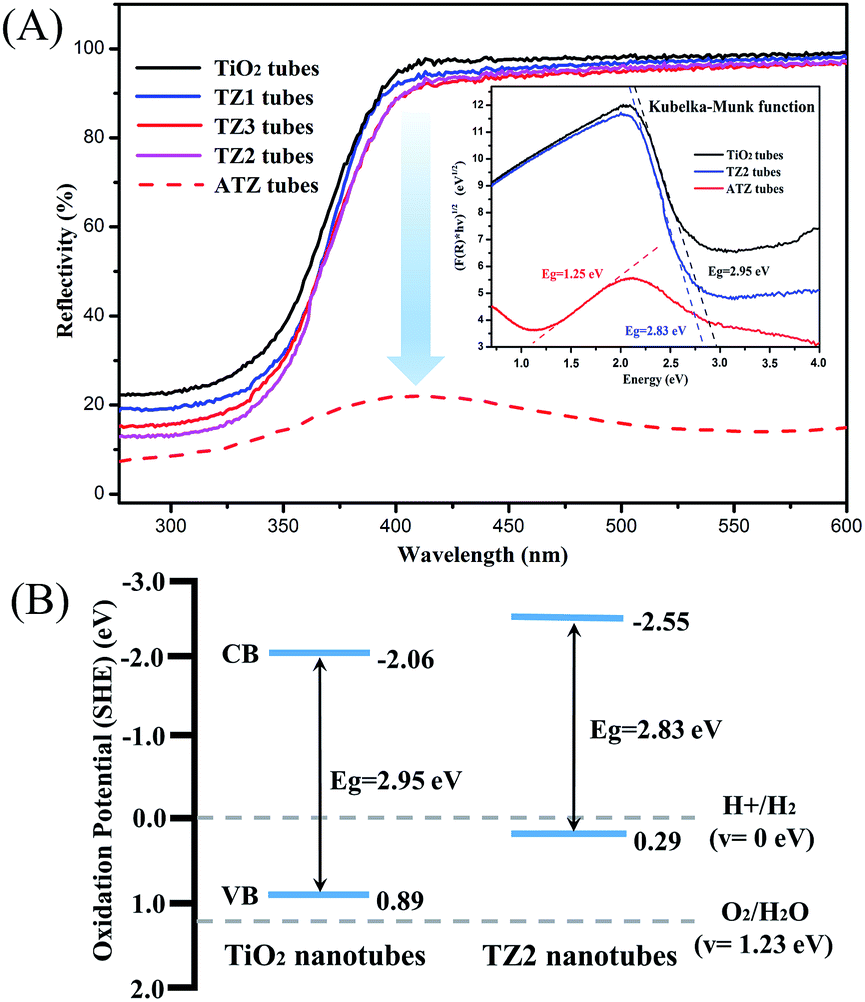 | ||
| Fig. 5 The UV-vis DRS of the samples and the deduced band gap energy (inset) (A). The calculated band edge (VB, CB) positions of the TiO2 and TZ2 nanotubes (B). | ||
The band gap energy of the TiO2, TZ2 and ATZ nanotubes was obtained from DRS spectra by applying the Kubelka–Munk function as shown in Fig. 5A (inset). The band gap energies were 2.95 eV, 2.83 eV and 1.25 eV. It was realized that the modification of the materials through doping or controlling the morphology on the nanoscale will help tune the band energy of the materials, which may cause a change in the electronic transportation by shifting the band edge positions and thereby lead to the change in their band gap energies.40
From the band gap energies obtained, the locations of the conduction band (CB) and valence band (VB) in the samples were calculated using the empirical equation: ECB = X − Ee − Eg/2, where ECB is the CB edge potential and X is the electronegativity of the semiconductor, which is the arithmetic mean of the electronegativity of the constituent atoms and the first ionization energy. Ee is the energy of the free electrons on the hydrogen scale (approximately 4.5 eV), and Eg is the band gap energy of the semiconductor. Similarly, EVB can be calculated from the equation: EVB = ECB + Eg.41 The determined band edge positions of the TiO2 and TZ2 nanotubes and their comparison with the potential of the standard hydrogen electrode (SHE) are depicted in Fig. 6B.
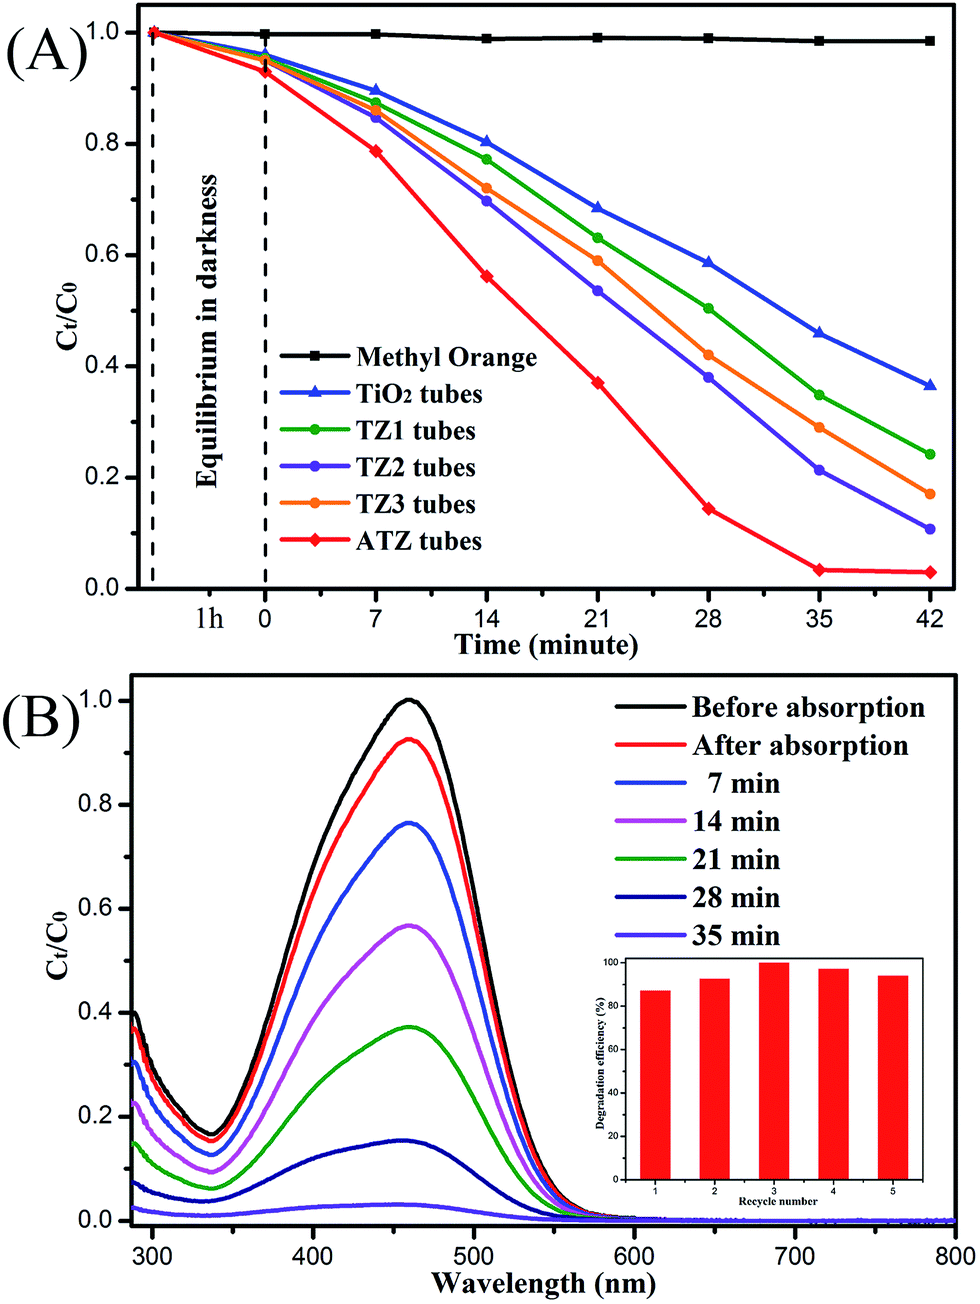 | ||
| Fig. 6 The photocatalytic degradation rate of MO using the as-prepared samples (A). The UV-vis absorption spectra recorded for the photocatalytic degradation of MO in the presence of the ATZ nanotubes (B) and the repeatability tests studied using the ATZ nanotubes for five cycles (inset). | ||
Photocatalytic activities of the samples
To investigate their photocatalytic activity, the as-prepared samples were used for the degradation of an MO solution under UV irradiation (Fig. 7). The photocatalytic degradation efficiency was evaluated by C0/Ct (where C0 and Ct are the initial concentration and the concentration of MO at time t, respectively). Fig. 6A shows the concentration change curves for MO in the photodegradation process after being irradiated with UV light for 42 min. The photocatalytic degradation efficiency of the ATZ sample was 96.7%, which was slightly better than that found for TZ2 (89.2%) and much higher than that of the TZ1 (71.8%), TZ3 (79.1%) and pure TiO2 nanotubes (56.6%). The degradation rate of MO without the catalyst was only 0.95%. Compared with the pure TiO2 tubes, the ATZ tubes showed an amazing improvement of the degradation effect, which was consistent with the UV-vis DRS results. Fig. 6B shows the UV-vis absorption spectra of MO in the presence of the ATZ nanotubes. In addition, we investigated the photocatalytic stability of the ATZ heterostructure. The results indicate that the hybrids exhibit good stability after being reused for five cycles (Fig. 6B inset).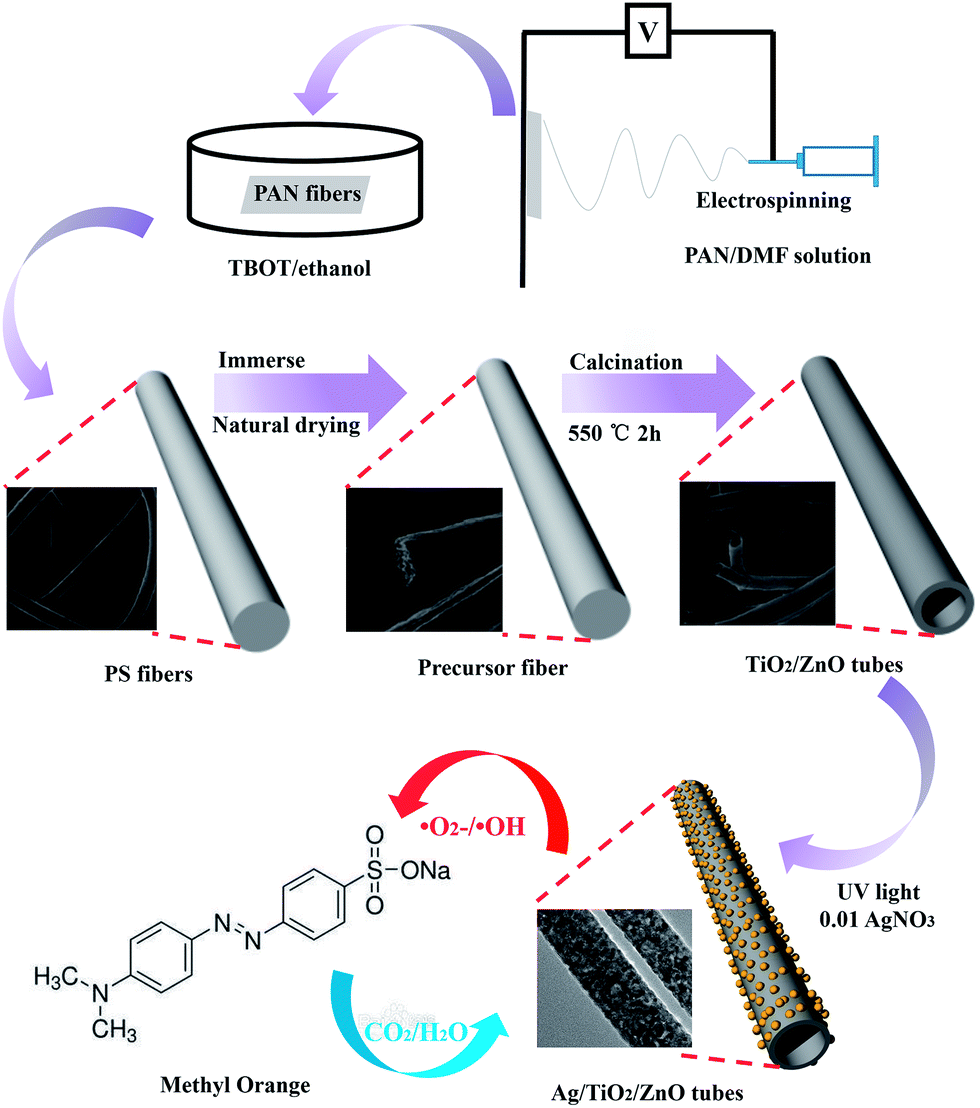 | ||
| Fig. 7 An illustration of the formation mechanism of the Ag/TiO2/ZnO nanotubes. | ||
Synthesis of the Ag/TiO2/ZnO nanotubes and mechanism of the enhanced photocatalytic activity
When the PAN/DMF nanofibers are soaked in the TBOT ethanol solution, the DMF and precursor solution dissolve each other and allow the TBOT to permeate into the surface of the PAN nanofibers. Upon increasing the temperature in the vacuum calcination process, the PAN nanofibers gradually form into PAN carbide fibers to provide a template for nanoseed growth and benefit the subsequent calcination step. Under the conditions of aerobic calcination, the surface concentration of TBOT increases leading to the TiO2 nanoseeds to be more likely to form nanoparticles. These nanoparticles grown on the surface of the PAN carbide fibers form a tubular structure and after the carbide fibers are completely decomposed, the hollow TiO2 nanotubes are obtained. The ZnO and TiO2 nanotubes had different morphology, because the titanium element was existing in the form of TBOT molecules, which could form a Ti–O–Ti stable structure on the surface prevent titanium from reuniting. Therefore, smooth hollow TiO2 nanotubes could be obtained after calcination. The zinc element was in the form of Zn2+ in the immersion solution and during the heating process, Zn2+ was reunited to form the nucleus; the nanoparticles formed on the surface of the sacrificial template, eventually forming the porous tube structure. The formation mechanism of the TiO2/ZnO nanotubes was similar to the process of TiO2 with the difference being that the Zn ions combined with TiO2 to form a semiconductor–semiconductor (S–S) heterojunction.Photoluminescence (PL) spectroscopy is related to the separation and recombination of photogenerated electrons and holes. As shown in Fig. 8, the PL spectra of the TiO2 nanotubes have a strong emission peak at 390 nm at an excitation wavelength of 370 nm. However, the PL intensity of the ATZ hybrid was significantly decreased with the addition of ZnO and Ag. The most important reason for this phenomenon is the defects in the crystal structure of TiO2, which act as traps for capturing the photo-excited electrons and thus, inhibit the recombination of the e/h+ pairs.40
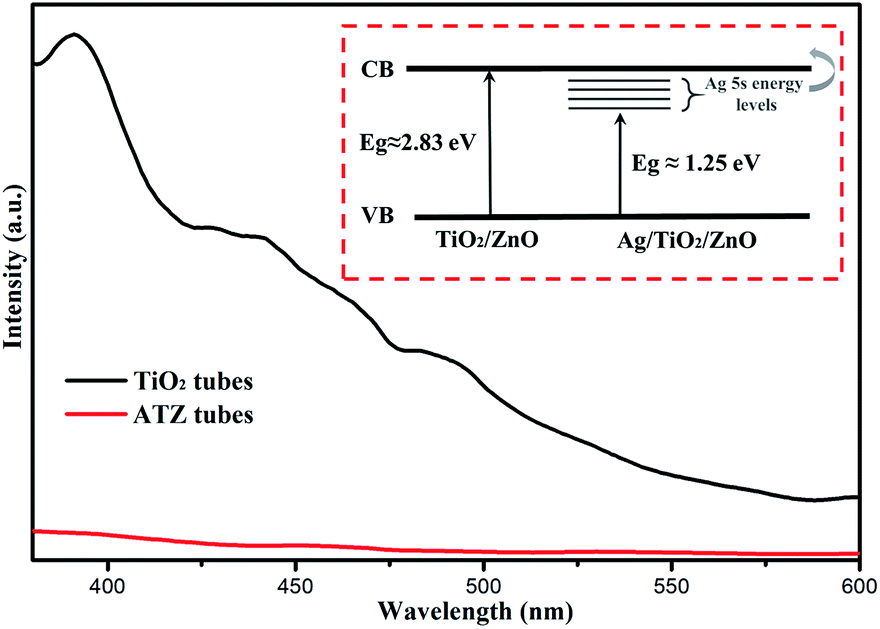 | ||
| Fig. 8 The photoluminescence spectra of the TiO2 and AZT nanotubes, and the concept of band gap engineering in the AgNps modified TZ2 nanotubes (inset). | ||
It was found that the band gap of TZ2 dramatically declined after being modified by the AgNps (Fig. 5). The observed reduction in the band gap may be due to charge transfer from the electron donor levels formed by the 5s orbital of the Ag ions to the conduction band of the TZ2 host, which is schematically represented in Fig. 8 (inset). It is known that the band gap of TZ2 is formed by the orbital overlap between TiO2 and ZnO. In the AgNps modified TZ2, the Ag 5s level lies below the conduction band of the TZ2 host. This newly formed Ag 5s energy level effectively interacts with the valence O 2p orbital and leads to a charge-transfer transition from the Ag energy levels to the conduction band of TZ2.42 Therefore, the band gap was found to be reduced in Ag modified TZ2 compared to pure TZ2, which is consistent with the XPS analysis.
Through the photoreduction method, AgNps were successfully modified on the surface of the nanotubes, and the surface and inner walls of the hollow TZ2 nanotubes formed the Ag–semiconductor–Ag sandwich structure, which could provide a larger specific surface area and more active sites. Fig. 9 shows a schematic of the photocatalytic mechanism. When the ATZ tubes are illuminated by UV light with photon energy, the electrons (e−) in the valence band (VB) can be excited to the conduction band (CB) with the simultaneous generation of the same amount of holes (h+) left behind. The deflexed energy band in the space charge region facilitates electron transfer from the CB of ZnO to the CB of TiO2, which increases the lifetime of the photogenerated pairs. The electrons accumulated on the CB of TiO2 and ZnO can be transferred to O2 adsorbed on the surface to form oxygen radicals such as ˙O2− and ˙OH. Moreover, the photoinduction holes on the VB can induce the surface bound H2O to produce the hydroxyl radical (˙OH), which is a strong oxidant that can effectively degrade organic chemicals. The role of the AgNps and ZnO in the ATZ heterostructure was to increase the electron transfer rate and suppress charge recombination by transferring the photogenerated electron/hole.28 Moreover, the ATZ nanotubes could absorb more ultraviolet radiation than pure TiO2. All of these factors lead to the catalytic activity of the ATZ heterostructure being significantly enhanced.33
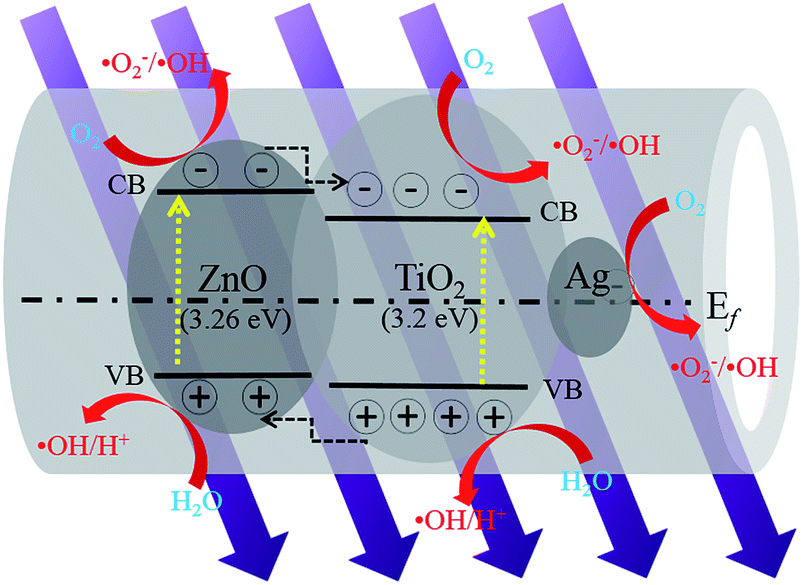 | ||
| Fig. 9 A schematic of the electron–hole separation and energy band matching of the ATZ nanotubes under UV illumination. | ||
Conclusions
In summary, hollow TiO2 and TiO2/ZnO nanotubes were obtained using electrospinning combined with an impregnation calcination method. Using a photoreduction method, AgNps were successfully decorated on the surface of the nanotubes. The synthesis mechanism of the hollow TiO2 nanotubes and the ATZ hybrids, which enhanced their photocatalytic activity, was also proposed. Moreover, the hollow ATZ tubes were synthesized using a simple and environmentally friendly method and may have good potential applications in solving environmental problems and provide a simple and efficient method for manufacturing hollow nanotubes.Conflicts of interest
There are no conflicts to declare.Acknowledgements
This study was financially supported by the Jilin province science and technology development projects (20150411005XH).References
- A. Testino, I. R. Bellobono, V. Buscaglia, C. Canevali, M. D'Arienzo, S. Polizzi, R. Scotti and F. Morazzoni, J. Am. Chem. Soc., 2007, 129, 3564 CrossRef CAS PubMed.
- K. Katsumata, C. E. J. Cordonier, T. Shichi and A. Fujishima, J. Am. Chem. Soc., 2009, 131, 3856 CrossRef CAS PubMed.
- F. Dong, S. Guo, H. Wang, X. Li and Z. Wu, J. Phys. Chem. C, 2011, 115, 13285 CAS.
- C. Santato, M. Ulmann and J. Augustynski, J. Phys. Chem. B, 2001, 105, 936 CrossRef CAS.
- F. L. Zhang, Z. Q. Cheng, L. Y. Cui, T. T. Duan, A. Anan, C. F. Zhang and L. J. Kang, RSC Adv., 2016, 6, 1844 RSC.
- H. Y. Zhu, R. Jiang, Y. Q. Fu, R. R. Li, J. Yao and S. T. Jiang, Appl. Surf. Sci., 2016, 369, 1 CrossRef CAS.
- T. P. Xie, L. J. Xu, C. L. Liu and Y. Wang, Appl. Surf. Sci., 2013, 273, 684 CrossRef CAS.
- S. Ye, D. Zhang, H. Liu and J. Zhou, J. Appl. Polym. Sci., 2011, 121, 1757 CrossRef CAS.
- M. Kanjwal, F. Sheikh, N. Barakat and I. Chronakis, Appl. Surf. Sci., 2011, 257, 7975 CrossRef CAS.
- J. Pena, M. Vallet-Regi and J. Román, J. Biomed. Mater. Res., 1997, 35, 129 CrossRef CAS PubMed.
- Y. M. Liang, N. Guo, L. L. Li, R. Q. Li, G. J. Ji and S. C. Gan, Appl. Surf. Sci., 2015, 332, 32 CrossRef CAS.
- J. Li, Z. Liu and Z. Zhu, RSC Adv., 2014, 4, 51302 RSC.
- L. Tan, M. Kumar, W. An and H. Gao, ACS Appl. Mater. Interfaces, 2010, 2, 498 CAS.
- H. Fei, Y. Liu, Y. Li, P. Sun, Z. Yuan, B. Li, D. Ding and T. Chen, Microporous Mesoporous Mater., 2007, 102, 318 CrossRef CAS.
- J. Park, S. Kim and A. Bard, Nano Lett., 2006, 6, 24 CrossRef CAS PubMed.
- M. Wang, J. Ioccozia, L. Sun, C. Lin and Z. Lin, Energy Environ. Sci., 2014, 7, 2182 CAS.
- J. Goldberger, D. Sirbuly, M. Law and P. Yang, J. Phys. Chem. B, 2005, 109, 9 CrossRef CAS PubMed.
- L. Xu, D. Gao, J. Song, L. Shen, W. Chen, Y. Chen and S. Zhang, New J. Chem., 2015, 39, 5553 RSC.
- H. Yang, G. Liu, S. Qiao, C. Sun, Y. Jin, S. Smith and G. Lu, J. Am. Chem. Soc., 2009, 131, 4078 CrossRef CAS PubMed.
- S. Das and W. Daud, RSC Adv., 2014, 4, 20856 RSC.
- W. Ong, L. Tan, S. Chai, S. Yong and A. Mohamed, Nanoscale, 2014, 6, 1946 RSC.
- P. Kar, S. Sardar, S. Ghosh, M. Parida, B. Liu, O. Mohammed, P. Lemmens and S. Pal, J. Mater. Chem. C, 2015, 3, 8200 RSC.
- A. Kar and A. Patra, J. Mater. Chem. C, 2014, 2, 6706 RSC.
- Y. Liu, J. Goebl and Y. Yin, Chem. Soc. Rev., 2013, 42, 2610 RSC.
- M. Zhang, C. Shao, J. Mu, Z. Zhang, Z. Guo, P. Zhang and Y. Liu, CrystEngComm, 2012, 14, 605 RSC.
- L. Zhang, D. Jing, X. She, H. Liu, D. Yang, Y. Lu, J. Li, Z. Zheng and L. Guo, J. Mater. Chem. A, 2014, 2, 2071 CAS.
- J. Tian, Y. Leng, Z. Zhao, Y. Xia, Y. Sang, P. Hao, J. Zhan, M. Li and H. Liu, Nano Energy, 2015, 11, 419 CrossRef CAS.
- S. Zhao, Z. Cheng, L. Kang, Y. Zhang and X. Zhao, Mater. Lett., 2016, 182, 305 CrossRef CAS.
- F. Lu, W. Cai and Y. Zhang, Adv. Funct. Mater., 2008, 18, 1047 CrossRef CAS.
- S. Malato, P. Fernández-Ibáñez, M. Maldonado, J. Blanco and W. Gernjak, Catal. Today, 2009, 147, 1 CrossRef CAS.
- S. Kumar and K. Rao, Appl. Surf. Sci., 2015, 355, 939 CrossRef.
- G. Colón, M. Hidalgo, J. Navio, E. Melián, O. Díaz and J. Rodríguez, Appl. Catal., B, 2008, 83, 30 CrossRef.
- Z. Cheng, S. Zhao, Z. Han, Y. Zhang, X. Zhao and L. Kang, CrystEngComm, 2016, 18, 8756 RSC.
- F. Falyouni, L. Benmamas, C. Thiandoume, J. Barjon, A. Lusson, P. Galtier and V. Sallet, J. Vac. Sci. Technol., B: Microelectron. Nanometer Struct.--Process., Meas., Phenom., 2009, 27, 1662 CrossRef CAS.
- D. Sornalatha and P. Murugakoothan, Mater. Lett., 2014, 124, 219 CrossRef.
- C. Grimes, J. Mater. Chem., 2007, 17, 1451 RSC.
- I. Kim, A. Rothschild, D. Yang and H. Tuller, Sens. Actuators, B, 2008, 130, 9 CrossRef CAS.
- S. Ramaseshan and S. Ramkakrishna, J. Am. Ceram. Soc., 2007, 90, 1836 CrossRef.
- S. Mohan, B. Sivakumar, R. V. Kulangara and B. Subramanian, ChemistrySelect, 2016, 1, 6961 CrossRef CAS.
- S. Bharathkumar, M. Sakar and S. Balakumar, J. Phys. Chem. C, 2016, 120, 18811 CAS.
- S. Mohan, B. Subramanian, I. Bhaumik, P. K. Gupta and S. N. Jaisankar, RSC Adv., 2014, 4, 16871 RSC.
- S. Mohan, B. Subramanian and G. Sarveswaran, J. Mater. Chem. C, 2014, 2, 6835 RSC.
Footnote |
| † Zhiqiang Cheng and Shengzhe Zhao equally contributed to this work. |
| This journal is © The Royal Society of Chemistry 2017 |