DOI:
10.1039/C7RA09419A
(Paper)
RSC Adv., 2017,
7, 54441-54452
Copolymerization modification of poly(vinyltriethoxysilane) membranes for ethanol recovery by pervaporation
Received
25th August 2017
, Accepted 21st November 2017
First published on 27th November 2017
Abstract
In this study, a copolymerization modification method is used to modify the rigid structure of a high-flux poly(vinyltriethoxysilane) (PVTES) membrane, which was prepared from VTES monomers in our previous work, to further enhance its separation factor. A value of R/Si, which could characterize the density of organic groups and the chain flexibility in membrane materials, is introduced here to guide the selection of modification chemicals. Modifiers with different polymerization degree but the same flexible chain unit (DMDES, HSO and PDMS) are chosen to be copolymerized with PVTES. Analysis results show that the PVTES-HSO membrane possesses lower thickness, higher amount of hydrophobic groups, and an inner structure with greater chain flexibility and lower crystallinity, leading to the best pervaporation (PV) performance among these modified membranes, which is much better than the original PVTES membrane. Furthermore, PVTES-HSO membranes with different R/Si values are prepared to optimize their PV performance. And the optimal PVTES-HSO membrane (R/Si = 1.4) shows the best performance with the separation factor of 6.6 and flux up to 8160 g m−2 h−1 when separating 9 wt% ethanol aqueous solution at 35 °C.
Introduction
In recent years, fuel prepared from renewable bioethanol has been promoted as an environmentally benign source of energy for the next generation. Pervaporation (PV), as an environmentally-friendly and energy-saving separation technology, is a potential process for in situ recovery of bioethanol to reduce the inhibitory effect of high alcohol concentration and thereafter to enhance the fermentation efficiency.1–4 The key element of this integrated process is the pervaporation membrane with high flux and separation factor. In recent years, a great deal of pervaporation membrane materials have been developed, among which silicone-based polymers are widely employed in the separation of organics from aqueous solutions.5 And for the separation of dilute ethanol aqueous solution, polydimethylsiloxane (PDMS) membrane is the most well-studied representative silicone-based polymeric membrane.6–19 Generally, the reported separation factors of polymer-supported PDMS membranes for the ethanol/water system have ranged from 4.4 to 10.8 with an average of about 7–8.20 However, due to its large molecular weight, the thickness of PDMS membrane is usually large, which causes low flux. Beaumelle et al.21 have indicated that the total flux of unmodified PDMS membranes only ranges from 1 to 1000 g m−2 h−1 for the ethanol/water separation by PV. This low flux of PDMS membrane significantly limits its industrial application. Therefore, it is necessary to develop a new thin membrane with a comparable separation factor for ethanol recovery.
Currently, membrane fabrication methods like interfacial polymerization, plasma polymerization, atom transfer radical polymerization (ATRP), dip-coating and also other methods have been applied to the preparation of ultrathin pervaporation membranes.22–25 It can be concluded that the dramatic decrease of selective layer thickness has been achieved mostly because small molecules are used instead of polymers, like PDMS, as film forming monomers in most of these methods. Therefore, in our previous study, Zhang et al.26 have reported the preparation of thin high-flux poly(vinyltriethoxysilane) (PVTES) membranes with vinyltriethoxysilane (VTES) monomers for ethanol recovery, which possessed a flux over 10![[thin space (1/6-em)]](https://www.rsc.org/images/entities/char_2009.gif) 000 g m−2 h−1 and a separation factor of 5 with the active layer thickness of ∼20 nm. Although the flux of PVTES membrane achieves a breakthrough, the separation factor is a little low due to its rigid inner structure, which may easily lead to some free volume cavity and structural defects in membrane structure. So the PVTES membrane performance is expected to be improved through modification by lowering its rigidity.
000 g m−2 h−1 and a separation factor of 5 with the active layer thickness of ∼20 nm. Although the flux of PVTES membrane achieves a breakthrough, the separation factor is a little low due to its rigid inner structure, which may easily lead to some free volume cavity and structural defects in membrane structure. So the PVTES membrane performance is expected to be improved through modification by lowering its rigidity.
Copolymerization modification is a commonly used method to adjust membrane inner structure via copolymerization of additives and the original membrane materials to change the functional groups and chain structures, which definitely affects the PV performance of membranes. Poly(1-trimethylsilyl-1-propyne) (PTMSP) is a typical silicon-based membrane with rigid inner structure, which leads to its relatively low selectivity for ethanol/water separation and low stability in the PV process.27 Therefore, Nagase et al.27 once modified PTMSP with the more flexible PDMS by copolymerization, experimental results showed that the selectivity depended on the PDMS content of the copolymer, and the separation factor and permeation rate assumed the maximum values at 12 mol% PDMS content. At that point, the separation factor and permeation rate were 28.3 and 2.45 × 10⁻³ g m m−2 h−1, respectively, compared with 11.2 and 1.15 × 10⁻³ g m m−2 h−1 for pure PTMSP membrane. Such a high permselectivity for ethanol might be due to a delicate alteration of membrane structure, which was induced by the introduction of a short flexible PDMS side chain into a rigid PTMSP backbone. However, the experimental result also showed that excessively high content of PDMS would lead to a decrease in the separation factor, because the large amount of flexible PDMS chain may easily over swelled in PV process. So a proper flexibility of membrane inner structure is needed to obtain a higher separation factor. Thus, for our research, the PVTES membrane with rigid backbone needs to be modified by introducing a proper amount of flexible segments to adjust membrane inner structure and then to enhance the separation factor.
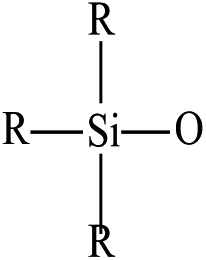
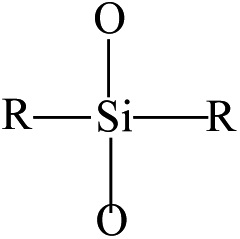
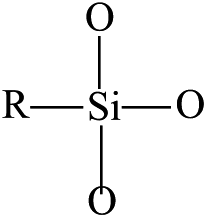
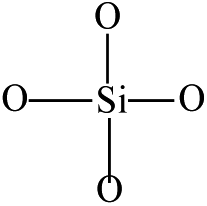
In order to characterize the flexibility of modified copolymers, we introduce a value as R/Si.28 It is defined as the average number of organic groups (R) attached directly to one silicon atom for the organic silicon resin. With the value R/Si increasing, the density of organic groups and segmental mobility of polymers increase. Generally, silicone-based polymer consists of four elementary units, and their R/Si values are shown in Table 1. For the PVTES membrane only consisting of T units (R/Si = 1), which shows higher rigidity, its flexibility can be enhanced by introducing appropriate amount of D units to adjust R/Si value between 1 and 2. Dimethyldiethoxysilane (DMDES) and its polymers with –CH3 groups are the most commonly used hydrophobic silicon resins consisting of D units. They have a good affinity with ethanol, and –CH3 can make a better flexibility for the material because of its smaller steric hindrance than the other organic groups.
Table 1 Elementary units of silicone-based polymers
| Structural formula |
Functionality |
R/Si |
Mark |
Flexibility |
 |
1 |
3 |
M |
— |
 |
2 |
2 |
D |
High |
 |
3 |
1 |
T |
Medium |
 |
4 |
0 |
Q |
Low |
So, in this work, the modifiers with different polymerization degree but the same flexible chain unit, which are DMDES, the oligomer of hydroxy silicone oil (HSO) and PDMS, are employed to be copolymerized with PVTES via hydrolytic condensation reaction, marked as PVTES-X, to obtain ultrathin membranes with higher separation factor. The morphology, membrane thickness, surface hydrophobic property, inner crystallization property and thermal stability of PVTES-X and PVTES membranes are investigated and compared by means of scanning electron microscope (SEM), atomic force microscope (AFM), contact angle (CA) measurement, Fourier transform infrared (FTIR), X-ray diffraction (XRD) and thermogravimetric (TGA) analysis. Furthermore, the pervaporation performances of the PVTES-X and PVTES membranes for separating dilute ethanol aqueous solution are also compared to select the best modifier. And then the chosen PVTES-HSO membranes with different R/Si values are prepared to further optimize their PV performance. Finally effects of operation conditions (feed temperature and feed concentration) on the PV performance of the optimal PVTES-HSO membrane are also systematically investigated.
Experimental
Materials
Poly(vinylidene fluoride) (PVDF) microfiltration membranes with an average pore size of 0.22 μm and thickness of 0.1 mm are purchased from Beihua Liming Co., Ltd. (Beijing, China). Dimethyldiethoxysilane (DMDES) of analytical grade is obtained from Beijing Hvsco Technology Co., Ltd. (Beijing, China). Hydroxyl silicon oil (HSO, polymerization degree n = 8) is purchased from Beijing Dingye Co., Ltd. (Beijing, China). Vinyltriethoxysilane (VTES, density of 0.904 g ml−1) of analytical grade is obtained from Tianjin Chemical Reagent Institute (Tianjin, China). Polydimethylsiloxane (PDMS, polymerization degree n ≈ 800), ethanol (purity > 99.7%) and n-heptane of analytical grade are supplied by Beijing Chemical Co., Ltd. Dibutyltin dilaurate (DBTL) of chemical grade is purchased from Fuchen Chemical Reagent Factory (Tianjin, China). All the chemicals are used without further purification. Deionized water is used in this study.
Membrane preparation
The procedure for the preparation of pure PVTES and PVTES-X composite membranes is described as follows. In order to prevent coating solution from penetrating micro-pores in PVDF membrane, PVDF porous membrane as support layer is first wetted with ethanol, then immersed in water. After about 10 minutes, the PVDF is placed on a clean glass plate and excess water on the surface is wiped off quickly with a filter paper. Meanwhile, the coating solution is prepared to form the active layer of composite membranes. First, VTES and the solvent n-heptane are mixed up with the ratio 5:10 (w/w) under stirring to form a homogenous solution at room temperature. The modifier (DMDES, HSO or PDMS) is then added into the above solution with a given R/Si to form organic silicon resin (no modifier is added into the pure PVTES membrane). Finally, the catalyst, dibutyltin dilaurate, is put in with a weight ratio of 0.04 to VTES. After degassing, the solution is uniformly poured over the pre-treated PVDF support. The solvent evaporates at room temperature and the resultant membrane is then cured in a vacuum drying oven at the desired temperature to complete crosslinking.
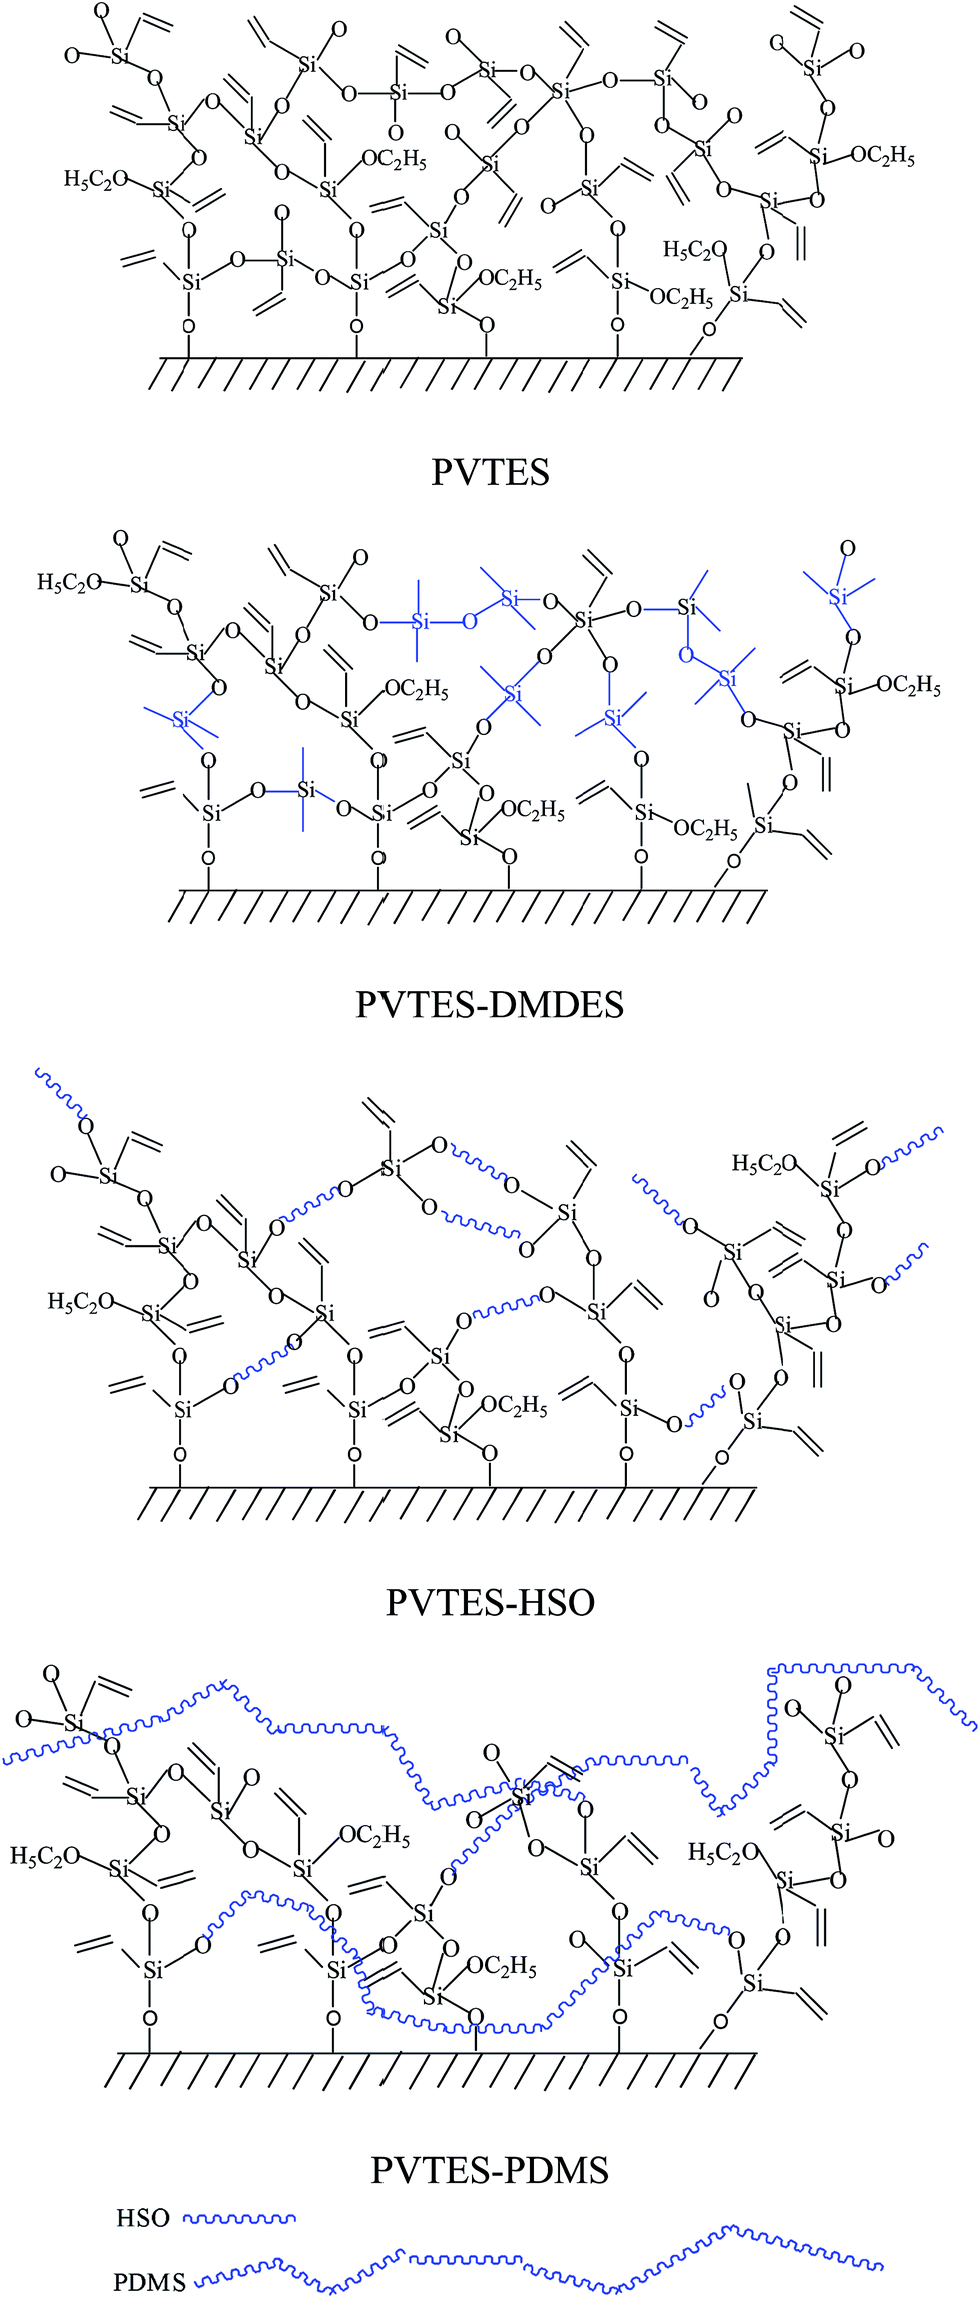
During the membrane formation process, the silanization of organic silicone resins forms a polymer with Si–O–Si bonds.29,30 The hydrolysis and condensation reaction occurs between the Si–OCH2CH3 groups existing in VTES, DMDES, HSO and PDMS, and the same reaction also occurs between Si–OH on the PVDF surface and the Si–OCH2CH3 groups, which enhances the interaction of the selective layer and support layer. The detailed reaction process has been reported in our previous research.26 And the possible structures of these four resultant membranes are illustrated in Fig. 1. Further characterization by FTIR and XRD spectrum will be discussed in the Results and discussions section.
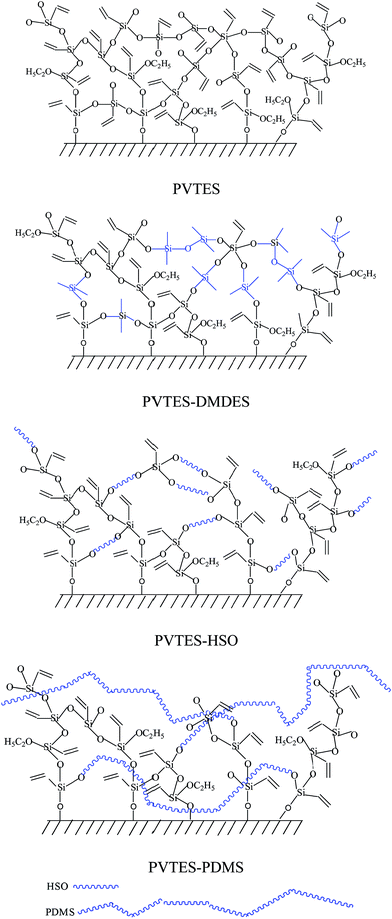 |
| | Fig. 1 The possible structures of PVTES and PVTES-X membranes. | |
Membrane characterization
Scanning electron microscope (SEM). The surface and cross-sectional morphological studies are performed on an FEI Quanta 200 SEM at a voltage of 20 kV. Membrane thickness can also be measured by SEM.
Atomic force microscope (AFM). The AFM used in this study is a CSPM 4000 provided by Benyuan Co., Ltd. All images are obtained at ambient conditions.
Contact angle (CA) measurement. The contact angle is measured by a contact angle tester (HARKE-SPCAX1, China) at room temperature. A 2 μL portion of pure water is dropped onto the membrane surface at different locations. The value of contact angle is mean of triplicate measurements.
Fourier transform infrared (FTIR). FTIR spectra are recorded in the 500–4000 cm−1 range using a JIR-7000 spectrometer (JEOL) at 4 cm−1 resolution.
X-ray diffraction (XRD). Crystal area and amorphous area of the composite membranes are confirmed by XRD. The physical structure of the membranes is studied at 25 °C by X-ray powder diffraction (PANalytical B.V., Netherlands) using Cu Kα radiation with a scanning speed of 8° min−1 within a range of 5–80°. Same material amount for each membrane is used for the XRD measurement.
Thermogravimetric (TGA) analysis. The thermal stability is examined by a STA 449C Simultaneous Thermal Analyzer (Netzsch Corporation, Germany) in the temperature range from 40 °C to 800 °C at a heating rate of 5 °C min−1 with a nitrogen flow of 25 mL min−1.
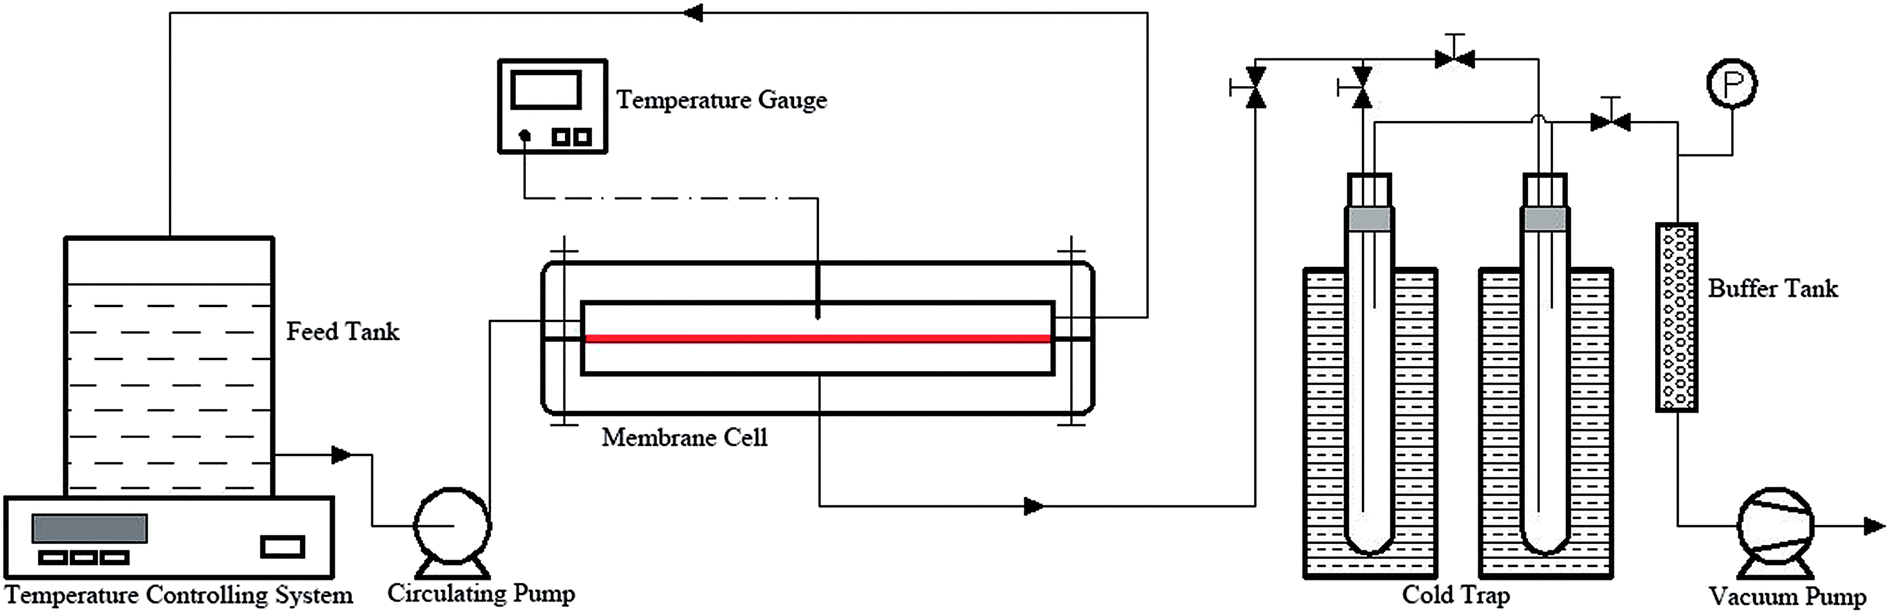
Pervaporation measurement. Pervaporation performance measurements of membranes are carried out on the apparatus, schematically shown in Fig. 2. The membranes are mounted in a stainless steel membrane module with an effective membrane area of 55.4 cm2 and sealed with Viton o-rings. The feed is circulated from the feed tank to membrane module with a YZ1515X peristaltic pump. The temperature of the feed tank is controlled with a HH-4 thermostatic water bath. A 2XZ-2 vacuum pump is used to maintain the downstream pressure of the permeate side at 30 mmHg. The permeate is condensed in a liquid nitrogen trap. Before the experiment, the system is performed for 2 h to reach a steady state, after that, the permeate is collected every 1 h. The ethanol concentration of feed and permeate are analysed by gas chromatography (Agilent 7890A) using a DB-FFAP capillary column and a FID detector. Weight of permeate is determined by an electronic balance (OHAUS AR2130, USA). All values of fluxes and separation factors are means of triplicate measurements.
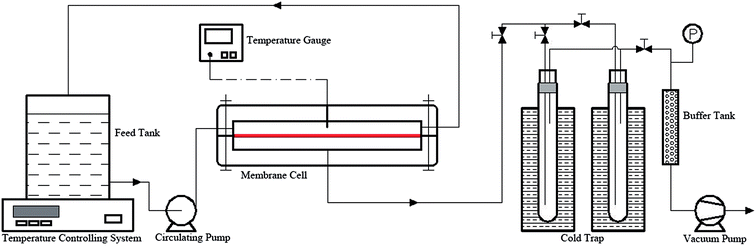 |
| | Fig. 2 Schematic diagram of the pervaporation system. | |
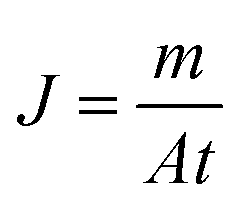
The permeation flux (J) is calculated using the following equation:
| |
 | (1) |
where
m denotes the weight of permeate (g),
A is membrane area (m
2) and
t is the permeation time (h).
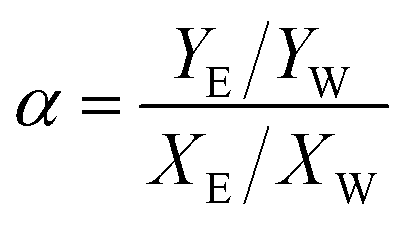
The separation factor (α), which reflects the membrane separation performance, is defined by the equation below:
| |
 | (2) |
where
XW,
XE and
YW,
YE are the weight fractions of water and ethanol in the feed and permeate, respectively.
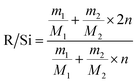
Measurement of the density of organic groups. Borrowed from the material science,31 the value of R/Si is widely used to illustrate the density of organic groups for the organic silicon resin. It is calculated as the following equation.| |
 | (3) |
where m1 and m2 are the weight of VTES and the modifier in the coating solution (g), respectively, M1 and M2 refer to the molar mass of VTES and the modifier (g mol−1), separately, n is the polymerization degree of the modifier.
Results and discussions
Characterization of PVTES and PVTES-X membranes
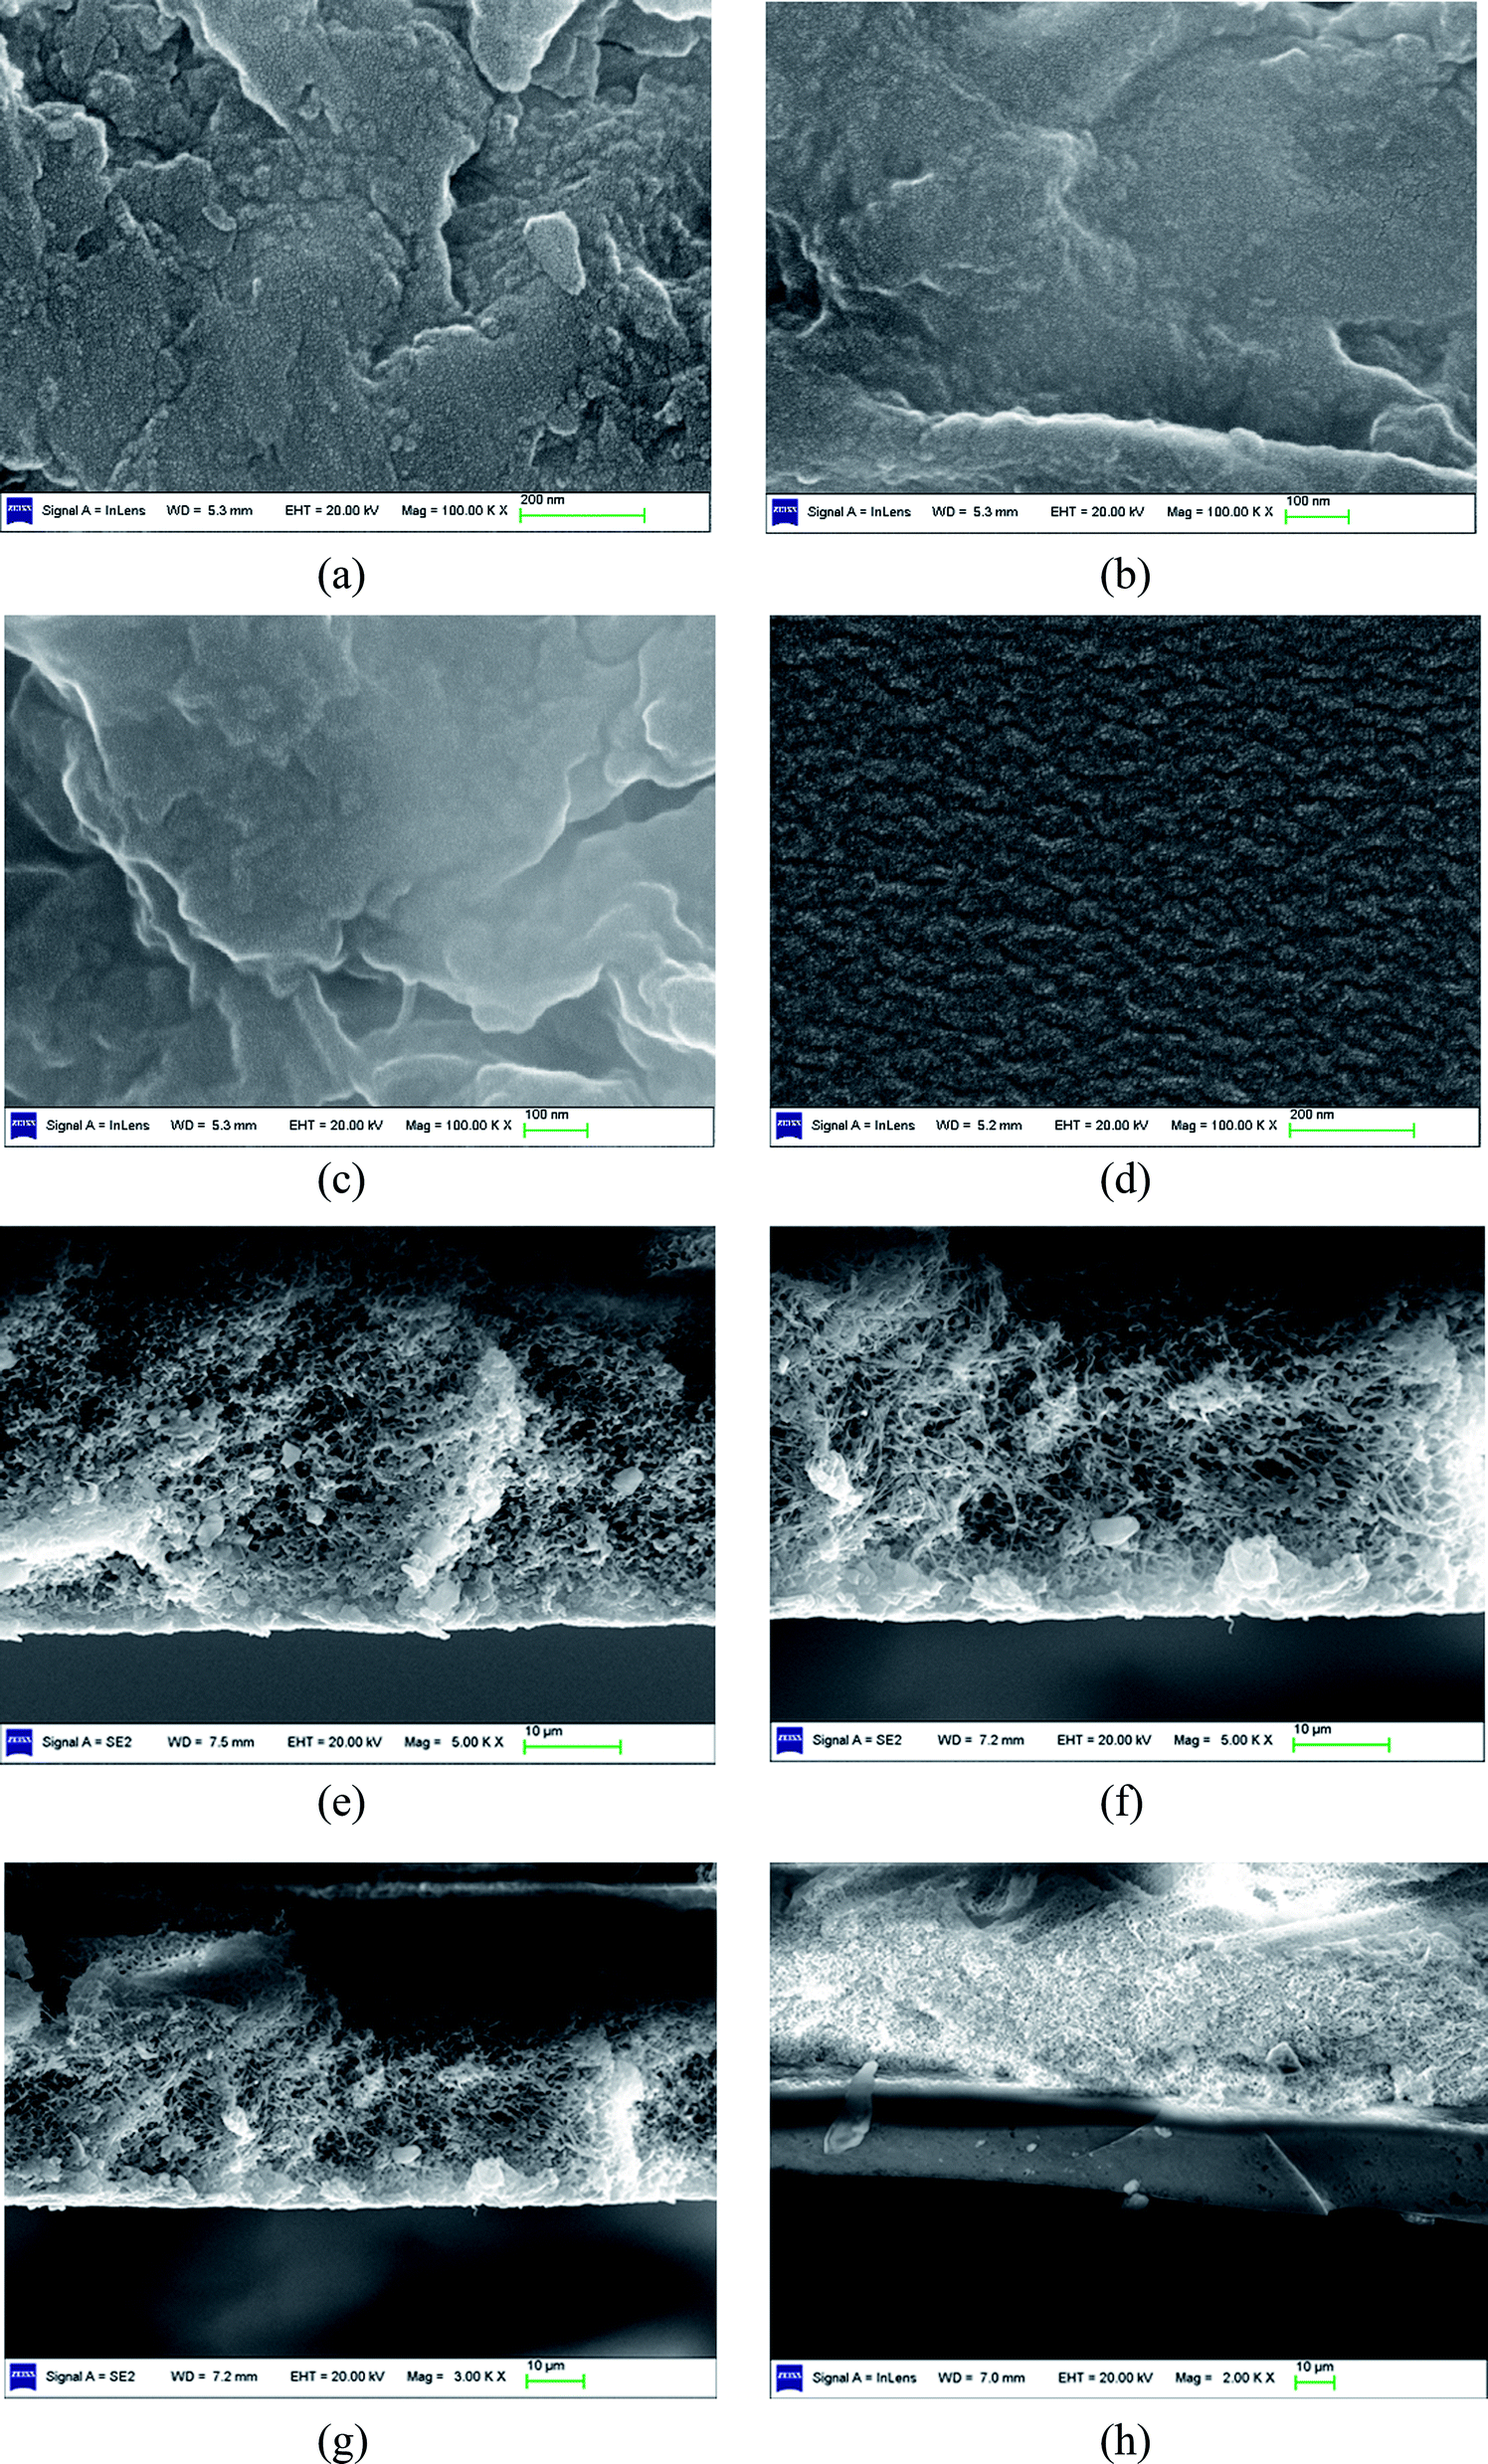
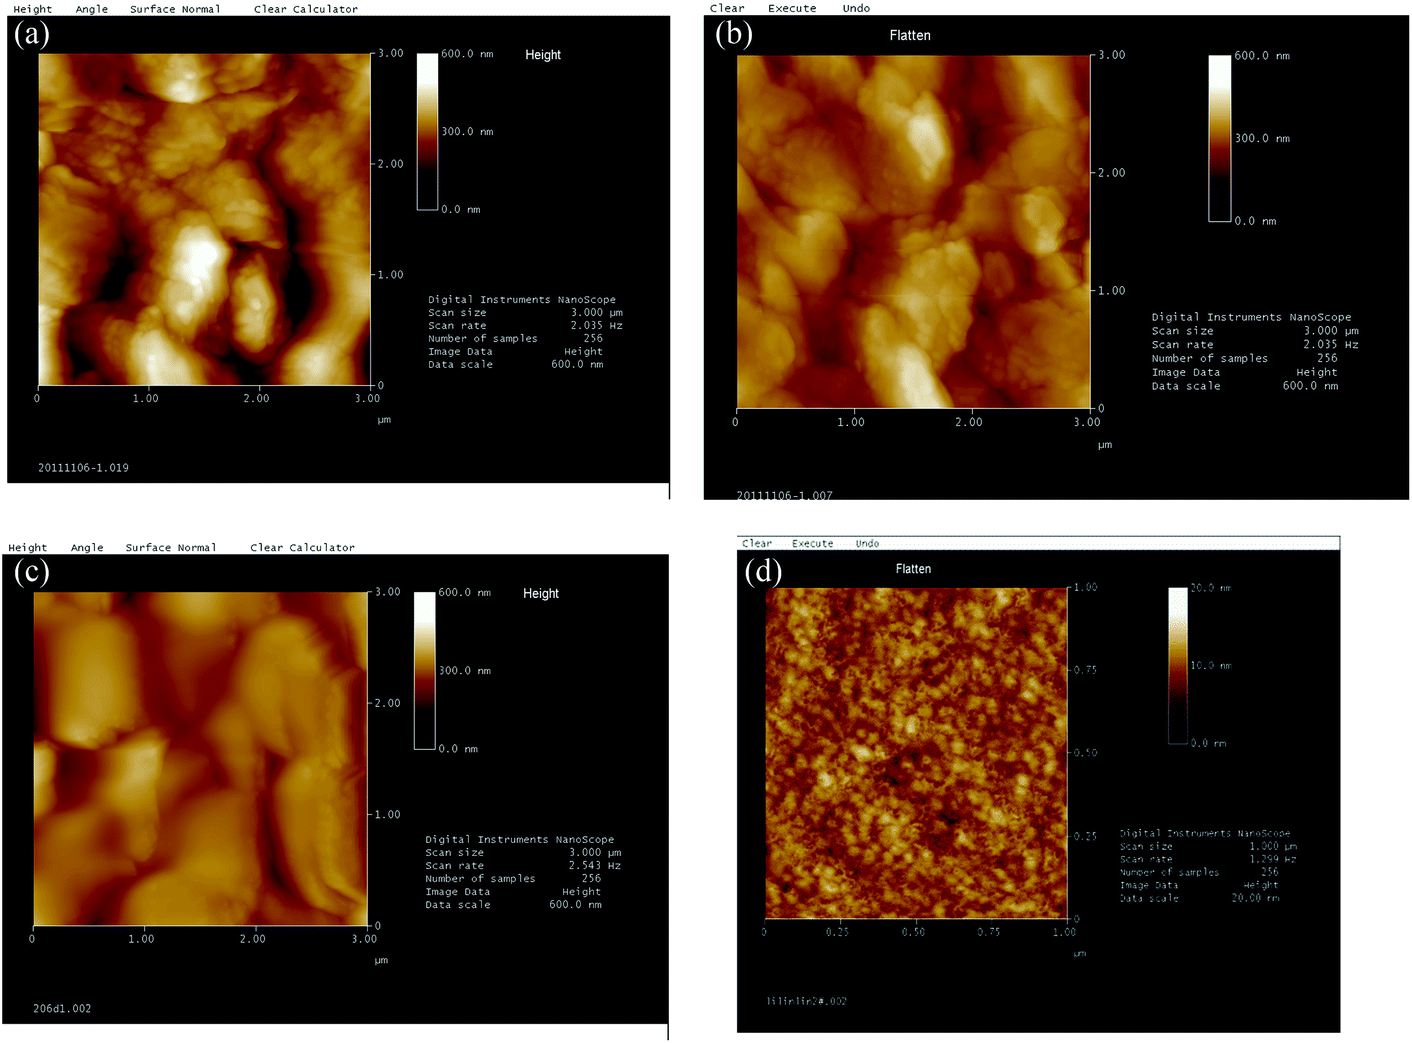
SEM and AFM. Fig. 3 shows the SEM images of PVTES and PVTES-X membranes prepared with the same R/Si value of 1.4 for the organic silicon resin in the coating solutions. As for these four dense membranes, no visibly defects and pores are observed from the top SEM images. Clearly, new defect-free selective layers have been formed. And the surface roughness of PVTES, PVTES-DMDES and PVTES-HSO membranes is close, which is much larger than that of PVTES-PDMS membrane. The AFM images, as shown in Fig. 4, further confirm the smaller surface roughness of PVTES-PDMS membrane. C. E. Goodyer32 established a model between the surface roughness and flux, and the predicted results showed that higher surface roughness would lead to higher surface area, which could enhance the flux. Therefore, the flux of PVTES, PVTES-DMDES and PVTES-HSO membranes may be higher than that of PVTES-PDMS membrane, due to their higher surface roughness.
 |
| | Fig. 3 Surface and cross-sectional SEM images of PVTES and PVTES-X membranes. (a) Top view of PVTES membrane; (b) top view of PVTES-DMDES membrane; (c) top view of PVTES-HSO membrane; (d) top view of PVTES-PDMS membrane; (e) cross view of PVTES membrane; (f) cross view of PVTES-DMDES membrane; (g) cross view of PVTES-HSO membrane; (h) cross view of PVTES-PDMS membrane. | |
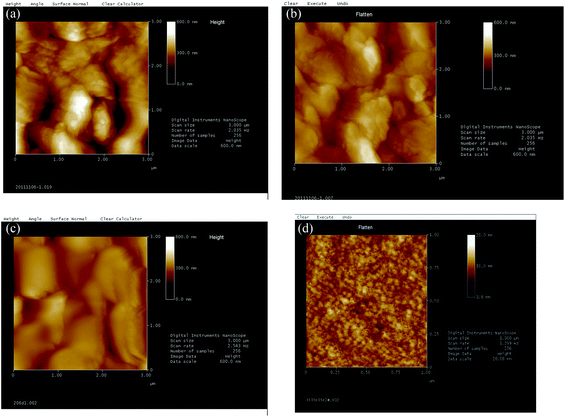 |
| | Fig. 4 AFM images of PVTES and PVTES-X membranes. (a) PVTES membrane; (b) PVTES-DMDES membrane; (c) PVTES-HSO membrane; (d) PVTES-PDMS membrane. | |
From the cross-sectional SEM images, it can be observed that the selective layers merge well with the supporting membrane for PVTES, PVTES-DMDES and PVTES-HSO membranes. And it is difficult to obtain the exact thicknesses of their selective layers on top of the supporting PVDF membranes, because the interface is not clear. While the thicknesses of the PVTES, PVTES-DMDES and PVTES-HSO membranes can be estimated to far less than 1 μm, which is much smaller than that of PVTES-PDMS membrane (∼10 μm). This probably leads to a higher flux of the PVTES, PVTES-DMDES and PVTES-HSO membranes than that of PVTES-PDMS membrane according to the inversely proportional relationship between the thickness of the selective layer and the flux.33
Contact angle (CA) measurement. The contact angle between water and membrane can be used to characterize the hydrophobicity of membrane surface. With the contact angle increasing, the enhancement of membrane surface hydrophobicity is beneficial to the solubility of organics in membrane. As observed in Table 2, the contact angle between water and each PVTES-X membrane is similar, probably owing to the same types of functional groups in these three membranes. And the contact angle of PVTES-X membranes is bigger than that of PVTES membrane, which indicates the stronger hydrophobicity of the modified membranes. This may help to increase the ethanol selectivity of PVTES-X membranes.
Table 2 CA results of PVTES and PVTES-X membranes
| Type of membrane |
PVTES |
PVTES-DMDES |
PVTES-HSO |
PVTES-PDMS |
| CA (°) |
101.0 |
114.0 |
113.0 |
115.0 |
Table 3 Pervaporation data published for separation of ethanol from water with pristine PDMS membranes, in comparison with the results of PVTES and PVTES-X membranes
| Membrane |
XEa (wt%) |
Ta (°C) |
la (μm) |
αa |
Ja (g m−2 h−1) |
Ref. |
| XE-feed ethanol concentration, T-temperature, l-membrane thickness, α-separation factor, J-total flux. |
| PDMS |
5.0 |
40 |
5 |
8.9 |
1600 |
7 |
| 5.0 |
40 |
1–2 |
9.3 |
1140 |
8 |
| 4.0 |
45 |
5 |
8.5 |
1850 |
9 |
| 5.0 |
40 |
8 |
8.5 |
1300 |
10 |
| 8.0 |
42 |
1 |
6.7 |
1440 |
11 |
| 8.0 |
50 |
— |
6.4 |
265 |
12 |
| 4.0 |
45 |
1 |
5.0 |
1600 |
9 |
| 3.0 |
50 |
8 |
1.0 |
2800 |
13 |
| 5.0 |
40 |
10 |
8.8 |
∼240 |
14 |
| 2.0 |
30 |
50 |
10.0 |
∼102 |
15 |
| 4.3 |
40 |
<10 |
6.3 |
5150 |
16 |
| 10.0 |
40 |
120 |
7.4 |
53.3 |
17 |
| 6.4 |
30 |
100 |
10.8 |
25.1 |
18 |
| 3.0 |
41 |
12.5 ± 2 |
4.6 |
120 |
19 |
| PVTES |
9.0 |
35 |
— |
4.9 |
8523.4 |
This work |
| PVTES-DMDES |
9.0 |
35 |
— |
5.6 |
6909.3 |
This work |
| PVTES-HSO |
9.0 |
35 |
— |
6.6 |
8160.1 |
This work |
| PVTES-PDMS |
9.0 |
35 |
— |
6.3 |
539.8 |
This work |
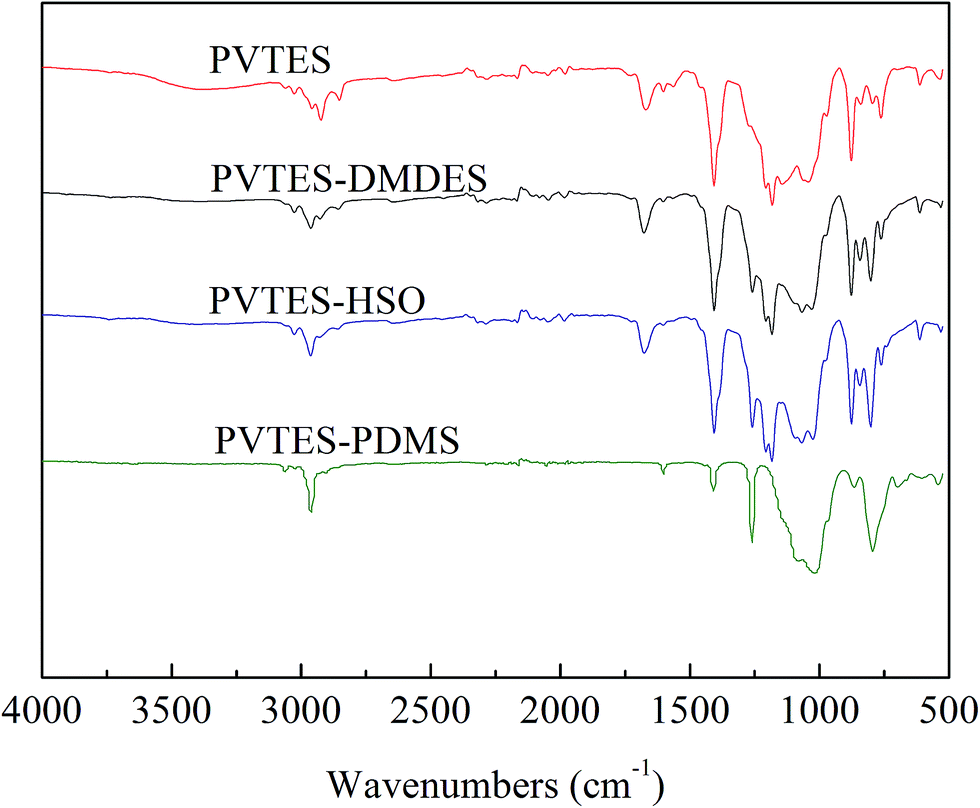
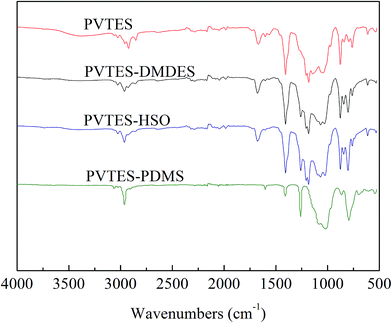
FTIR spectra. The FTIR spectra of the membrane surface are shown in Fig. 5. The peaks at 1410, 1670 and 3070 cm−1 are assigned to the –CH![[double bond, length as m-dash]](https://www.rsc.org/images/entities/char_e001.gif) CH2 absorbance signals. The peak at 1030–1160 cm−1 is characteristic of Si–O–Si stretching and the peak at 1183 cm−1 is characteristic of Si–O–C,34 which indicates that the hydrophobic Si–O–Si backbone has been formed by the hydrolysis and condensation reactions of Si–OCH2CH3 groups, and that the Si–OCH2CH3 groups are not completely reacted, namely, the minority of them still stays in all four membranes. The peak at 1259 cm−1 existing in the FTIR spectra of the PVTES-X membranes is assigned to the –CH3 absorbance signal (the symmetric deformation of Si–CH3),35 which suggests that the materials used to modify PVTES membrane (DMDES, HSO and PDMS) are successfully copolymerized with VTES. In conclusion, compared with PVTES membrane, the PVTES-X membranes contain additional hydrophobic –CH3 groups. This phenomenon illustrates that the hydrophobicity of the PVTES-X membranes is stronger than that of PVTES membrane, which agrees with the CA results, possibly leading to higher sorption selectivity for ethanol/water separation.
CH2 absorbance signals. The peak at 1030–1160 cm−1 is characteristic of Si–O–Si stretching and the peak at 1183 cm−1 is characteristic of Si–O–C,34 which indicates that the hydrophobic Si–O–Si backbone has been formed by the hydrolysis and condensation reactions of Si–OCH2CH3 groups, and that the Si–OCH2CH3 groups are not completely reacted, namely, the minority of them still stays in all four membranes. The peak at 1259 cm−1 existing in the FTIR spectra of the PVTES-X membranes is assigned to the –CH3 absorbance signal (the symmetric deformation of Si–CH3),35 which suggests that the materials used to modify PVTES membrane (DMDES, HSO and PDMS) are successfully copolymerized with VTES. In conclusion, compared with PVTES membrane, the PVTES-X membranes contain additional hydrophobic –CH3 groups. This phenomenon illustrates that the hydrophobicity of the PVTES-X membranes is stronger than that of PVTES membrane, which agrees with the CA results, possibly leading to higher sorption selectivity for ethanol/water separation.
 |
| | Fig. 5 Comparison of FTIR spectra for PVTES and PVTES-X membranes. | |
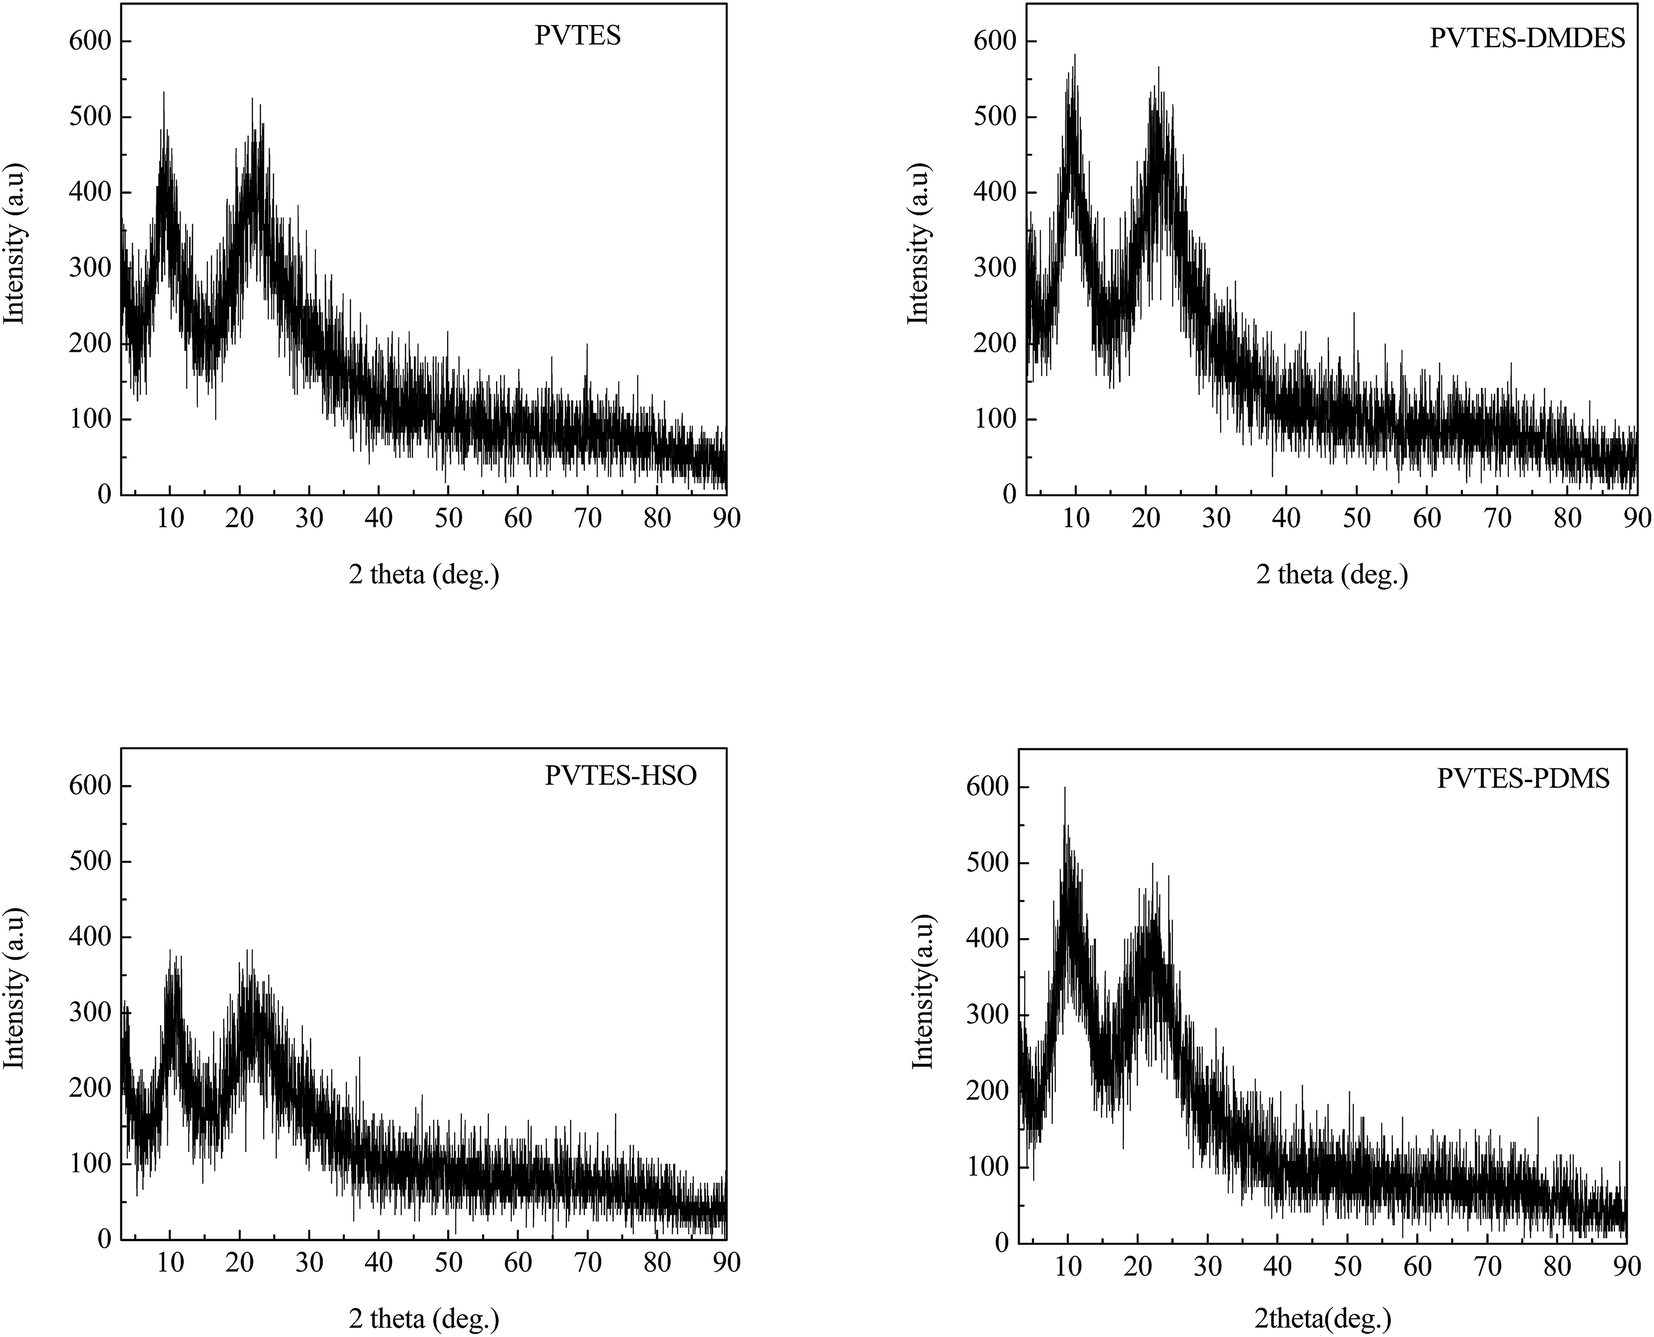
XRD spectra. XRD is a common method used to analyse the crystallinity of the polymers. Generally speaking, the components can permeate through amorphous region not the crystalline region.36 The patterns of these four polymers are displayed in Fig. 6. As illustrated in Fig. 6, there are two broad peaks in each XRD pattern, indicating the amorphous state of these four polymers. And the intensity of PVTES-HSO's peaks decreases compared with that of original PVTES, while for PVTES-DMDES and PVTES-PDMS polymers, they both show slight enhancement. This phenomenon suggests that only the addition of HSO reduces the polymer crystallinity,37 thus lowering the non-continuity nature produced by the crystalline domains and the possibility of large structural defects in the ultrathin membranes. G. L. Jadav et al.37 have proved that the crystallites in thin membranes could lead to the membrane structure with defects and such membranes will give high flux but less selectivity. And this indicates the possible higher separation factor of PVTES-HSO membrane when separating ethanol/water system. While for the thick PVTES-PDMS membrane, the extra-large membrane thickness can compensate for the non-continuity nature, meanwhile reducing the defects.
 |
| | Fig. 6 Comparison of XRD spectra for PVTES and PVTES-X polymers. | |
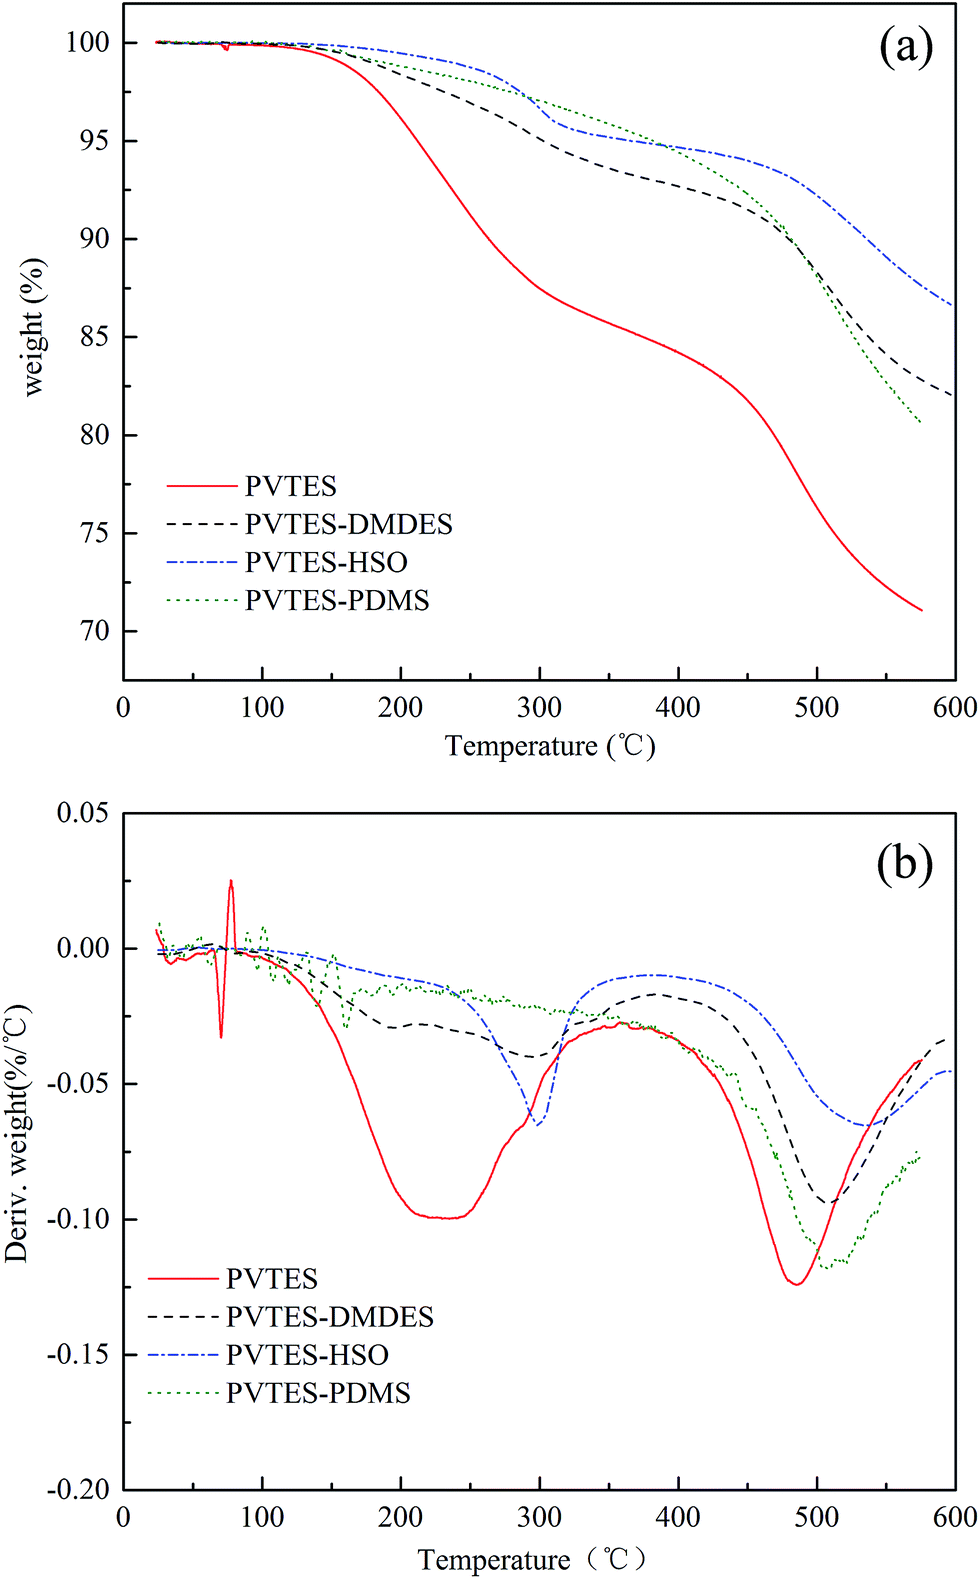
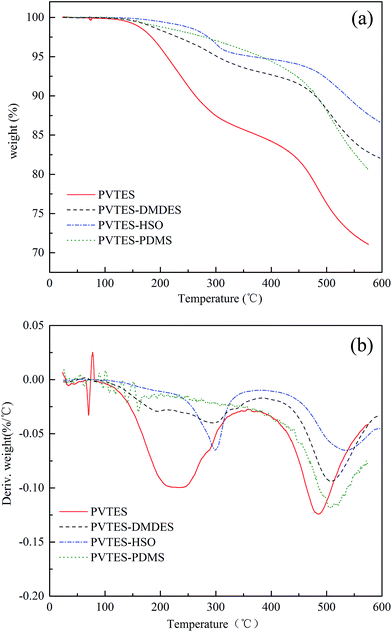
TGA analysis. Thermal decomposition kinetics and stability of PVTES-X and PVTES polymers are investigated using TGA under a nitrogen atmosphere and the results are shown in Fig. 7. The decomposition begins at 150 °C for these four membranes. As observed in Fig. 7(a), the total mass loss of the four membranes ascends in the following order: PVTES > PVTES-PDMS > PVTES-DMDES > PVTES-HSO. The derivative curves are displayed in Fig. 7(b). Except the curve of PVTES-PDMS polymer, the other three DTG curves have two peaks, which correspond to the unzipped degradation and rearranged degradation, respectively.38,39 The missing unzipped degradation process of PVTES-PDMS is probably because of the extremely low content of unreacted Si–OH, which mainly causes the unzipped degradation. Among these four polymers, PVTES-HSO possesses both the highest unzipped degradation temperature and rearranged degradation temperature.
 |
| | Fig. 7 Comparison of TGA and DTG curves for PVTES and PVTES-X polymers. (a) TGA curves of polymers, (b) DTG curves of polymers. | |
In conclusion, with the lowest degradation degree and highest degradation temperature, PVTES-HSO membrane exhibits more excellent thermal stability than other membranes, showing its homogeneous and stable inner structure.
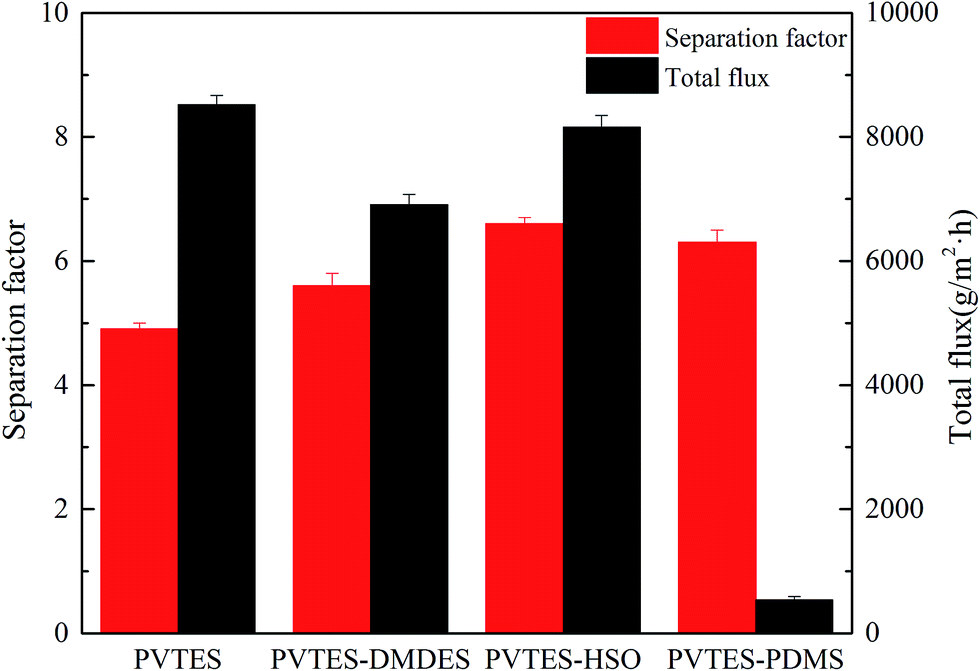
PV performance of PVTES and PVTES-X membranes. As observed in Fig. 8, the separation factor of the PVTES-X membranes is higher than that of PVTES membrane. This result agrees with the conclusion drawn from the characterization results of FTIR and XRD. The amount of hydrophobic groups of the modified membranes is larger than that of PVTES membrane after introducing –CH3 into the membranes, which would benefit the absorption of ethanol in the membrane surface. And also the flexibility of chains in the modified membranes is stronger than that of PVTES membrane due to the increased R/Si, which reduces the possibility of structural defects and thus enhances the membrane selectivity. In addition, the separation factor of PVTES-HSO membrane is 6.7, which is the highest among the modified membranes. Generally, the increase of the modifier's polymerization degree would lead to the increment of the copolymer flexibility and then membrane selectivity. While for the PVTES-PDMS membrane, the excessive swelling will occur since the flexibility of the copolymer is too strong, which results in the decrease of separation factor. Therefore, the proper flexibility of the PVTES-HSO membrane brings about the highest separation factor.
 |
| | Fig. 8 PV performance of PVTES and PVTES-X membranes (R/Si = 1.4; feed concentration: 9 wt%; feed temperature: 35 °C). | |
Fig. 8 also shows that the total flux of PVTES, PVTES-DMDES and PVTES-HSO membranes is almost equal and is much larger than that of PVTES-PDMS membrane. The flux of different membranes is mainly determined by the membrane thickness. Therefore, similar flux of those three membranes is obtained due to their similar membrane thickness, and PVTES-PDMS membrane exhibits lower flux, resulting from its larger thickness, as shown in Fig. 3. This is because the higher viscosity of PVTES-PDMS coating solution brings about a thicker selective layer than other membranes. In summary, PVTES-HSO membrane possesses a superior pervaporation performance among PVTES and the modified membranes.
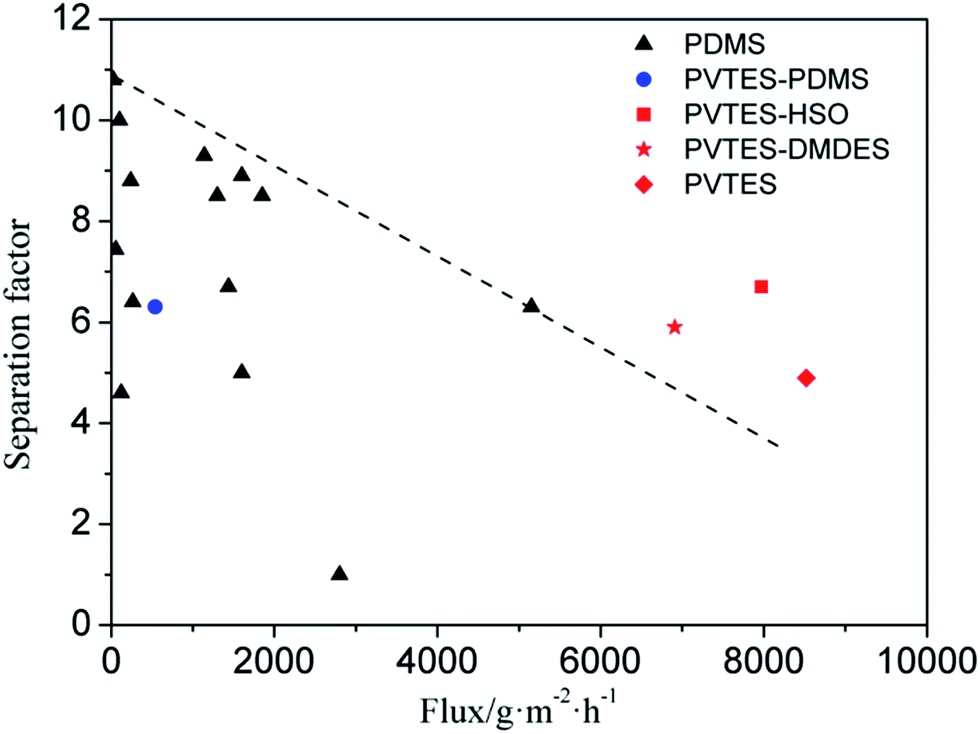
Moreover, considering PDMS as the most commonly used polymeric membrane for PV separation of ethanol/water, the performance of these membranes are compared with the published PV data of the PDMS membranes in Fig. 9. It shows that the PV performance of PVTES-PDMS membrane is close to that of PDMS membrane, which means that the nature of PDMS domains in the PVTES-PDMS membrane. The total flux of PVTES, PVTES-DMDES and PVTES-HSO membranes is much higher than that of PDMS membranes and the high flux means a low membrane area requirement for the ethanol recovery per unit weight, which leads to lower capital investment, lower annual cost and a smaller footprint. And the separation factor with high flux of PVTES, PVTES-DMDES and PVTES-HSO membranes clearly transcend the upper limit of PDMS membranes reported in most literatures (Fig. 9), which implies that PVTES, PVTES-DMDES and PVTES-HSO membranes offer significant potential for PV integrated with ethanol fermentation process.
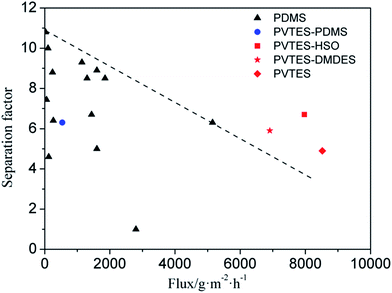 |
| | Fig. 9 PV performance of different membranes in comparison with the published data of pristine PDMS membranes. The dashed line represents the upper limit of the PDMS membranes. The detailed information of data points is shown in Table 3. | |
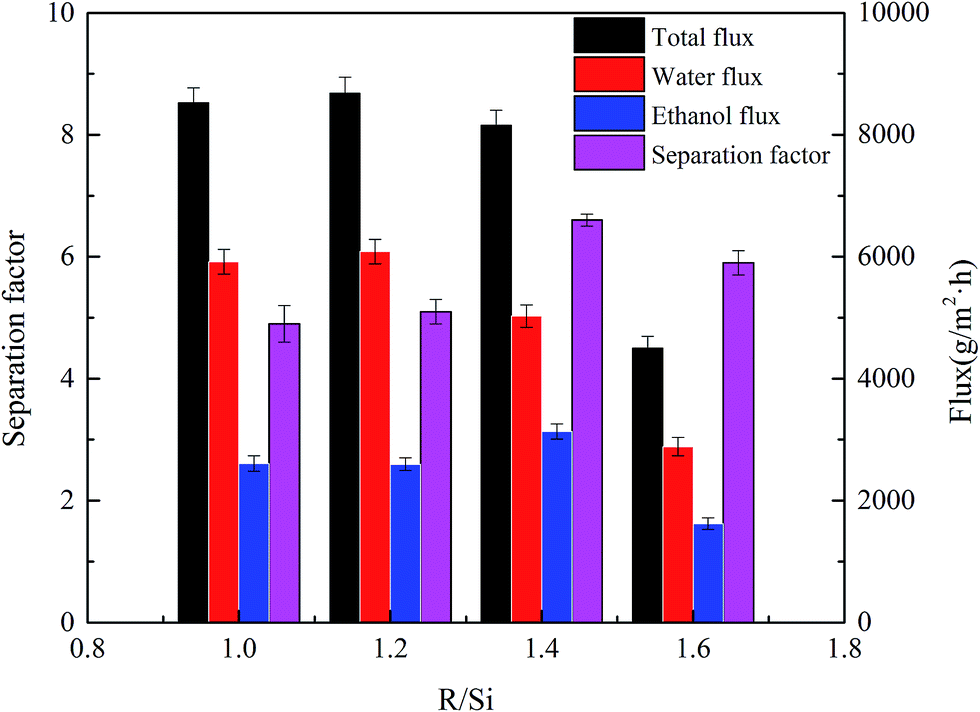
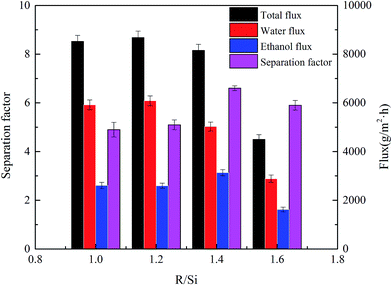
Effect of R/Si value on the PV performance for PVTES-HSO membrane. As discussed in the last section, PVTES-HSO membrane has been proved to be the best pervaporation membrane among those four membranes. The value of R/Si associating with the HSO addition amount is introduced to optimize the performance of PVTES-HSO membrane. As shown in Fig. 10, with the increase of R/Si, HSO content in the copolymer increases. The addition of HSO reduces the polymer crystallinity, thus lowering the non-continuity nature and the possibility of large structural defects, as discussed in the XRD characterization results. It could also improve the content of organic groups of copolymers, leading to the enhanced affinity between ethanol and membrane. Therefore, with R/Si increasing from 1.0 to 1.4, the ethanol flux and separation factor increase, and the water flux decreases slightly. But when R/Si exceeds 1.4, the excess HSO may get self-polymerized apart from copolymerizing with VTES. Similar results were observed that the excessive crosslinking agent gets self-polymerized in the preparation of PDMS membranes by other researchers.40 Therefore a lower flux and separation factor appear due to the excessively dense part because of the self-polymerization, which is more like PDMS twining together. To sum up, when the value of R/Si is chosen as 1.4, the PVTES-HSO membrane exhibits the best PV performance to separate ethanol aqueous solution. At this point, HSO just fills in the VTES backbone while with no excessive self-polymerization, forming a homogeneous structure.
 |
| | Fig. 10 Effect of R/Si value on the PV performance for PVTES-HSO membrane (feed concentration: 9 wt%; feed temperature: 35 °C). | |
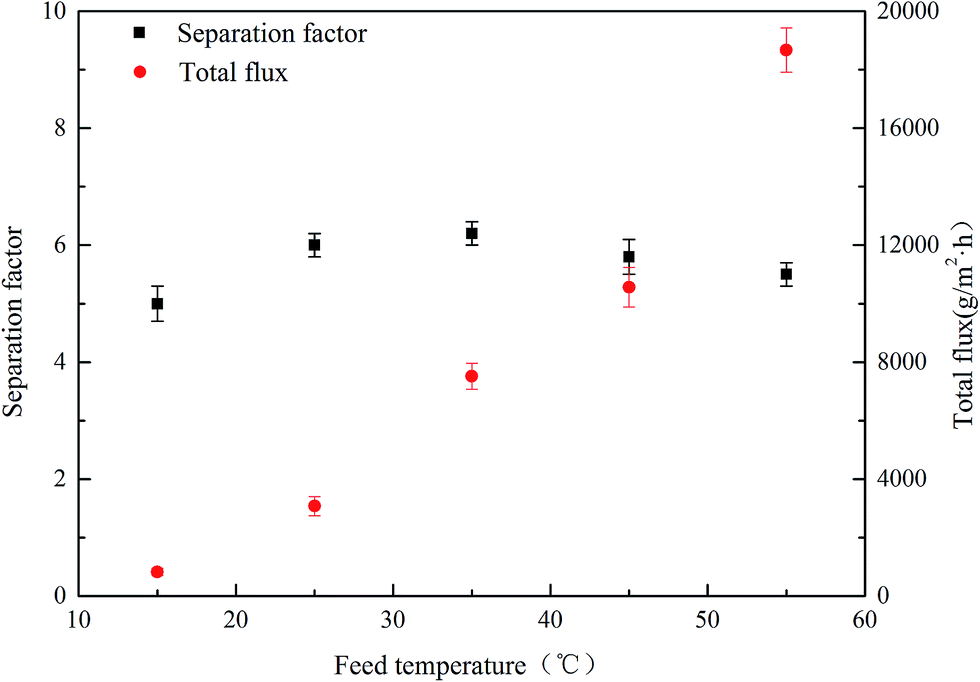
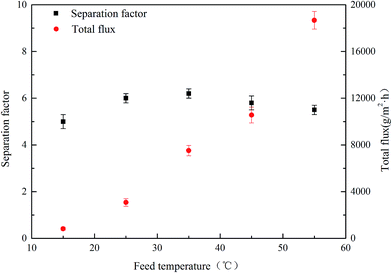
Effect of feed temperature on the PV performance of PVTES-HSO membrane. Fig. 11 illustrates the effect of the feed temperature on the total flux and separation factor. The total flux increases and the separation factor maintains around 6.0 with increasing feed temperature from 15 to 55 °C. The increment of total flux with temperature is due to the increase in the mobility of individual permeating molecules, caused by the enhanced diffusion coefficients and mobility of polymer segments in membranes. On the other hand, the increase of membrane swelling degree with temperature also facilitates both ethanol and water transport, which keeps the separation factor at a relatively constant value. Similar results have also been observed by Jiding Li et al.41
 |
| | Fig. 11 Effect of feed temperature on the PV performance for PVTES-HSO membrane (feed concentration: 9 wt%). | |
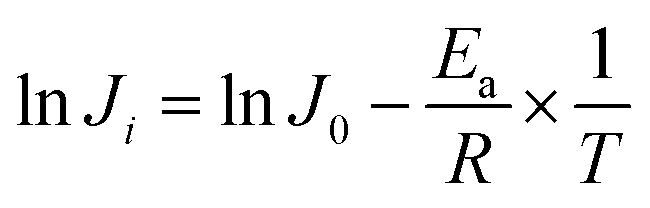
To get a deeper view of the relationship between the temperature and permeation flux, an Arrhenius type equation is applied as follows:42,43
| |
 | (4) |
where
J is the permeate flux,
J0 is a pre-exponential factor,
Ea is the activation energy associated to the permeation process,
R is the gas constant, and
T is the absolute feed temperature.
Eqn (5) is obtained, by rearranging eqn (4).
| |
 | (5) |
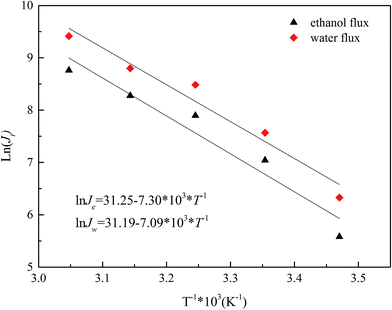
The Ea values for ethanol and water are determined from the slopes of the lnJi versus 1/T plots (Fig. 12). The apparent activation energy Ea reflects the sensitive behavior of the component permeation through the membrane towards temperature alteration.44 If the apparent activation energy is positive, permeate flux increases with the increasing temperature, which is observed in most pervaporation experiments. And a higher value of Ea for component permeation through membrane implies a more sensitive behaviour towards temperature alteration. From Fig. 12, the calculated apparent activation energy of ethanol is 60.7 kJ mol−1, which is close to that of water (58.9 kJ mol−1). The same phenomenon of the similar apparent activation energy of ethanol and water is observed in other literatures.7,26 Therefore, the separation factor of PVTES-HSO membrane maintains at a fixed value, as shown in Fig. 11.
 |
| | Fig. 12 Relationship of lnJi − 1/T for PVTES-HSO membrane (feed concentration: 9 wt%). | |
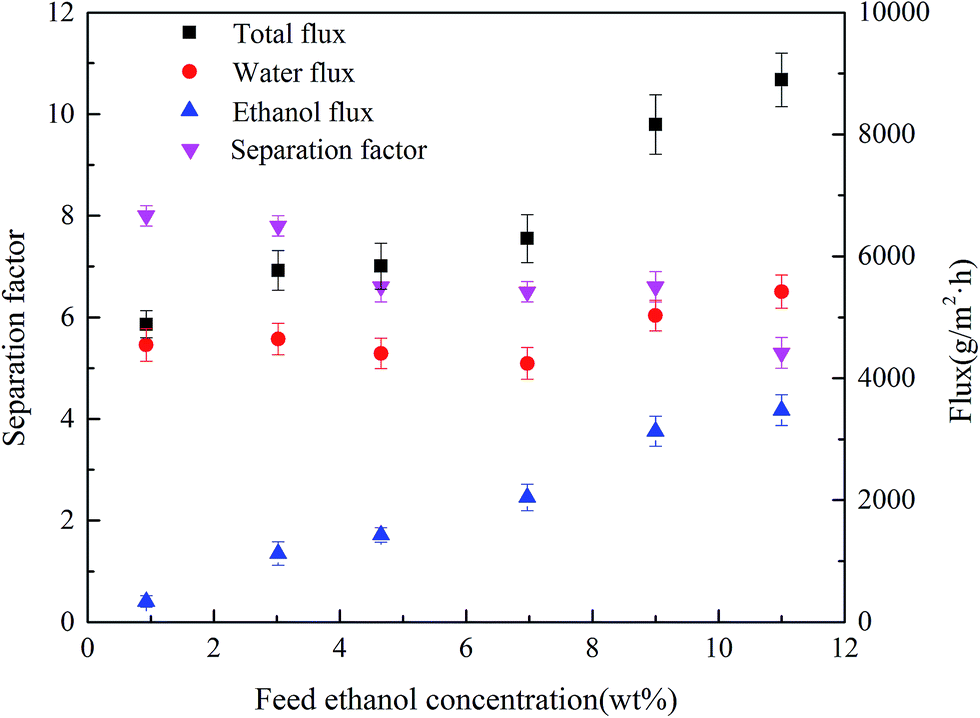
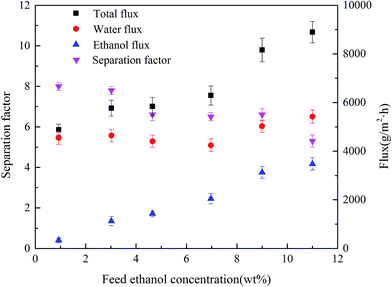
Effect of feed concentration on the PV performance of PVTES-HSO membrane. Effect of feed concentration on the PV performance of PVTES-HSO membrane is shown in Fig. 13. With the increase of the ethanol concentration from 1 wt% to 11 wt%, the total flux increases from 4887 g m−2 h−1 to 8897 g m−2 h−1 and the separation factor drops from 8.0 to 5.3.
 |
| | Fig. 13 Effect of feed concentration on the PV performance for PVTES-HSO membrane (feed temperature: 35 °C). | |
Theoretically, the driving force for component i to transport through a membrane is the difference of its partial vapor pressure at the feed side and that at the permeate side and can be written as follows:45
| | |
Driving force = xiγipsati − xipp
| (6) |
In this work, the permeate pressure is kept close to zero, and the driving force of the component is therefore only determined by its feed fugacity. As shown in Table 4, for the ethanol/water separation process, a higher ethanol fraction leads to lower activity coefficient, but the corresponding ethanol fugacity increases sharply, resulting in a higher driving force and therefore a higher ethanol flux. And the water fugacity decreases very slightly, which is inconsistent with the small upward trend of water flux. This is mainly because of the coupling effect46 of hydrogen bonds between water and ethanol, leading to the enhancement of water permeation with the increase of ethanol permeation. Another reason is that higher ethanol concentration could lead to higher degree of membrane swelling, which benefits both ethanol and water permeations. These causes make water flux increase slightly with the increase of ethanol flux, which results in the decrease of separation factor and the increase of total flux. Similar phenomena have also been reported by previous researchers.45
Table 4 Effect of feed concentration on ethanol and water activity coefficient and feed fugacity (feed temperature: 35 °C)
| Ethanol concentration (wt%) |
Activity coefficient |
Feed fugacity (kPa) |
| Ethanol |
Water |
Ethanol |
Water |
| 1 |
4.6388 |
1.0001 |
0.253 |
5.608 |
| 3 |
4.4619 |
1.0003 |
0.738 |
5.565 |
| 5 |
4.2914 |
1.0010 |
1.198 |
5.522 |
| 7 |
4.1271 |
1.0020 |
1.633 |
5.480 |
| 9 |
3.9688 |
1.0033 |
2.045 |
5.438 |
| 11 |
3.8164 |
1.0050 |
2.435 |
5.397 |
Conclusions
In this paper, the modifiers, which are DMDES, HSO and PDMS containing the same flexible chain unit, are applied to modify the rigid PVTES membrane by copolymerization. A value of R/Si is introduced here to guide the selection of modification chemicals, which could characterize the density of organic groups and the flexibility of membrane materials. SEM, AFM, CA, FTIR, XRD and TGA methods are used to characterize the physical and chemical structure of the PVTES-X and PVTES membranes. Analysis results show that among these modified membranes, PVTES-HSO membrane possesses lower thickness, higher amount of hydrophobic groups, and an inner structure with more proper chain flexibility and lower crystallinity, thus lowering the non-continuity nature and the possibility of large structural defects in the ultrathin membranes. These properties result in the best separation performance of PVTES-HSO membrane, which is much better than that of PVTES membrane. Furthermore, PVTES-HSO membranes with different R/Si values are prepared to optimize their PV performance. And when feed concentration is 9 wt% and feed temperature is 35 °C, the separation factor of the optimal PVTES-HSO membrane (R/Si = 1.4) is around 6.6 and total flux is up to 8160 g m−2 h−1. In conclusion, this PVTES-HSO membrane with good PV performance and thermal stability would be promising for the industrial application of PV process.
Conflicts of interest
There are no conflicts of interest to declare.
Acknowledgements
The authors gratefully acknowledge the financial support from Research Project of Chinese Ministry of Education (No. v201308), National Natural Science Foundation of China (No. 21476010), as well as the special program of Beijing Municipal Science & Technology Commission (No. Z111109055311095).
Notes and references
- A. W. Verkerk, P. V. Male, M. A. G. Vorstman and J. T. F. Keurentjes, J. Membr. Sci., 2001, 193, 227–238 CrossRef CAS.
- T. C. Bowen, R. G. Meier and L. M. Vane, J. Membr. Sci., 2007, 298, 117–125 CrossRef CAS.
- G. Liu, W. Wei, H. Wu, X. L. Dong, M. Jiang and W. Q. Jin, J. Membr. Sci., 2011, 373, 121–129 CrossRef CAS.
- D. J. O'Brien, L. H. Roth and A. J. McAloon, J. Membr. Sci., 2005, 166, 105–111 CrossRef.
- M. Bennett, B. J. Brisdon, R. England and R. W. Field, J. Membr. Sci., 1997, 137, 63 CrossRef CAS.
- P. Peng, B. Shi and Y. Lan, Sep. Sci. Technol., 2011, 46, 420–427 CrossRef CAS.
- W. Wei, S. Xia, G. Liu, X. Dong, W. Jin and N. Xu, J. Membr. Sci., 2011, 375, 334–344 CrossRef CAS.
- Y. Luo, S. Tan, H. Wang, F. Wu, X. Liu, L. Li and Z. Zhang, Chem. Eng. J., 2008, 137, 496–502 CrossRef CAS.
- E. Shi, W. Huang, Z. Xiao, D. Li and M. Tang, J. Appl. Polym. Sci., 2007, 104, 2468–2477 CrossRef CAS.
- L. Li, Z. Xiao, S. Tan, L. Pu and Z. Zhang, J. Membr. Sci., 2004, 243, 177–187 CrossRef CAS.
- W. Zhang, X. Yu and Q. Yuan, Biotechnol. Tech., 1995, 9, 299–304 CrossRef CAS.
- J. Guo, G. Zhang, W. Wu, S. Ji, Z. Qin and Z. Liu, Chem. Eng. J., 2010, 158, 558–565 CrossRef CAS.
- T. Mohammadi, A. Aroujalian and A. Bakhshi, Chem. Eng. Sci., 2005, 60, 1875–1880 CrossRef CAS.
- X. Zhan, J. Li, J. Huang and C. Chen, Appl. Biochem. Biotechnol., 2010, 160, 632–642 CrossRef CAS PubMed.
- W. Zhang, W. Sun, J. Yang and Z. Q. Ren, Appl. Biochem. Biotechnol., 2010, 160, 156–167 CrossRef CAS PubMed.
- F. Xiangli, Y. Chen, W. Jin and N. Xu, Ind. Eng. Chem. Res., 2007, 46, 2224–2230 CrossRef CAS.
- T. Uragami and T. Morikawa, J. Appl. Polym. Sci., 1992, 44, 2009–2018 CrossRef CAS.
- K. Ishihara and K. Matsui, J. Appl. Polym. Sci., 1987, 34, 437–440 CrossRef CAS.
- A. Dobrak, A. Figoli, S. Chovau, F. Galiano, S. Simone, I. F. J. Vankelecom, E. Drioli and B. V. Bruggen, J. Colloid Interface Sci., 2010, 346, 254–264 CrossRef CAS PubMed.
- L. M. Vane, J. Chem. Technol. Biotechnol., 2005, 80, 603 CrossRef CAS.
- D. Beaumelle, M. Marin and H. Gibert, Food Bioprod. Process., 1993, 71, 77 CAS.
- C. H. Yu, I. Kusumawardhana, J. Y. Lai and Y. L. Liu, J. Colloid Interface Sci., 2009, 336, 260–267 CrossRef CAS PubMed.
- Q. An, W. S. Hung, S. C. Lo, Y. H. Li, M. D. Guzman, C. C. Hu, K. R. Lee, Y. C. Jean and J. Y. Lai, Macromolecules, 2012, 45, 3428–3435 CrossRef CAS.
- H. Matsuyama, A. Kariya and M. Teramoto, J. Membr. Sci., 1994, 88, 85–92 CrossRef CAS.
- F. Pan, H. Jia, S. Qiao, Z. Jiang, J. Wang, B. Wang and Y. Zhong, J. Membr. Sci., 2009, 341, 279–285 CrossRef CAS.
- W. Zhang, C. Xia, L. Li, Z. Ren, J. Liu and X. Yang, RSC Adv., 2014, 4, 14592–14596 RSC.
- Y. Nagase, K. Ishihara and K. Matsui, J. Polym. Sci., Part B: Polym. Phys., 1990, 28, 377–386 CrossRef CAS.
- Q. Guo, H. Huang and Q. Wu, Silicone Mater., 2006, 20, 51–52 Search PubMed.
- W. Yoshida, R. P. Castro, J. D. Jou and Y. Cohen, Langmuir, 2001, 17, 5882–5888 CrossRef CAS.
- N. N. Herrera, J. M. Letoffe, J. P. Reymond and E. B. Lami, J. Mater. Chem., 2005, 15, 863–871 RSC.
- S. Feng, Organic silicon resins and their applications, ed. J. Zhang and M. Li, Chemical Industry Press, Beijing, CN, 2004, pp. 160–162 Search PubMed.
- C. E. Goodyer and A. L. Bunge, J. Membr. Sci., 2012, 409–410, 127–136 CrossRef CAS.
- L. Sun, G. L. Baker and M. L. Bruening, Macromolecules, 2005, 38, 2307–2314 CrossRef CAS.
- H. Dong, M. A. Brook and J. D. Brennan, Chem. Mater., 2005, 17, 2807–2816 CrossRef CAS.
- C. Wu, D. Gao, W. Li and M. Jia, Paint Coat. Ind., 2009, 39, 22–25 CAS.
- X. Jiang, Y. Zeng, Y. Shi and G. Chen, J. Funct. Polym., 2001, 14, 133–137 CrossRef CAS.
- G. L. Jadav, V. K. Aswal, H. Bhatt, J. C. Chaudhari and P. S. Singh, J. Membr. Sci., 2012, 415–416, 624–634 CrossRef CAS.
- A. Q. Hou, J. B. Yu and Y. Q. Shi, Eur. Polym. J., 2008, 44, 1696–1700 CrossRef CAS.
- J. L. Hua, Z. Li, J. G. Qin, S. J. Li, C. Ye and Z. H. Lu, React. Funct. Polym., 2007, 67, 25–32 CrossRef CAS.
- S. Li, F. Qin, P. Qin, M. N. Karimb and T. Tan, Green Chem., 2013, 15, 2180 RSC.
- X. Han, L. Wang, J. Li, X. Zhan, J. Chen and J. Yang, J. Appl. Polym. Sci., 2011, 119, 3413 CrossRef CAS.
- J. G. Wijmans and R. W. Baker, J. Membr. Sci., 1993, 79, 101–113 CrossRef CAS.
- X. Feng and R. Y. M. Huang, J. Membr. Sci., 1996, 118, 127–131 CrossRef CAS.
- V. García, E. Pongrácz, E. Muurinen and R. Keiski, J. Membr. Sci., 2009, 326, 92–102 CrossRef.
- N. L. Le, Y. Wang and T. S. Chung, J. Membr. Sci., 2011, 379, 174–183 CrossRef CAS.
- E. Drioli, S. Zhang and A. Basile, J. Membr. Sci., 1993, 81, 43–55 CrossRef CAS.
|
| This journal is © The Royal Society of Chemistry 2017 |
Click here to see how this site uses Cookies. View our privacy policy here. 
 Open Access Article
 This Open Access Article is licensed under a Creative Commons Attribution-Non Commercial 3.0 Unported Licence
 *a
*a