 Open Access Article
Integrated electrocoagulation and membrane filtration for PAH removal from realistic industrial wastewater: effectiveness and mechanisms†
Chenhao Gong ab,
Haiou Huang*a,
Yu Qianb,
Zhongguo Zhang*b and
Hongbin Wuc
aSchool of Environment, Beijing Normal University, No. 19 Xinjiekouwai Street, Beijing 100875, China. E-mail: huanghaiou@bnu.edu.cn; Fax: +86-10-58807734; Tel: +86-10-58807734
bEnvironmental Protection Research Institute of Light Industry, Beijing Academy of Science and Technology, No. 1 Gao Li Zhang Road, Beijing 100095, China. E-mail: cn.zhang@163.com; Fax: +86-10-68456027; Tel: +86-10-68456047
cWenzhou Administration of Shanxi Hydro-Complex, No. 198 Xiushan Road, Wenzhou 325000, China
First published on 13th November 2017
Abstract
In this study, biologically treated, paper-making wastewater (PMWW) containing toxic polycyclic aromatic hydrocarbons (PAHs) was employed as the feedwater to investigate the effectiveness and mechanisms of integrated electrocoagulation (EC) and membrane filtration for the control of PAH pollution incurred by industrial wastewater discharge. The results showed that the integrated treatment was capable of removing more than 90% of polyaromatic hydrocarbon compounds (PAHs) and total organic carbon (TOC) from the wastewater. Specifically, the EC pretreatment contributed to approximately 40% TOC removal and 75% PAH removal via the combined effects of coagulation and oxidation, thereby significantly lowering the contaminant loading of the LPRO treatment. Among the PAHs removed by the EC, 3-ring and 4-ring compounds, including acenaphthene, anthracene, phenanthrene, fluorene and fluoranthene were effectively removed. However, EC-induced degradation of humic-like and fulvic-like substances produced 2-ring PAH compounds, including naphthalene and dimethylnaphthalene, that did not exist in the PMWW. Very importantly, the LPRO treatment efficiently rejected residual PAH compounds in the EC effluent, including those formed by EC treatment, through the solution-diffusion process. Overall, the quality of the final effluent meets the requirements for industrial water reuse; this exhibits the potential value of EC–LPRO for PAH pollution control.
1. Introduction
Currently, one of the major environmental concerns at the global scale is the discharge of harmful pollutants from different industrial effluents and their accumulation in the aquatic environment.1 Among them, paper-making wastewater (PMWW) contains high levels of organic pollutants, including toxic polycyclic aromatic hydrocarbons (PAHs), even after biological treatment.2 As a result, discharge of PMWW without appropriate treatment causes slime growth, thermal impact, scum formation and color problems that kill fish in the receiving water body. More importantly, the accumulation of these toxic compounds may adversely affect human health and the soundness of the ecosystem.3 Therefore, PMWW treatment is of importance to sustainable wastewater management practices worldwide, and thus, cost-effective treatment technologies are in urgent need in order to control water pollution caused by PMWW.4In the past decade, pressure-driven membrane filtration, in particular, reverse osmosis (RO) has gained increasing acceptance for water treatment and reuse applications.5–7 Traditional RO filtration has been found effective in removing most organic and inorganic pollutants, e.g., pesticides, disinfection by-products, pharmaceutical, and heavy metals from aqueous solutions, but at relatively high applied filtration pressures.8,9 Recently, low-pressure reverse osmosis (LPRO) membranes were developed by various manufacturers to offer potential energy and cost savings in water treatment without noticeable compromise in permeate quality.10
Relatively high concentrations of organic pollutants in PMWW necessitate adoption of suitable pretreatment to reduce organic loading to the membrane. Among existing pretreatment technologies, electrocoagulation (EC) treatment has been increasingly applied to enhance organic pollutant removal during industrial wastewater treatment.3,11 During the EC treatment, iron or aluminum in the sacrificial anode is oxidized into divalent or trivalent metal ions and react with water to form metal hydroxide species, such as Al(OH)3, Fe(OH)2 and Fe(OH)3. These metal hydroxide species are capable of removing aqueous pollutants either by forming settleable complexes or co-precipitates. In addition, the oxidation reactions at the anode and the reduction reactions at the cathode may remove some pollutants by transformation. Moreover, hydrogen and oxygen air bubbles produced at the cathode and the anode, respectively, may remove flocs from water by flotation or strip volatile organic pollutants into the air.
Due to the aforementioned mechanisms, EC has been shown to effectively remove various organic compounds,12,13 as well as heavy metals,14,15 anions,16,17 microorganisms,18 and particulate matter from municipal wastewater, drinking water, and industrial wastewaters.19 Also, EC has been found to effectively remove organic matters from PMWW,3,11 but the removals of toxic organics, such as PAHs by EC have not been reported in the literature.
The integration of EC pretreatment with membrane filtration is an emerging technique for advanced wastewater treatment.20–22 Zhao et al. obtained high removals of hardness, chemical oxygen demand (COD) and turbidity by adjusting the current density, reaction time, pH and other treatment conditions of an integrated EC-RO treatment during produced water treatment.20 Pires da Silva et al. reported that EC pretreatment of oil emulsions followed by RO not only produced high-quality effluents that were suitable for reuse, but also significantly minimized membrane fouling.22 These findings suggest that EC treatment is potentially a suitable pretreatment for RO filtration used in the wastewater treatment, but relevant studies have not been reported in the literature.
Therefore, the specific objectives of this research were two-fold: (1) assessing various types of membranes to be integrated with EC for efficient removal of PAHs in the industrial wastewater; and (2) investigating the mechanisms responsible for the removals of PAHs during the integrated EC–LPRO treatment. The outcome of this study provided valuable insights into the development of suitable technologies for the treatment of toxic organics, including PAHs in PMWW. A mechanistic understanding in advanced treatment of PMWW also offered instructive guidance for the treatment and reuse of other industrial wastewaters contaminated by toxic organic compounds.
2. Materials and methods
2.1 Biologically treated paper-making wastewater
PMWW used in this study was a biologically treated wastewater effluent collected from the secondary sedimentation tank of a wastewater treatment facility for a pulp and paper factory located in northern China. Water samples received in the lab were immediately prefiltered by using 1.2 μm glass-fiber filters (Whatman GF/C) to remove small particles and then stored in the dark at 4 °C in a refrigerator. The main characteristics of the prefiltered wastewater sample are presented in Table S1 (ESI†).2.2 Membranes
A suitable membrane for integration with EC pretreatment was selected based upon their water permeability and organic removal efficiency. Therefore, a total of six different types of commercially available, flat-sheet membranes, including three ultrafiltration (UF) membranes, one nanofiltration (NF) membrane, one LPRO membranes, and one RO membrane, were tested in this study. The properties of these membranes are given in Table 1. Before use, each membrane was soaked in ultrapure water overnight, and then installed in a membrane filtration cell (Amicon 8200, USA) possessing a liquid volume of 200 mL and an effective membrane surface area of 28.7 cm2. Then after, at least 1 L of ultrapure water was filtered through the membrane at a constant pressure of 400 kPa for RO and NF or 300 kPa for UF to remove organic preservatives on the membrane.| Designation | Materiala | Molecular weight cutoffa (Da) | Zeta potentialb (mV) | Pure water permeabilityc (L h−1 m−2 bar−1) |
|---|---|---|---|---|
| a Reported by the manufacturers (RC = regenerated cellulose, PTFC = polyamide thin-film composite).b Measured in this study.c Measured in this study. | ||||
| UF-PLAC | RC | 1000 | −11.5 | 5.0 |
| UF-PLBC | RC | 3000 | −9.3 | 7.2 |
| UF-PLCC | RC | 5000 | −14.4 | 9.4 |
| NF90 | PTFC | 200 | −60.5 | 9.7 |
| AK400 | PTFC | 95 | −50.9 | 6.8 |
| BW30 | PTFC | 110 | −61.2 | 4.4 |
2.3 Electrocoagulation setup and protocol
The bench-scale electrocoagulation reactor consisted of three iron electrodes, an EC reactor, and a direct current power supply (Fig. S1, ESI†). The iron electrodes used in this study were 10 cm long, 4 cm wide, and 2 mm thick. The anode and the cathode were wired to the side electrodes, separately. The separation distance between each electrode was maintained at 1 cm.During each EC experiment, 1 L of the prefiltered wastewater was transferred into the EC reactor. Then, the reactor was operated at current densities of 20, 30, or 40 mA cm−2. During each treatment run, the current density was maintained at a fixed value, while the voltages changed between 9 and 10 volts along with the increase of treatment time. The treated effluent was sampled from the reactor at regular time intervals during the treatment. The sampled water was kept in quiescent condition for 30 min to allow gravity settling of the coagulation sludge. Subsequently, the supernatant from each sample bottle was passed through a flat-sheet acetate fiber membrane with a nominal pore size of 0.22 μm (Navigator/13-0.22) to separate the unsettled sludge from the treated water. All the EC treatment experiments were conducted three times to ensure the reproducibility of the results.
2.4 Membranes filtration protocol
At the onset of each LPRO experiment, 150 mL of EC-treated water sample was fed into the filtration cell and continuously stirred by a magnetic stirrer at a constant speed of 400 rpm. The applied pressure for membrane filtration was maintained constantly at 400 kPa for RO and NF or 300 kPa for UF, by adjusting the pressure regulator of a nitrogen gas bottle connected to the filtration cell. The permeate sample was grabbed in a container and weighted with a digital balance (DEANTE, D&T600). The cumulative permeate weight as a function of filtration time was automatically recorded on a PC via a data acquisition system. All membrane filtration experiments were conducted at a controlled room temperature of 25 °C. All membrane filtration experiments were conducted three times to ensure reproducibility.2.5 Analytical methods
![[thin space (1/6-em)]](https://www.rsc.org/images/entities/char_2009.gif) :
:![[thin space (1/6-em)]](https://www.rsc.org/images/entities/char_2009.gif) 1 and an injection port temperature was 290 °C. The oven program was started at 40 °C and held for 4 min, increased at a rate of 10 °C min−1 to 160 °C and held for 1 min, increased at rate of 10 °C min−1 up to 280 °C and held for 4 min, and finally increased at rate of 10 °C min−1 to 300 °C and held for 10 min. Solvent delay time was 8.0 min, and the ion source (EI, 70 eV) for mass detection was kept at 275 °C.
1 and an injection port temperature was 290 °C. The oven program was started at 40 °C and held for 4 min, increased at a rate of 10 °C min−1 to 160 °C and held for 1 min, increased at rate of 10 °C min−1 up to 280 °C and held for 4 min, and finally increased at rate of 10 °C min−1 to 300 °C and held for 10 min. Solvent delay time was 8.0 min, and the ion source (EI, 70 eV) for mass detection was kept at 275 °C.The PAHs quantity method used in this work was based on the China standard for determination of 16 PAHs in water by GC-MS (GB/T 26411-2010). The concentrations of PAHs were quantified based upon their individual peak areas determined in the ion-scan mode in reference to standard solutions with known PAH concentrations. The standards for 16 PAH compounds, including dichloronaphthalene, dimethylnaphthalene, and the surrogate standards for a mixture (acenaphthene-d10, chrysene-d12, naphthaline-d8, pyrene-d12, phenanthrene-d10) and tetrachloro-m-xylene were purchased from AccuStandard company. The concentration of individual PAH compound was calculated by using the following three equations:
 | (1) |
 | (2) |
 | (3) |
3. Results and discussion
3.1 Performance optimization for the EC–LPRO process
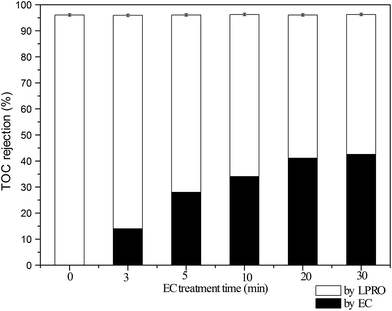
For the purpose of TOC removal, the current density was varied during the EC treatment from 20 mA cm−2 to 40 mA cm−2, resulting in decreases in the residual TOC concentrations with the treatment time (Fig. S2, ESI†), and accordingly, increases in TOC removals. However, the decreases in TOC concentrations were minor when the current density increased from 30 mA cm−2 to 40 mA cm−2 (Fig. S2, ESI†). In addition, the results under 30 min was better on the removal of specific type of pollutants in the following analysis; based on this, the current density was thus set at 30 mA cm−2 for EC pretreatment. Under this condition, the removal efficiency quickly reached 28.0% in 5 min and then slowly increased to 42.5% in the end of 30 min treatment.
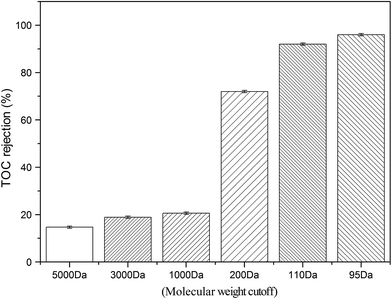
On the other hand, the pure water permeability of the membranes varied significantly with the changes in MWCO values and the membrane type. As shown in Table 1, the permeability of UF membranes decreased from 9.4 L h−1 m−2 bar−1 to 5.0 L h−1 m−2 bar−1 as their MWCO values decreased from 5000 Da to 1000 Da. In comparison, the pure water permeability of the NF and the RO membranes did not change in accordance with their MWCO values. Among them, the NF membrane possessed the highest permeability of 9.65 L h−1 m−2 bar−1, next with the LPRO membrane, while the RO membrane has the lowest permeability albeit similar MWCO values. Considering the pure water permeability and TOC rejection, the LPRO membrane was selected in this study for the integration with EC pretreatment.
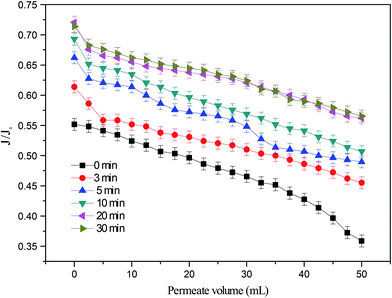
In addition to similar TOC removal, significant decreases in TOC concentrations shown above (Fig. 2) were coincident with noticeable mitigation in membrane fouling (Fig. 3). Without EC pretreatment, the normalized permeate flux (J/J0) for the LPRO declined to 0.35 after filtration of 50 mL of PMWW. In comparison, the final J/J0 value increased with increasing EC treatment time and achieved 0.56 at a pretreatment time of 30 min. Overall, the EC–LPRO process exhibited better water productivity than the standalone LPRO process when other treatment conditions were unchanged.
3.2 PAH removal by the EC–LPRO process
| Name | Chemical structurec | Chemical formula | Molecular weight (g mol−1) | log![[thin space (1/6-em)]](https://www.rsc.org/images/entities/char_2009.gif) Kow Kow |
Solubility in water at 25 °C (mg L−1) |
|---|---|---|---|---|---|
| a PAH compounds detected in PMWW.b PAH compounds detected after the EC treatment.c For compound with multiple congeners, only one congener is shown. | |||||
| Acenaphthenea |  |
C12H10 | 154.2 | 3.92 | 4 |
| Acenaphthylenea |  |
C12H8 | 152.2 | 3.94 | 3.93 |
| Anthracenea |  |
C14H10 | 178.2 | 4.45 | 0.044 |
| Dichloronaphthalenea |  |
C10H6Cl2 | 197.1 | 4.56 | 0.32 |
| Fluoranthenea |  |
C16H10 | 202.3 | 5.16 | 0.23 |
| Fluorenea |  |
C13H10 | 166.2 | 4.18 | 1.89 |
| Phenanthrenea |  |
C14H10 | 178.2 | 4.46 | 1.15 |
| Dimethylnaphthaleneb |  |
C12H12 | 156.2 | 4.31 | 11 |
| Naphthaleneb |  |
C10H8 | 128.1 | 3.30 | 3.1 |
| Compound | Concentration (ng L−1) | Removal percentage (%) | ||||
|---|---|---|---|---|---|---|
| Initial | After EC | After LPRO | EC | LPRO | EC + LPRO | |
| a ND: not detected. | ||||||
| Acenaphthene | 425 | 80 | 40 | 81.2 | 50.0 | 90.6 |
| Acenaphthylene | 16 | 15 | ND | 6.2 | 100 | 100 |
| Anthracene | 321 | 201 | 18 | 37.4 | 91.0 | 94.4 |
| Dichloronaphthalene | 18 | 17 | ND | 5.5 | 100 | 100 |
| Fluoranthene | 80 | 20 | ND | 75.0 | 100 | 100 |
| Fluorene | 611 | 213 | 25 | 65.1 | 88.3 | 95.9 |
| Phenanthrene | 589 | 249 | 35 | 57.7 | 85.9 | 94.1 |
| Dimethylnaphthalene | ND | 1.0 | ND | — | 100 | 100 |
| Naphthalene | ND | 1.8 | ND | — | 100 | 100 |
The PAH compounds were present in PMWW at two distinctive concentration levels (Table 3). Four of them, acenaphthene, anthracene, fluoranthene, and fluorene, existed at relatively high concentrations, ranging from 321–611 ng L−1. Comparatively, the concentrations of acenaphthylene, dichloronaphthalene, and fluoranthene were in a low range of 16–80 ng L−1. As described below, PAH concentration appears to be an important factor relevant to the efficiencies of EC and LPRO in PAH removals.
More efficient removals of 3- and 4-ring compounds by the EC treatment are also coincident with their relatively high concentrations in PMWW. As shown in Table 3, the five types of PAH compounds removable by EC all existed at initial concentrations above 80 ng L−1, while the two poorly removed compounds were present at concentrations below 20 ng L−1. This suggests the potential effect of PAH concentration on its degradation/removal during EC treatment.
According to the literature, the degradation rates of PAHs by advanced oxidation treatment increase as the molecular weight and/or the number of aromatic rings increases.25 Future research is warranted to probe the relative importance of concentration and chemical properties of PAHs to their removals/degradation by EC treatment.
Passage of PAH compounds through the LPRO membrane appeared to be occur when those compounds existed at relatively high influent concentrations (above ca. 80 ng L−1). Incomplete removal of organics in industrial wastewater was also found by other researchers. For example, Ochando-Pulido et al. found that RO rejected most of the organics contained in olive mill wastewater, but there was still 1.9% of organic pollutants cannot be removed in filtration.26
3.3 Mechanisms for organic pollutant removal during EC–LPRO
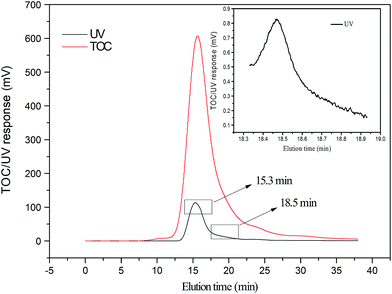
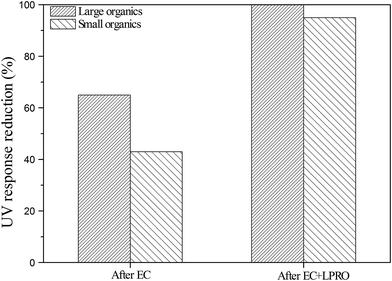
SEC/UV analyses of the step-wise treated effluents further revealed how organics were separately removed by EC and LPRO during the EC–LPRO treatment. After the EC pretreatment, the peak area for the large organics fraction was reduced by 65%, while the peak area for the small organics fraction was reduced by 43% (Fig. 5), suggesting that the EC pretreatment was more efficient in removing large organics than small organics. After the LPRO treatment, the large-organic peak present in the EC-pretreated effluent was completely removed, while the peak area for the small organics peak was reduced by 95%. A small amount of small organics still passed through the membrane, possibly due to their relatively low molecular weight (ca. 200 Da). According to Table 2, all PAH compounds detected in PMWW or the treated effluent possess molecular weights close or below 200 Da and belong to this SEC fraction. Therefore, the SEC results shown in Fig. 5 were generally in agreement with the PAH removal results (Table 3).
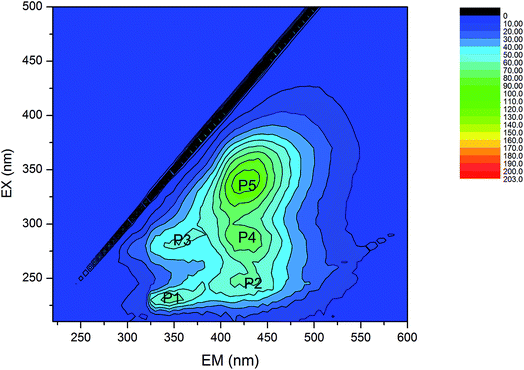 | ||
| Fig. 6 Composition of organic pollutants in the PMWW determined by fluorescence excitation-emission matrix spectroscopy. | ||
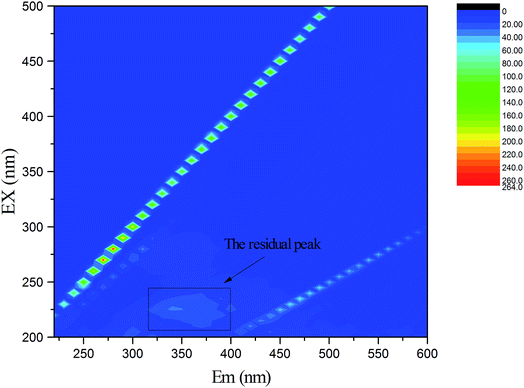
The EC pretreatment not only reduced the TOC level of the wastewater, but also changed its organic composition, (Fig. S3, ESI†). The fluorescent intensities of different EEM fractions underwent significant changes after EC treatment and their removal efficiencies followed the order of peak 4 > peak 2 > peak 5. EC treatment efficiently removed humic acid-like and fulvic acid-like fluorescent compounds. Oppositely, the fluorescent intensities of bicyclic aromatic compounds (peak 1) and protein tryptophan-like substances (peak 3) increased by 300% and 150%, respectively, suggesting the production of the two organic components during EC treatment. The downstream LPRO treatment removed residual organics in the EC-treated effluent, except for a small amount of bicyclic aromatic and small hard compounds (Fig. 7). These results were consistent with the finding that some PAHs passed through the LPRO membrane into the permeate (Table 3). The production of bicyclic aromatic compounds and protein-like substances during EC treatment also took place coincidently with the generation of dimethylnaphthalene and naphthalene.
EEM analyses revealed that the transformation of organic pollutants during the EC pretreatment of the integrated process. Specifically, the humic acid-like and fulvic acid-like fluorescent compounds were degraded during the electrochemical oxidation process and formed the final products included new PAH compounds (i.e., naphthalene and dimethylnaphthalene) and bicyclic aromatic compounds and protein tryptophan-like substances (Fig. S3, ESI†). Similarly, Ciputra et al. also found that the recalcitrant dissolved organic matter from paper mill effluent was easily degraded into bicyclic aromatic compounds and other small organic in the oxidation treatment.31
4. Conclusions
A biologically-treated, paper-making wastewater effluent containing PAHs was treated by electrocoagulation, followed by low-pressure reverse osmosis to explore the effectiveness and mechanisms of the integrated treatment for advanced industrial water treatment. The experimental results demonstrated that EC mitigated 40% of the organic loading and 75% of PAHs to the LPRO, and significantly reduced the fouling of downstream membranes. On the other hand, LPRO served as a reliable barrier for a majority of residual organics in the EC-pretreated effluent, including harmful by-products formed by EC. Overall, the EC–LPRO treatment removed 96% of organic matter and 94% of PAHs in the PMWW. The high-quality, final effluent is expected to meet the requirements for industrial wastewater reuse purposes.Mechanistically, EC treatment primarily removed medium molecular weight (∼800 Da) humic-like or fulvic-like organics, as well as 3-ring and 4-ring PAH compounds present in the PMWW, possibly because of their relatively high concentrations and reactivities during the coagulation and electrochemical processes. However, some 2-ring PAH compounds were produced due to incomplete electrochemical degradation of humic acid-like and fulvic acid-like substances. Furthermore, the LPRO treatment was effective in removing a majority of organics in PMWW or EC-pretreated effluent because of the small molecular weight cutoff of the membrane (95 Da). Only limited amounts of small organics, such as PAH compounds at influent concentrations of 80 ng L−1 or more, passed into the membrane permeate.
Overall, the integrated EC–LPRO treatment was highly effective in removing PAHs contained in the PMWW; these findings provided important baseline information for potential large-scale application of EC–LPRO technique to advanced industrial wastewater treatment and reuse.
Conflicts of interest
There are no conflicts to declare.Acknowledgements
The authors greatly appreciate the financial support of the Special Funds for Technological Development of Research Institutes from the Ministry of Science and Technology of China (2013EG111129), the Program for Youth Scientists of the Beijing Academy of Science and Technology (201505), and the Special Fund of the State Joint Key Laboratory for Environmental Simulation and Pollution Control (270403GK).References
- M. Boroski, A. C. Rodrigues, J. C. Garcia, A. P. Gerola, J. Nozaki and N. Hioka, J. Hazard. Mater., 2008, 160, 135–141 CrossRef CAS PubMed.
- S. Zodi, J. N. Louvet, C. Michon, O. Potier, M. N. Pons, F. Lapicque and J. P. Leclerc, Sep. Purif. Technol., 2011, 81, 62–68 CrossRef CAS.
- R. Katal and H. Pahlavanzadeh, Desalination, 2011, 265, 199–205 CrossRef CAS.
- M. L. Hewitt, T. G. Kovacs, M. G. Dube, D. L. MacLatchy, P. H. Martel, M. E. McMaster, M. G. Paice, J. P. Parrott, M. R. Van Den Heuvel and G. J. Van Der Kraak, Environ. Toxicol. Chem., 2008, 27, 682–697 CrossRef PubMed.
- J. Radjenovic, M. Petrovic, F. Venturac and D. Barcelo, Water Res., 2008, 42, 3601–3610 CrossRef CAS PubMed.
- C. Bellona and J. Drewes, J. Membr. Sci., 2005, 249, 227–234 CrossRef CAS.
- M. G. Buonomenna, RSC Adv., 2013, 3, 5694–5740 RSC.
- S. R. Mozaz, M. Ricart, M. K. Schulmeyer, H. Guasch, C. Bonnineau, L. Proia, M. L. D. Alda, S. Sabater and D. Barcelo, J. Hazard. Mater., 2015, 282, 165–173 CrossRef PubMed.
- J. Yoon, G. Amy, J. Chung, J. Sohn and Y. Yoon, Chemosphere, 2009, 77, 228–235 CrossRef CAS PubMed.
- A. Somrani, A. H. Hamzaous and M. Pontie, Desalination, 2013, 317, 184–192 CrossRef CAS.
- M. Ugurlu, A. Gurses, C. Dogar and M. Yalcin, J. Environ. Manage., 2008, 87, 420–428 CrossRef CAS PubMed.
- J. Q. Jiang, N. Graham, C. Andre, G. H. Kelsall and N. Brandon, Water Res., 2002, 36, 4064–4078 CrossRef CAS PubMed.
- P. Canizares, F. Martinez, C. Jimenez, J. Lobato and M. A. Rodrigo, Environ. Sci. Technol., 2006, 40, 6418–6424 CrossRef CAS PubMed.
- G. Mouedhen, M. Feki, M. D. P. Wery and H. F. Ayedi, J. Hazard. Mater., 2008, 150, 124–135 CrossRef CAS PubMed.
- G. C. C. Yang and C. M. Tsai, J. Membr. Sci., 2006, 286, 36–44 CrossRef CAS.
- N. Mameri, A. R. Yeddou, H. Lounici, D. Belhocine, H. Grib and B. Bariou, Water Res., 1998, 32, 1604–1612 CrossRef CAS.
- F. Shen, X. Chen, P. Gao and G. Chen, Chem. Eng. Sci., 2003, 58, 987–993 CrossRef CAS.
- B. Zhu, D. A. Clifford and S. Chellam, Water Res., 2005, 39, 3098–3108 CrossRef CAS PubMed.
- P. K. Holt, G. W. Barton, M. Wark and C. A. Mitchell, Colloids Surf., A, 2002, 211, 233–248 CrossRef CAS.
- S. Zhao, G. Huang, G. Cheng, Y. Wang and H. Fu, Desalination, 2014, 344, 454–462 CrossRef CAS.
- W. Den and C. Wang, Sep. Purif. Technol., 2008, 59, 318–325 CrossRef CAS.
- J. R. Pires da Silva, F. Mercon, L. F. da Silva, A. A. Cerqueira, P. B. Ximango and M. R. da Costa Marques, Journal of Water Process Engineering, 2015, 8, 126–135 CrossRef.
- T. Janhom, S. Wattanachira and P. Pavasant, J. Environ. Manage., 2009, 90, 1184–1190 CrossRef CAS PubMed.
- M. Lin, X. Ning, T. An, J. Zhang, C. Chen, Y. Ke, Y. Wang, Y. Zhang, J. Su and J. Liu, J. Hazard. Mater., 2016, 307, 7–16 CrossRef CAS PubMed.
- J. Kochany and R. J. Maguire, Sci. Total Environ., 1994, 144, 17–31 CrossRef CAS.
- J. M. Ochando-Pulido, G. Hodaifa, M. D. Victor-Ortega, S. Rodriguez-Vives and A. Martinez-Ferez, J. Hazard. Mater., 2013, 263p, 158–167 CrossRef PubMed.
- J. Wei, Y. Song, X. Tu, L. Zhao and E. Zhi, Chem. Eng. J., 2013, 218, 319–326 CrossRef CAS.
- P. Coble, Mar. Chem., 1996, 51, 325–346 CrossRef CAS.
- A. Baker and M. Curry, Water Res., 2004, 38, 2605–2613 CrossRef CAS PubMed.
- A. Baker, Environ. Sci. Technol., 2002, 36, 1377–1382 CrossRef CAS PubMed.
- S. Ciputra, A. Antony, R. Phillips, D. Richardson and G. Leslie, Chemosphere, 2010, 81, 86–91 CrossRef CAS PubMed.
Footnote |
| † Electronic supplementary information (ESI) available. See DOI: 10.1039/c7ra09372a |
| This journal is © The Royal Society of Chemistry 2017 |

