
 Open Access Article
 This Open Access Article is licensed under a
 Creative Commons Attribution 3.0 Unported Licence
Novel iodine-doped reduced graphene oxide anode for sodium ion batteries†
Jianwei Lia,
Xifei Li *abc,
Dongbin Xiongb,
Youchen Haoa,
Huari Koua,
Wen Liua,
Dejun Lia and
Zhiqiang Niuc
*abc,
Dongbin Xiongb,
Youchen Haoa,
Huari Koua,
Wen Liua,
Dejun Lia and
Zhiqiang Niuc
aTianjin International Joint Research Centre of Surface Technology for Energy Storage Materials, College of Physics and Materials Science, Tianjin Normal University, Tianjin 300387, China. E-mail: xfli2011@hotmail.com
bInstitute of Advanced Electrochemical Energy, Xi'an University of Technology, Xi'an 710048, China
cKey Laboratory of Advanced Energy Materials Chemistry (Ministry of Education), Collaborative Innovation Center of Chemical Science and Engineering, College of Chemistry, Nankai University, Tianjin 300071, China
First published on 4th December 2017
Abstract
It is reported for the first time that iodine-doped reduced graphene oxide (I-rGO) has been designed as an anode material for sodium ion batteries (SIBs). In comparison to rGO, I-rGO with a high specific surface area exhibits a high reversible capacity (270 mA h g−1 at 50 mA g−1), good long-term cycling performance, with a high capacity of 212 mA h g−1 after 100 cycles, and excellent rate capability. The enhanced performance is due to defect evolution and enlarged layer distance by the doping of iodine atoms.
1. Introduction
Sodium ion batteries (SIBs) have been regarded as an ideal alternative for energy storage devices because of the low cost and abundance of Na resources.1,2 However, many challenges must be addressed prior to their large-scale application.3–6 To find an ideal material to allow rapid Na+ insertion/extraction is of importance because Na ions have a larger radius than Li ions.2,3,7 Carbon materials have been extensively investigated for SIB anodes.8–12 However, the typical graphite material in lithium ion batteries (LIBs) shows poor performance since only a few sodium ions are inserted into the graphite layers.13 Graphene, a two-dimensional (2D) material with unique properties, has become a popular energy-storage electrode material since its discovery.14–19 Graphene has been widely used in LIBs due to its high electrical conductivity and specific surface area.14,20–23 It has been demonstrated that reduced graphene oxide (rGO) can serve as an anode for SIBs.24–27 rGO nanosheets exhibited electrochemical performance with a reversible capacity of 141 mA h g−1 for SIBs.28It has been demonstrated that the doping strategy of heteroatom such as B, N and P effectively improves graphene performance resulting from increasing electronic conductivity.5,29–31 N-Doped graphene has been widely designed as the electrodes for SIBs. For instance, nitrogen-doped reduced graphene oxide aerogel exhibited a reversible capacity of 287 mA h g−1 at a current density of 0.1 A g−1, higher than that of reduced graphene oxide aerogel.32 A capacity of 260 mA h g−1 was also achieved for nitrogen-doped graphene nanosheets.33 Fluorine and nitrogen co-doped graphene paper can delivered a reversible capacity of 203 mA h g−1.34 Different from other heteroatom doping,5,35–38 iodine doped graphene shows some advantages of crystal structure and defects change.39–41 However, for some of the doped graphene anodes, the cycling stability is poor due to the aggregation of graphene upon cycling. It is of importance to design an effective method for doping heteroatoms into the graphene layers to suppress their aggregation. Meng et al. developed a kind of I-doped graphene, when employed as anode material for LIBs, the I-doped graphene exhibited outstanding cycling stability. In addition to battery application, iodine/nitrogen co-doped graphene was designed as metal free catalyst for oxygen reduction reaction, resulting in enhanced electrochemical activity.42,43 After the introduction of iodine, the positive charge density of the graphene increases, leading to improved electrochemical activity.44 So far, as a result, few studies were reported to focus on I-rGO as anode materials for SIBs.
In this study, we for the first time design I-rGO as anode materials for SIBs. I-rGO is synthesized with a heat treatment method by annealing the mixture of graphite oxide and iodine. The I atoms are introduced into the edge and surface of graphene network after doping. Benefiting from the introduction of iodine atoms, I-rGO exhibits good cycling stability, high reversible capacity as well as improved coulombic efficiency. Such excellent electrochemical performance is superior to the reduce oxide graphene, proving that the I-doped graphene is an ideal anode material for sodium ion batteries.
2. Experimental
2.1 Synthesis
As we previously reported,14 graphite oxide (GO) was synthesized by a modified Hummers method. 100 mg GO and 200 mg iodine were dispersed in 40 mL ethanol by stirring for 2 h. The obtained mixture was heated to 950 °C for 1.5 h under Ar atmosphere with the heating rate of 10 °C min−1. Various I-rGO samples were synthesized by adjusting the mass ratio of iodine and GO, and the obtained samples with the ratios of 1![[thin space (1/6-em)]](https://www.rsc.org/images/entities/char_2009.gif) :1, 2:1 and 5:1 are marked as I-rGO-i, I-rGO-ii and I-rGO-iii, respectively. For comparison, the reduce graphene oxide (rGO) was obtained via a similar approach without the additive of iodine.
:1, 2:1 and 5:1 are marked as I-rGO-i, I-rGO-ii and I-rGO-iii, respectively. For comparison, the reduce graphene oxide (rGO) was obtained via a similar approach without the additive of iodine.
2.2 Material characterizations
The morphologies and elemental composition of samples were characterized using scanning electron microscopy (SEM, SU8010, Hitachi), transmission electron microscopy (TEM, TecnaiG2 F30, FEI) and X-ray photoelectron spectroscopy (XPS, VG ESCALAB MK II). BET measurements based on nitrogen adsorption isotherms by a surface properties analyzer instrument (ASAP 2020, Micromeritics). The Raman measurement of the synthesized material was recorded on a confocal Micro Raman Spectrometer with a LabR/AM HR 800 system (HORIBA, Korea). The functional groups were detected by a Fourier transform infrared spectroscopy instrument (FTIR, IRAffinity-1, SHIMADZU).212.3 Electrochemical measurements
The working electrodes were fabricated by mixing the active material (I-rGO) with polyvinylidene fluoride binder (PVDF) and acetylene black in a weight ratio of 80:10:10 in an N-methyl-2-pyrrolidone (NMP) solvent to produce the slurry. The resulting slurry was uniformly pasted onto the Cu foil. Finally, they were dried in a vacuum oven at 80 °C for 12 h. The electrolyte used was 1 M NaClO4 in a mixture of ethylene carbonate (EC) and propylene carbonate (PC) (2:1 by volume) with a 10 vol% addition of fluoroethylene carbonate (FEC). The testing cell contained the working electrode, sodium metal as the counter and reference electrodes, and a glass fibre (GF/F, Whatman) as the separator. Electrochemical performance was evaluated using a CR2032-type coin cell assembled in an argon-filled glove box. The charge/discharge characteristics were measured by a multichannel Land battery tester (LANHE CT2001A). The rate capability was performed at 50, 100, 200, and 500 mA g−1. Cyclic voltammetry (CV) was tested using a Princeton Applied Research VersaSTAT4 at a scan rate of 0.1 mV s−1 within the potential range of 0.01–3.0 V. Electrochemical impedance spectroscopy was performed from 100 kHz to 0.01 Hz at an amplitude of 5 mV via the Princeton Applied Research VersaSTAT4.46
3. Results and discussion
The experimental scheme for I-rGO preparation is illustrated in Fig. 1. Briefly, I-rGO was prepared by annealing graphene oxide (GO) and iodine in argon. The content of doped iodine in the I-rGO can be adjusted by varying the mass ratios of GO to iodine.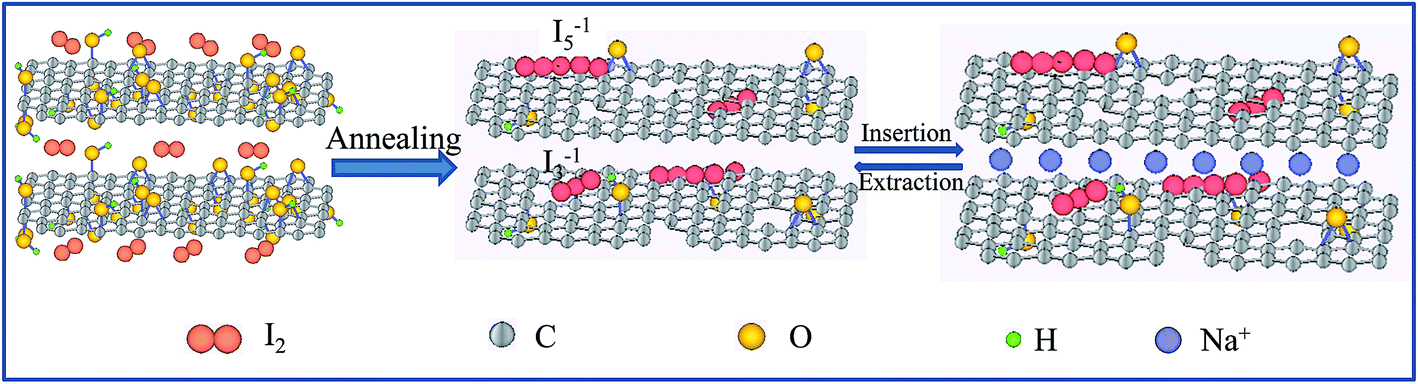 | ||
| Fig. 1 Schematic illustration showing the synthesis of I-rGO and the advantage of I-rGO for Na storage. | ||
Fig. 2(a and b) display the layer nature of rGO with a thin, wrinkled structure. It leads to a lot of free spaces among the graphene layers with porous structure, which is conducive to the Na ion insertion/extraction and electrolyte infiltration. As shown in Fig. 2(c and d), I-rGO reveals a similar structure, and the introduction of heteroatoms (iodine) may not distinctly influence the crinkled-like surface of rGO. Fig. 3(a and c) reveal the transparent nature of rGO and I-rGO with a few layers. The high-resolution TEM (HRTEM) images in Fig. 3(b and d) show that the layers of rGO and I-rGO are multilayers. In Fig. 3d, I-rGO is observed to be about 5 layers, and its layer distance is 0.350 nm. The selected area electron diffraction (SAED) patterns inserted in Fig. 3(b and d) further prove that the rGO and I-rGO are with multilayers.43 The energy dispersive X-ray spectroscopy (EDS) mapping in Fig. 4 displays a homogeneous distribution of iodine in the rGO, which further confirms the doping of iodine into graphene layers.
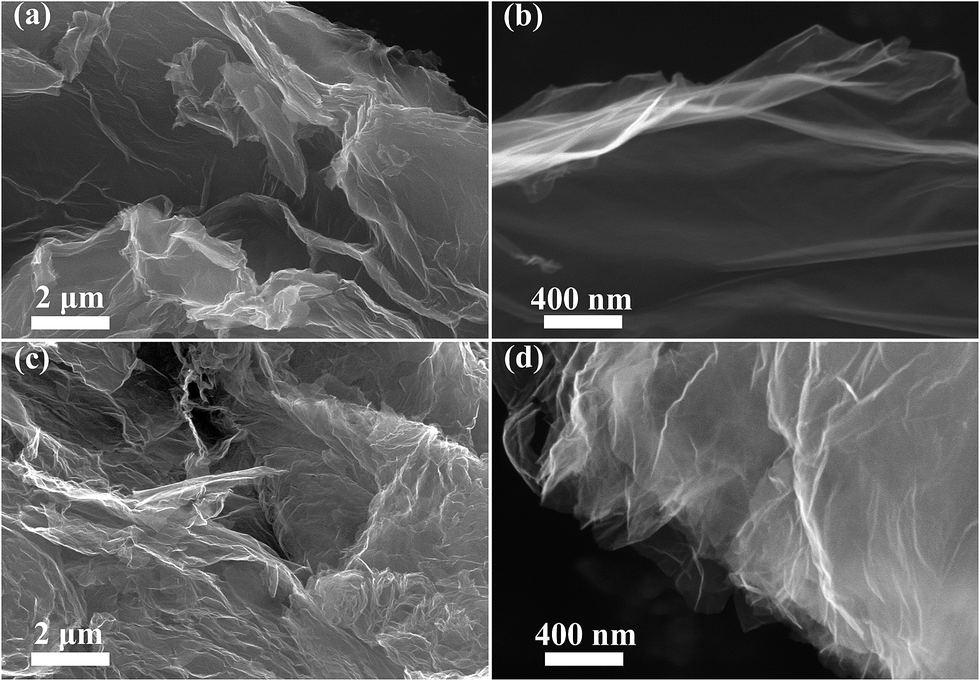 | ||
| Fig. 2 SEM images of (a, b) rGO and (c, d) I-rGO-ii. | ||
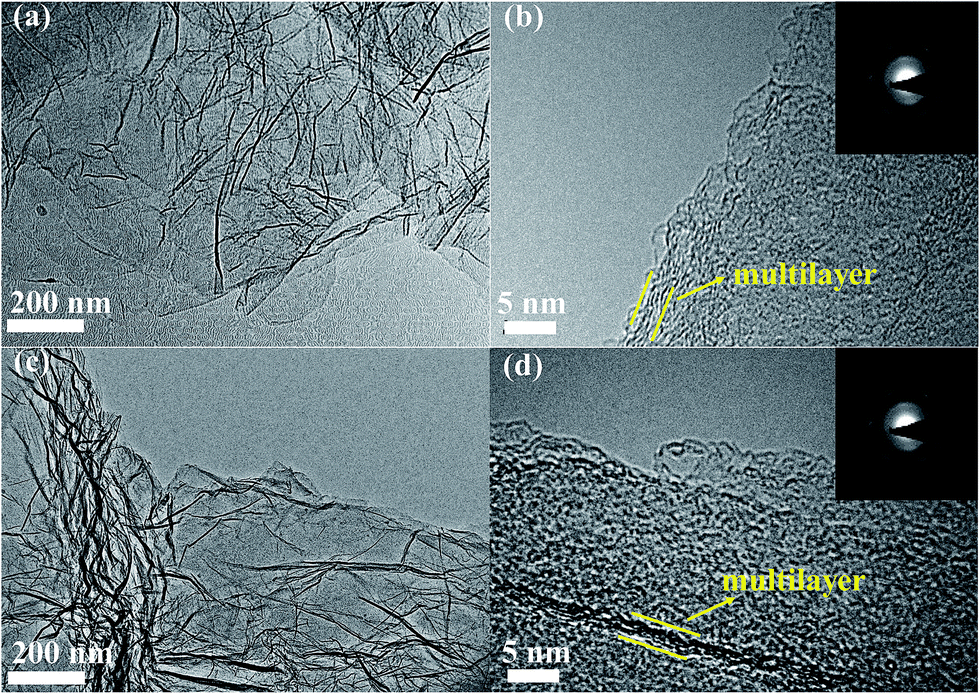 | ||
| Fig. 3 TEM images of (a, b) rGO and (c, d) I-rGO-ii. | ||
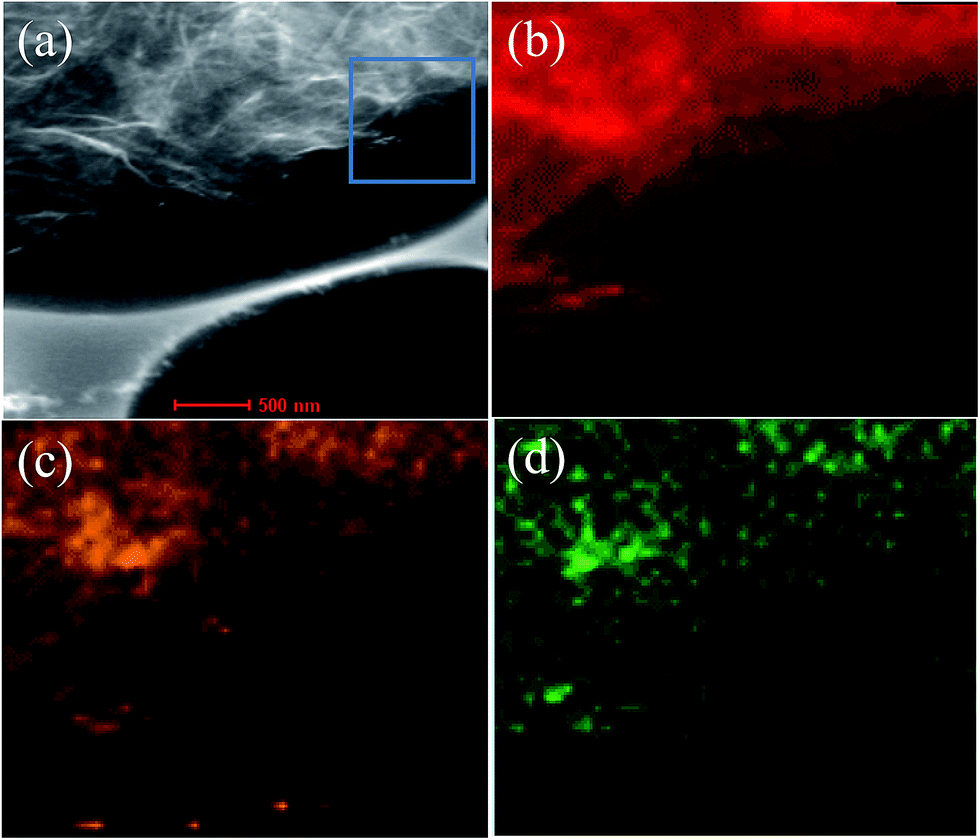 | ||
| Fig. 4 (a) High magnification TEM image of I-rGO-ii; EDS elemental mapping of (b) C, (c) O and (d) I. | ||
As shown in Fig. 5a. A peak at 2θ = 26.55° is observed for rGO, corresponding to the characteristic (002) plane, with an interlayer spacing of 0.334 nm. After doping, the (002) peak obviously shifts to 2θ = 25.67°. The shift of the (002) peak caused by iodine doping with an increased interlayer gap of 0.350 nm. These results are consistent with the HRTEM results. After iodine doping, the (002) peak obviously shifts to 2θ = 25.67°. The shift of the (002) peak is caused by iodine doping. These results are consistent with the HRTEM results, and the interlayer space is larger than that of N-doped graphene (0.340 nm)43 and N-doped graphene foams (0.342 nm).31 The increased interlayer spacing of iodine doped graphene will facilitate insertion/extraction of sodium with larger radius. The increased interlayer spacing will facilitate sodium insertion/extraction with larger radius.
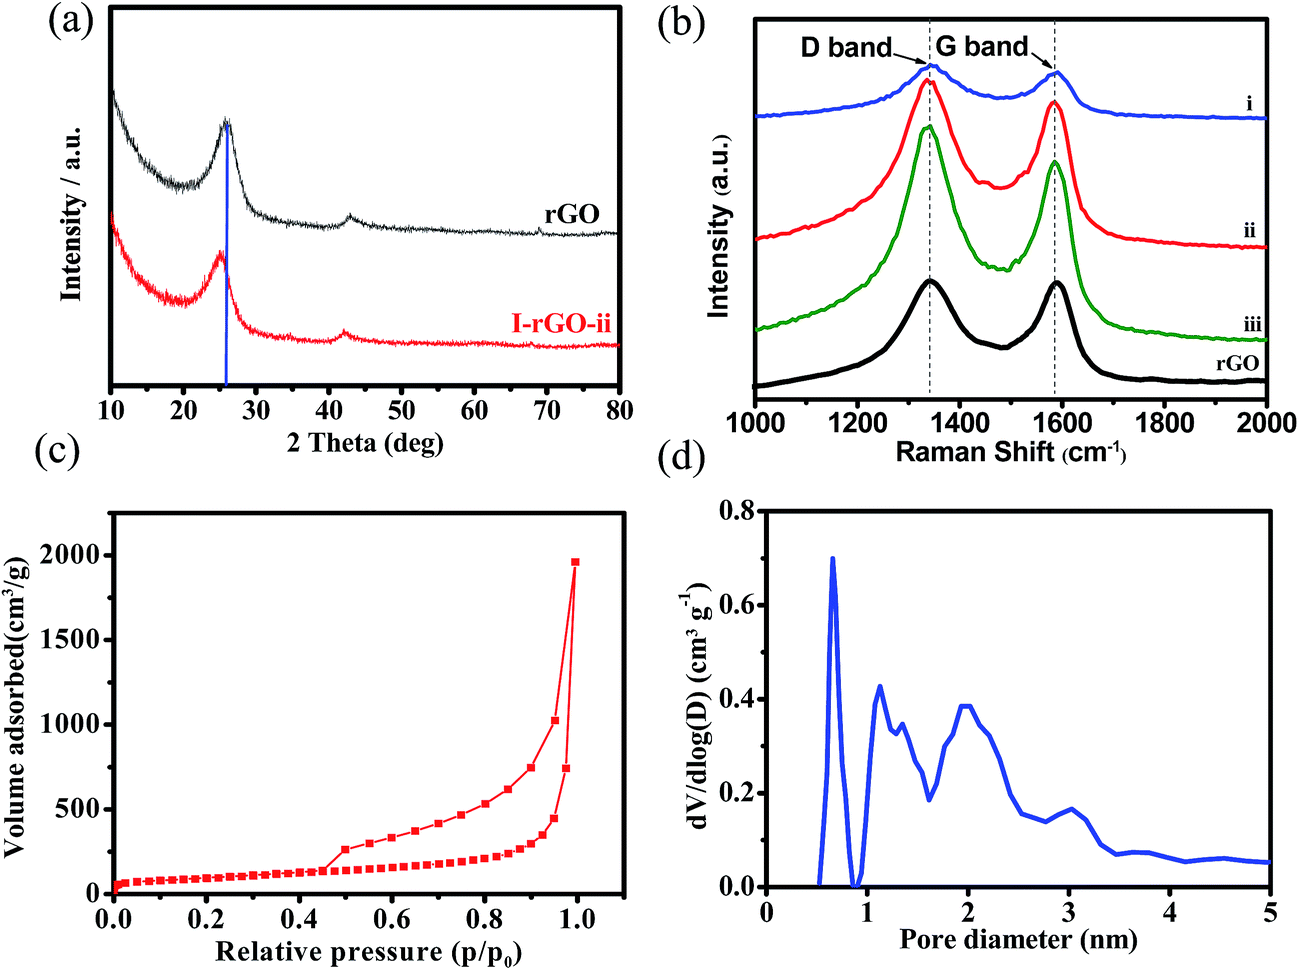 | ||
| Fig. 5 (a) XRD spectra and (b) Raman spectra of rGO, I-rGO-i, I-rGO-ii and I-rGO-iii; (c) nitrogen adsorption/desorption isotherms and (d) pore size distribution of I-rGO-ii. | ||
Raman is a significant technique to characterize the degree of structural defects. As shown in Fig. 5b, both of rGO and I-rGO shows two obvious peaks, corresponding to D band (∼1356 cm−1) and G band (∼1595 cm−1).47 The ID/IG values of the rGO and I-rGO-ii are 1.63 and 1.90, respectively. Compared with the rGO, an obvious increase of the D band exists in both I-rGO and N-rGO. The intensity ratio (ID/IG) of I-rGO and N-rGO are 1.90 and 1.75, respectively, which are higher than that of pristine graphene (1.63), indicating that more defects are introduced by the dopant. Compared with the ID/IG value of S/N-doped graphene (1.53),30 the I-doped graphene shows higher ID/IG value (1.90), indicating that more structural defects and edge plane exposures result from the introduction of iodine into graphene sheets. As shown in Fig. 5b, upon increasing the mass of iodine, the I-rGO samples (I-rGO-i: 1.86, I-rGO-ii: 1.90 and I-rGO-iii: 1.92) exhibit similar ID/IG ratios, revealing similar structure disorders. Fig. 5c presents the N2 adsorption–desorption isotherms belonging to a type IV with a distinct hysteresis loop in the p/p0 region of 0.10–0.99. The specific surface area of I-rGO is up to 359.3 m2 g−1. The pore size distribution curve (Fig. 5d) from the Barrett–Joyner–Halenda (BJH) model shows a strong peak at around 0.8 nm and wide peaks at around 1–3 nm. The I-rGO reveals microporous characteristic, which benefits the ion diffusion and enhances utilization of active materials in SIBs.
X-ray photoelectron spectroscopy (XPS) was conducted to further investigate the chemical composition of the samples, and the presence of I atoms are displayed in Table 1, the contents of I atoms are about 0.09% (I-rGO-i), 0.2% (I-rGO-ii) and 0.87% (I-rGO-iii). The chemical composition of the I-rGO is further confirmed by EDX analysis, and the results are presented in Table S2,† the iodine amount is close with the XPS results. As shown in Fig. 6, the C 1s (∼284.9 eV) and O 1s (∼533.5 eV) peaks are clearly observed in the XPS survey spectra of I-rGO, and the iodine peak can be observed at 619.2 eV for iodine 3d. In Fig. 6b, the high-resolution XPS spectrum shows that I 3d peaks are centered at 618.8 and 631.2 eV, assigned to iodine 3d5/2 and iodine 3d3/2, respectively. From the XPS results, the existence of iodine in the I-rGO is in the form of I3−1 and I5−1. As presented in Fig. 1, I3−1 and I5−1 may homogeneously absorbed on the surface of rGO in the presence of oxygen-containing groups (e.g. –OH), as reported in previous works.48,49 The formation of I3−1 and I5−1 during the doping process can induce positive charge density on the surface of graphene, which will facilitate fast transport of Na ion, leading to better rate performance even at high current densities. These results show that iodine atoms are doped into rGO nanosheets. In Fig. 6c, a high-resolution C 1s spectrum reveals that the carbon bonding is composed of C–C/C![[double bond, length as m-dash]](https://www.rsc.org/images/entities/char_e001.gif) C, C–OH and CO groups, the sharp C–C/CC peak reveals that most of the oxygen groups are removed. The residual oxygen groups were further confirmed by the O 1s spectrum, as shown in Fig. 6d. FT-IR spectroscopy can be used to study the surface functional groups of the rGO and I-rGO. As shown in Fig. S1,† it shows some strong peaks corresponding to the oxygen-containing groups.21,50
C, C–OH and CO groups, the sharp C–C/CC peak reveals that most of the oxygen groups are removed. The residual oxygen groups were further confirmed by the O 1s spectrum, as shown in Fig. 6d. FT-IR spectroscopy can be used to study the surface functional groups of the rGO and I-rGO. As shown in Fig. S1,† it shows some strong peaks corresponding to the oxygen-containing groups.21,50
| Samples | C | O | I |
|---|---|---|---|
| I-rGO-i | 96.90% | 3.01% | 0.09% |
| I-rGO-ii | 96.56% | 3.24% | 0.20% |
| I-rGO-iii | 95.41% | 3.72% | 0.87% |
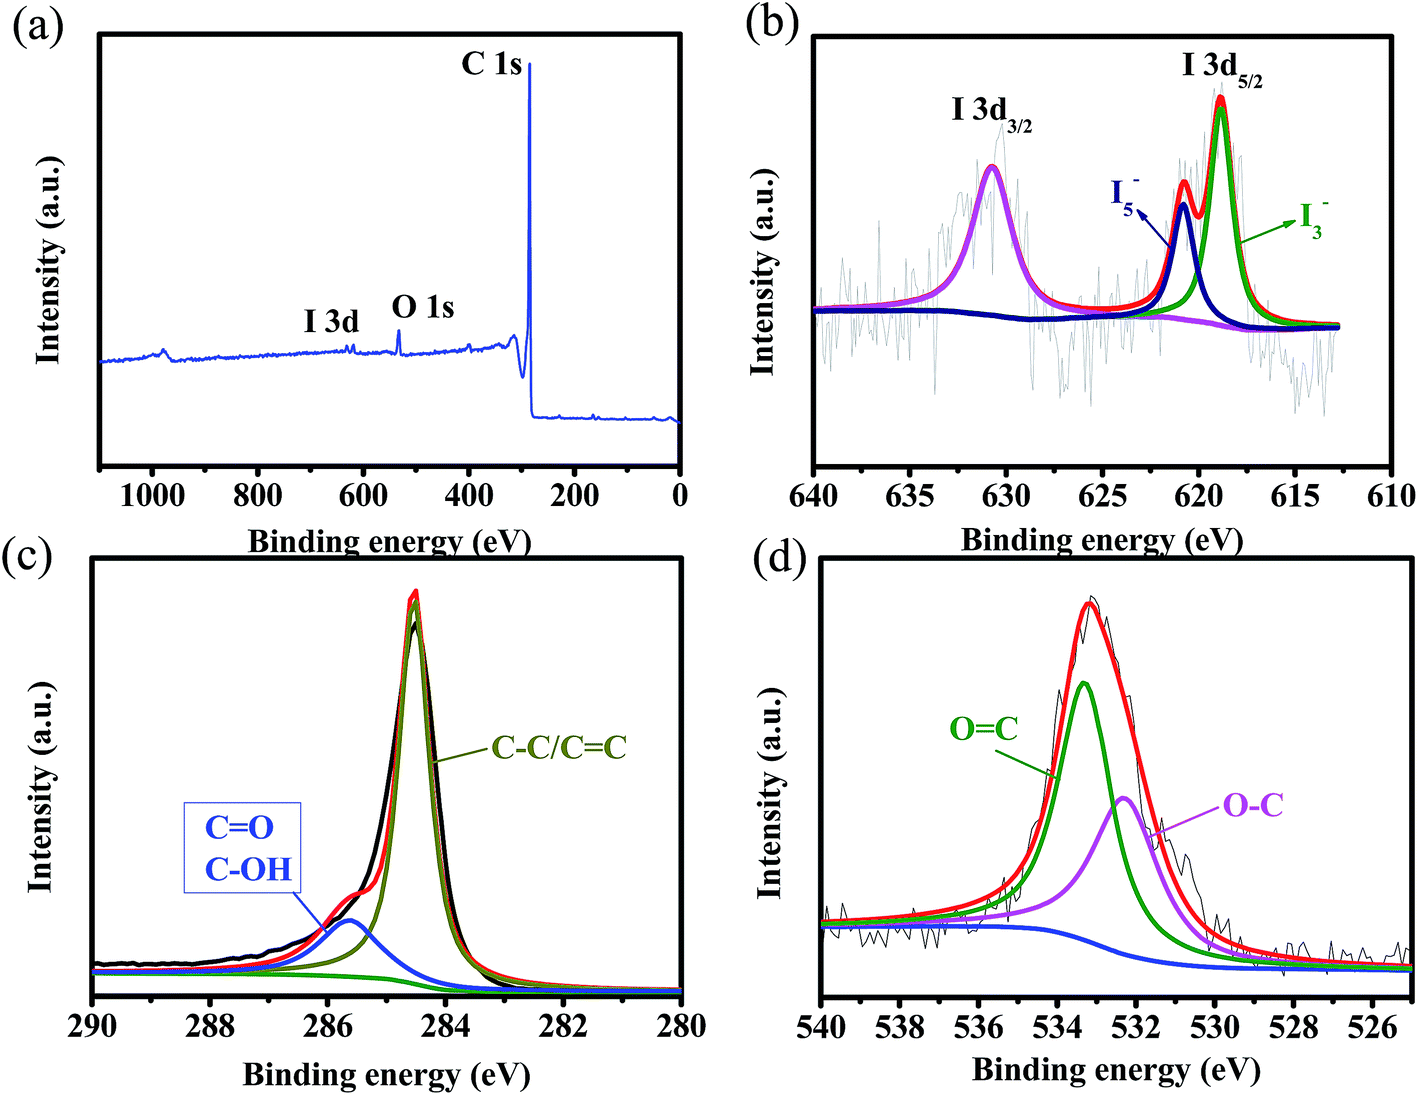 | ||
| Fig. 6 (a) Survey spectrum of I-rGO-ii. High resolution (b) I 3d, (c) C 1s and (d) O 1s XPS spectra of I-rGO-ii. | ||
The Na+ storage performance of the I-rGO and rGO is investigated by cyclic voltammetry (CV) in a voltage range of 0.01–3 V (vs. Na+/Na). As shown in Fig. 7a and b, both I-rGO and rGO show similar CV behaviors in the initial five scans. In the first CV curve of rGO, the two reduction peaks at around 1.1 and 0.5 V may originate from the electrolyte decomposition and solid electrolyte interface (SEI) film formation. These two reduction peaks disappear in the other cycles reveals irreversibility of SEI formation in the initial cycle.51 As for I-rGO, the larger peak intensity at ∼1.1 V may be due to the iodine doping, which introduce more defects to react with sodium ions. Notably, the subsequent CV curves almost overlap for both I-rGO and rGO electrodes, indicating the good reversibility towards sodium ion insertion/extraction. In comparison to rGO (Fig. 7c), the I-rGO-ii delivers an initial higher discharge capacity of 800 mA h−1 at a current density of 50 mA g−1 (Fig. 7d). Obviously, a high capacity loss of both samples is displayed in the first cycle due to the SEI film formation.28 I-rGO reveals higher electrochemical activity with higher capacity. Fig. 7e compares the cycling performance of rGO, I-rGO-i, I-rGO-ii and I-rGO-iii electrodes for 100 cycles at a current density of 50 mA g−1. All electrodes reveal large irreversible capacities in the first cycle. As previously reported, graphene-based anodes could be attributed to the inevitable formation of the SEI layer caused by electrolyte decomposition and the irreversible reaction. More importantly, all doped electrodes exhibit higher discharge capacity than that of rGO during cycling, and I-rGO-ii shows higher coulombic efficiency than rGO, indicating the superiority of I-rGO for SIBs. After 100 cycles, rGO delivers the discharge capacity of 108.1 mA h g−1, while the discharge capacities of I-rGO-i, I-rGO-ii and I-rGO-iii are 190, 212 and 167 mA h g−1, respectively. Therefore the I-rGO-ii with 0.2% of iodine content shows the best performance. The rate capabilities of the rGO, I-rGO-i, I-rGO-ii and I-rGO-iii electrodes are shown in Fig. 7f. The rGO delivers the reversible capacities of 150, 122, 96, and 77 mA h g−1 at various current densities of 50, 100, 200, and 500 mA g−1, respectively. By contrast, I-rGO-ii exhibits superior rate performance with reversible capacities of 275, 201, 185, and 148 mA h g−1 at current densities of 50, 100, 200 and 500 mA g−1, respectively. Obviously, I-rGO-ii delivers higher rate capability than other samples at different current densities. These results reveal that a moderate I-doping may efficient enhance the Na storage performance. The enhanced electrochemical performance of I-rGO may originate from the expanded d-spacing of rGO by the inlet of iodine. Furthermore, the I3−1 and I5−1 of I-rGO may cause positive charge density on the surface of rGO, which promotes fast transport of sodium ions. In this work, it is obvious that I-doping behavior significantly enhanced the sodium storage performance of graphene, although the battery performance of I-rGO displays less advantages than some of the reported doped graphene, as shown in Table S1.† The strategy of simple heat treatment and the investigation of iodine doping with rare attentions will provide new opportunities for exploiting graphene-based materials with high performance in energy storage applications. Electrochemical impedance spectroscopy (EIS) was carried out after 5 cycles to further understand the kinetic behavior of the electrodes (Fig. S2†). All samples display two parts including a semicircle in the high frequency range and a slope line in the low frequency range. The semicircle in the high frequency range and a slope line in the low frequency are related to the charge transfer resistance (Rct) and Warburg resistance. Obviously, the semicircle of rGO in the high frequency is higher than other I-doped samples, indicating that I-doping can efficiently reduce the charge-transfer resistance of graphene materials. According to the fitting parameters based on an equivalent circuit, the I-rGO-ii shows lower Rct (220.4 Ω) than rGO (490.8 Ω), I-rGO-i (250.2 Ω), and I-rGO-iii (265.2 Ω). The fast charge transfer within the I-rGO-ii will result in higher capacity and better rate capability.
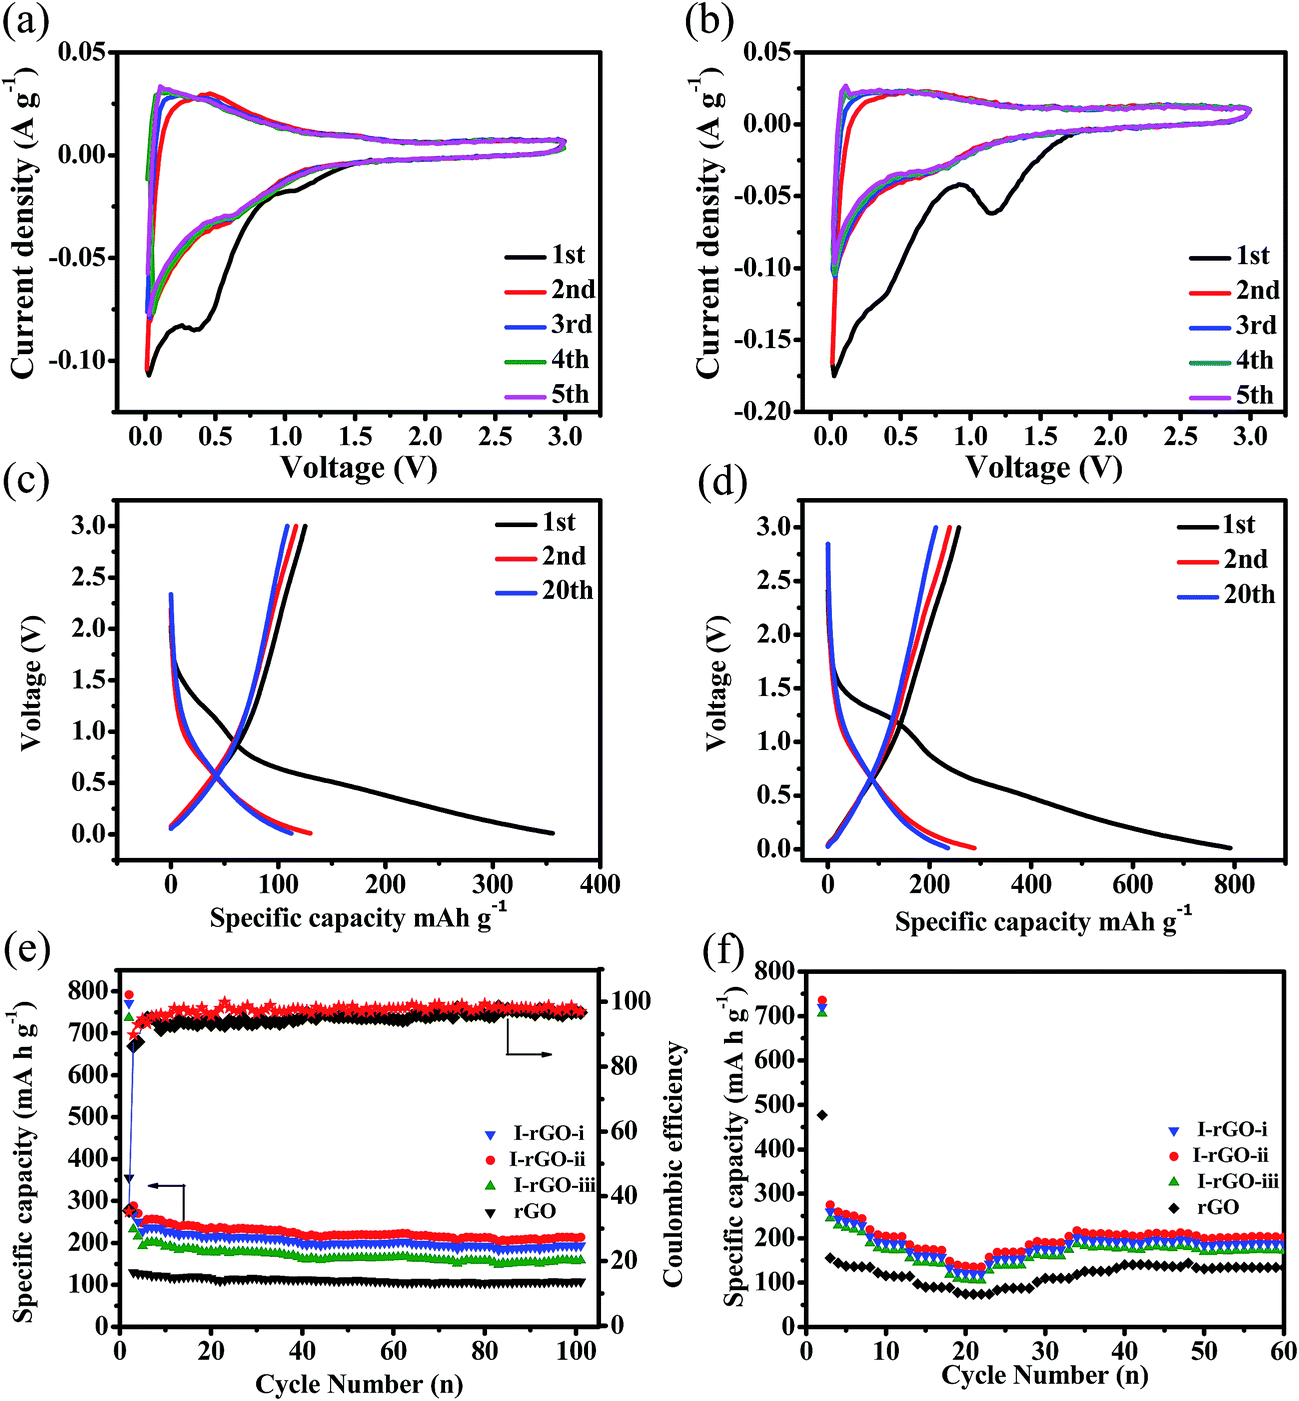 | ||
| Fig. 7 Cyclic voltammograms of (a) rGO and (b) I-rGO-ii at a scan rate of 0.1 mV s−1; the galvanostatic charge/discharge profiles of (c) rGO and (d) I-rGO-ii; (e) cycling performance and (f) rate capability of rGO, I-rGO-i, I-rGO-ii and I-rGO-iii. | ||
The enhanced electrochemical performance of I-rGO may originate from the expanded d-spacing of rGO by the inlet of iodine. Furthermore, the I3−1 and I5−1 of I-rGO may cause positive charge density on the surface of rGO, which promotes fast transport of Na ions.43 The improvement performance is also due to the corrosive characteristic of iodine that can help to react with and remove absorbed atoms from the graphene surface.49 As far as we know, this work is the first time to design I-doped graphene as anode material for SIBs. The design of I-rGO is more complicated because the iodine atomic radius is larger than that of carbon and other heteroatoms (e.g. N, B and S) and the doping refers to complex surface charge transfer.37,38,45 During the doping process, the I3−1 and I5−1 can induce positive charge density on graphene surface and promote rapid transport of sodium ions.42
4. Conclusions
In summary, we for the first time demonstrate that the I-doping behavior in rGO may improve the electrochemical performance of graphene anode for SIBs. I-doping enlarges the d-spacing of rGO, and some defects are constructed. More importantly, positive charge density is introduced to the surface of rGO. As a result, I-doped rGO leads to more abundant Na ion storage, fast electron transport and Na ion diffusion compared to the rGO. Moreover, I-rGO exhibits better rate capability and cycling performance than the rGO. Therefore, this work demonstrates that the iodine-doped rGO may be regarded as an ideal anode material for sodium ion batteries.Conflicts of interest
There are no conflicts to declare.Acknowledgements
This research was supported by the National Natural Science Foundation of China (51572194 and 51672189), Academic Innovation Funding of Tianjin Normal University (52XC1404), and Training Plan of Leader Talent of University in Tianjin.References
- X. Wang, K. Cao, Y. Wang and L. Jiao, Small, 2017, 13, 1700873 CrossRef PubMed.
- J. Chen, S. Li, V. Kumar and P. S. Lee, Adv. Energy Mater., 2017, 7, 1700180 CrossRef.
- P. G. Bruce, B. Scrosati and J. M. Tarascon, Angew. Chem., 2008, 47, 2930–2946 CrossRef CAS PubMed.
- K. Xu, Chem. Rev., 2014, 114, 11503–11618 CrossRef CAS PubMed.
- H. Wang, T. Maiyalagan and X. Wang, ACS Catal., 2012, 2, 781–794 CrossRef CAS.
- Y. Zhai, Y. Dou, D. Zhao, P. F. Fulvio, R. T. Mayes and S. Dai, Adv. Mater., 2011, 23, 4828–4850 CrossRef CAS PubMed.
- G. Ye, X. Zhu, S. Chen, D. Li, Y. Yin, Y. Lu, S. Komarneni and D. Yang, J. Mater. Chem. A, 2017, 5, 8247–8254 CAS.
- Y. Wen, K. He, Y. Zhu, F. Han, Y. Xu, I. Matsuda, Y. Ishii, J. Cumings and C. Wang, Nat. Commun., 2014, 5, 4033 CAS.
- H. Hou, C. E. Banks, M. Jing, Y. Zhang and X. Ji, Adv. Mater., 2015, 27, 7861–7866 CrossRef CAS PubMed.
- T. Chen, L. Pan, T. Lu, C. Fu, D. H. C. Chua and Z. Sun, J. Mater. Chem. A, 2014, 2, 1263–1267 CAS.
- X.-F. Luo, C.-H. Yang, Y.-Y. Peng, N.-W. Pu, M.-D. Ger, C.-T. Hsieh and J.-K. Chang, J. Mater. Chem. A, 2015, 3, 10320–10326 CAS.
- Z. Yuan, L. Si and X. Zhu, J. Mater. Chem. A, 2015, 3, 23403–23411 CAS.
- M. S. Whittingham, Chem. Rev., 2014, 114, 11414–11443 CrossRef CAS PubMed.
- X. Li, Y. Hu, J. Liu, A. Lushington, R. Li and X. Sun, Nanoscale, 2013, 5, 12607–12615 RSC.
- X. Li, J. Yu, S. Wageh, A. A. Al-Ghamdi and J. Xie, Small, 2016, 12, 6640–6696 CrossRef CAS PubMed.
- L. Ji, P. Meduri, V. Agubra, X. Xiao and M. Alcoutlabi, Adv. Energy Mater., 2016, 6, 1502159 CrossRef.
- Z. Niu, J. Chen, H. H. Hng, J. Ma and X. Chen, Adv. Mater., 2012, 24, 4144–4150 CrossRef CAS PubMed.
- Y.-Z. Liu, Y.-F. Li, F.-Y. Su, L.-J. Xie, Q.-Q. Kong, X.-M. Li, J.-G. Gao and C.-M. Chen, Energy Storage Materials, 2016, 2, 69–75 CrossRef.
- C. Liu, Z. Yu, D. Neff, A. Zhamu and B. Z. Jang, Nano Lett., 2010, 10, 4863–4868 CrossRef CAS PubMed.
- D. Xiong, X. Li, H. Shan, B. Yan, L. Dong, Y. Cao and D. Li, J. Mater. Chem. A, 2015, 3, 11376–11386 CAS.
- D. Xiong, X. Li, H. Shan, B. Yan, D. Li, C. Langford and X. Sun, Appl. Energy, 2016, 175, 512–521 CrossRef CAS.
- L. Fan, X. Li, Y. Cui, H. Xu, X. Zhang, D. Xiong, B. Yan, Y. Wang and D. Li, Electrochim. Acta, 2015, 176, 610–619 CrossRef CAS.
- Z. Wu, X. Li, L. Tai, H. Song, Y. Zhang, B. Yan, L. Fan, H. Shan and D. Li, J. Alloys Compd., 2015, 646, 1009–1014 CrossRef CAS.
- X. Xie, Z. Ao, D. Su, J. Zhang and G. Wang, Adv. Funct. Mater., 2015, 25, 1393–1403 CrossRef CAS.
- Y. Yan, Y.-X. Yin, Y.-G. Guo and L.-J. Wan, Adv. Energy Mater., 2014, 4, 1301584 CrossRef.
- Y. Zhao, X. Li, B. Yan, D. Li, S. Lawes and X. Sun, J. Power Sources, 2015, 274, 869–884 CrossRef CAS.
- G. Zhou, S. Pei, L. Li, D. W. Wang, S. Wang, K. Huang, L. C. Yin, F. Li and H. M. Cheng, Adv. Mater., 2014, 26, 625–631 CrossRef CAS PubMed.
- Y.-X. Wang, S.-L. Chou, H.-K. Liu and S.-X. Dou, Carbon, 2013, 57, 202–208 CrossRef CAS.
- I. T. Kim, M. J. Song, Y. B. Kim and M. W. Shin, Int. J. Hydrogen Energy, 2016, 41, 22026–22033 CrossRef CAS.
- H. Shan, X. Li, Y. Cui, D. Xiong, B. Yan, D. Li, A. Lushington and X. Sun, Electrochim. Acta, 2016, 205, 188–197 CrossRef CAS.
- J. Xu, M. Wang, N. P. Wickramaratne, M. Jaroniec, S. Dou and L. Dai, Adv. Mater., 2015, 27, 2042–2048 CrossRef CAS PubMed.
- J. Zhang, C. Li, Z. Peng, Y. Liu, J. Zhang, Z. Liu and D. Li, Sci. Rep., 2017, 7, 4886 CrossRef PubMed.
- G. Ma, K. Huang, Q. Zhuang and Z. Ju, Mater. Lett., 2016, 174, 221–225 CrossRef CAS.
- H. An, Y. Li, Y. Gao, C. Cao, J. Han, Y. Feng and W. Feng, Carbon, 2017, 116, 338–346 CrossRef CAS.
- D. Li, H. Chen, G. Liu, M. Wei, L.-x. Ding, S. Wang and H. Wang, Carbon, 2015, 94, 888–894 CrossRef CAS.
- H. G. Wang, Z. Wu, F. L. Meng, D. L. Ma, X. L. Huang, L. M. Wang and X. B. Zhang, ChemSusChem, 2013, 6, 56–60 CrossRef CAS PubMed.
- D. Xu, C. Chen, J. Xie, B. Zhang, L. Miao, J. Cai, Y. Huang and L. Zhang, Adv. Energy Mater., 2016, 6, 1501929 CrossRef.
- J. Zhu, C. Chen, Y. Lu, Y. Ge, H. Jiang, K. Fu and X. Zhang, Carbon, 2015, 94, 189–195 CrossRef CAS.
- G. Kalita, K. Wakita, M. Takahashi and M. Umeno, J. Mater. Chem., 2011, 21, 15209 RSC.
- J. Wang, B. Li, T. Ni, T. Dai and Y. Lu, Compos. Sci. Technol., 2015, 109, 12–17 CrossRef CAS.
- Z. Wu, Y. Han, R. Huang, X. Chen, Y. Guo, Y. He, W. Li, Y. Cai and N. Wang, Nanoscale, 2014, 6, 13196–13202 RSC.
- Y. Zhan, B. Zhang, L. Cao, X. Wu, Z. Lin, X. Yu, X. Zhang, D. Zeng, F. Xie, W. Zhang, J. Chen and H. Meng, Carbon, 2015, 94, 1–8 CrossRef CAS.
- Y. Zhan, J. Huang, Z. Lin, X. Yu, D. Zeng, X. Zhang, F. Xie, W. Zhang, J. Chen and H. Meng, Carbon, 2015, 95, 930–939 CrossRef CAS.
- Z. Yao, H. Nie, Z. Yang, X. Zhou, Z. Liu and S. Huang, Chem. Commun., 2012, 48, 1027–1029 RSC.
- J. Sforzini, P. Hapala, M. Franke, G. van Straaten, A. Stohr, S. Link, S. Soubatch, P. Jelinek, T. L. Lee, U. Starke, M. Svec, F. C. Bocquet and F. S. Tautz, Phys. Rev. Lett., 2016, 116, 126805 CrossRef CAS PubMed.
- L. Fan, X. Li, B. Yan, J. Feng, D. Xiong, D. Li, L. Gu, Y. Wen, S. Lawes and X. Sun, Adv. Energy Mater., 2016, 6, 1502057 CrossRef.
- H. Shan, D. Xiong, X. Li, Y. Sun, B. Yan, D. Li, S. Lawes, Y. Cui and X. Sun, Appl. Surf. Sci., 2016, 364, 651–659 CrossRef CAS.
- C. Chen, M. Wu, S. Wang, J. Yang, J. Qin, Z. Peng, T. Feng and F. Gong, RSC Adv., 2017, 7, 38639–38646 RSC.
- J. Chen, C. Wu, C. Tang, W. Zhao, M. Xu and C. M. Li, ChemistrySelect, 2017, 2, 5518–5523 CrossRef CAS.
- D. Xiong, X. Li, Z. Bai, H. Shan, L. Fan, C. Wu, D. Li and S. Lu, ACS Appl. Mater. Interfaces, 2017, 9, 10643–10651 CAS.
- F. Yang, Z. Zhang, K. Du, X. Zhao, W. Chen, Y. Lai and J. Li, Carbon, 2015, 91, 88–95 CrossRef CAS.
Footnote |
| † Electronic supplementary information (ESI) available. See DOI: 10.1039/c7ra09349g |
| This journal is © The Royal Society of Chemistry 2017 |