 Open Access Article
Creative Commons Attribution 3.0 Unported Licence
Highly transparent and flame-retardant epoxy composites based on a hybrid multi-element containing POSS derivative†
Cheng Liu ,
Ting Chen,
Conghui Yuan
 ,
Ying Chang,
Guorong Chen,
Birong Zeng
 ,
Yiting Xu,
Weiang Luo and
Lizong Dai
 *
*
Fujian Provincial Key Laboratory of Fire Retardant Materials, College of Materials, Xiamen University, Xiamen 361005, People's Republic of China. E-mail: lzdai@xmu.edu.cn
First published on 28th September 2017
Abstract
The development of a multi-element synergistic flame-retardant depends largely on the design and synthesis of flame-retardants comprising a mixture of elements such as P, N and Si. Herein, we prepare a novel POSS derivative named octa-(N,N-(bis-(9,10-dihydro-9-oxa-10-phosphaphenanthene-10-yl)methyl)aminopropyl) silsesquioxane (ODMAS) that features a high content of P. The chemical structure of ODMAS was confirmed by FT-IR, 1H NMR, 29Si NMR, 31P NMR and elemental analysis. Because of the excellent compatibility between ODMAS and epoxy resin, the as-prepared ODMAS/EP composites are highly transparent as well as possessing improved flame-retardancy and mechanical properties. The results show that the LOI value reaches 37.1% with a low phosphorus content (1.6 wt%), samples only 5 wt% loading are classified with the V0 rating in the UL-94 test, and the char yield significantly increased and the maximum weight loss rate decreased with increased ODMAS loading. Results of a three-point bending test show that the flexural modulus of ODMAS/EP is higher than that of the pure epoxy resin. All results indicate that this novel flame retardant not only has good solubility in the polymer matrix, but can also simultaneously improve the flame resistance and mechanical properties of the polymeric material.
Introduction
Epoxy resins possess many advanced properties including high tensile strength and modulus, excellent adhesion to many substrates, low shrinkage on curing, excellent chemical and corrosion resistance as well as good dimensional stability, and have been widely used as structural adhesives, coatings, and advanced composite materials in the applications of aerospace and electronic industries.1–4 Nonetheless, these applications normally require high flame resistance and therefore the development of flame retardant epoxy resins has attracted intense attention. During the past decades, many flame retardants such as layered double hydroxides,5,6 graphene,7 halogen containing compounds,8,9 phosphorus containing compounds,10,11 nitrogen containing compounds12 and silicon containing compounds,13 and so on, have been adopted to modify the epoxy resin. Since halogen flame retardants have a detrimental effect on the environment and human health during burning,14,15 halogen-free flame retardants are highly desirable.In recent years, design of multi-element flame-retardants has become a representative strategy to achieve high flame resistance.16–20 It has been reported that a significant improvement in flame-retardant efficiency can be achieved when synergistically introducing P, N and Si into the polymer matrix.21 The combination of two or more flame retardant elements provides a simple approach for reducing the amount of flame retardants while increasing the flame resistance of epoxy resins. 9,10-dihydro-9-oxa-10-phosphaphenanthrene-10-oxide (DOPO) and its derivatives are a kind of widely used phosphorus containing flame retardants, which have shown excellent flame resistance for epoxy resins.22 Several reports have indicated that modification of DOPO with other flame-retardant elements can further increase their flame-retardant efficiency.23–25 Polyhedral oligomeric silsesquioxane (POSS), a typical silicon-containing flame retardant, can significantly increase the char yields and then reduce the flammability of polymeric materials through the formation of Si–O–Si structure.26,27 Flame retardants which synthesized by chemically connecting DOPO and POSS show a good flame resistance for epoxy resin, and the DOPO–POSS/epoxy composites display a blowing-out extinguishing effect.28,29 Nevertheless, most of the POSS derivatives have a poor compatibility with epoxy matrix, and the as-obtained composite materials exhibit poor transparency and mechanical property.
Recently, we fabricated a surfactant-like flame retardant containing both DOPO and POSS, to improve its affinity to epoxy resin.30 Although this flame-retardant can uniformly self-assemble in the epoxy matrix, the as formed nanoscaled aggregates reduce the transparence of the composite materials more or less. Moreover, we envision that the design flame-retardant from combination between DOPO and POSS can be further optimized to improving the content of flame-retardant elements. Herein, we synthesize a novel hybrid molecule ODMAS with sixteen DOPO groups linked to one POSS core through a simple Kabachnik–Fields and hydrolytic condensation reaction. ODMAS not only has a high content of P, N and Si elements, but also exhibit a high solubility in epoxy resin. After introducing ODMAS into epoxy resin, the as-obtained composite materials (ODMAS/EP) possess high transparency, excellent flame retardant properties and enhanced mechanical strength.
Results and discussion
Synthesis and structure characterization
ODMAS was synthesized through a Kabachnik–Fields reaction followed by hydrolysis condensation using APTES, POM and DOPO as starting materials (Scheme 1). The chemical structure of ODMAS was characterized by FT-IR and 1H, 29Si, 31P NMR spectroscopy, and the corresponding data are presented in the Experimental section. The FT-IR spectra of APTES, DOPO, and ODMAS are shown in Fig. 1g, h and i. Peaks at 3059 cm−1 and 2926 cm−1 in the FT-IR spectra of both ODMAS and DOPO are attributed to the stretching vibration absorption peak of Ar-H and CH2. In the FT-IR spectrum of ODMAS, the absorbance peak at 2434 cm−1 corresponding to the P–H bond of DOPO disappears, indicating the complete reaction of DOPO. The characteristic peaks at 908 cm−1 (stretching vibration of P–O–Ph) and 1232 cm−1 (stretching vibration of P![[double bond, length as m-dash]](https://www.rsc.org/images/entities/char_e001.gif) O) derived from DOPO can be found in the FT-IR spectrum of ODMAS (Fig. 1i). Meanwhile, the FT-IR spectrum of ODMAS shows strong absorbance peaks at 1072–1116 cm−1, which are ascribed to the asymmetric stretching vibration of Si–O–Si derived from POSS and P–O–Ph of DOPO.31
O) derived from DOPO can be found in the FT-IR spectrum of ODMAS (Fig. 1i). Meanwhile, the FT-IR spectrum of ODMAS shows strong absorbance peaks at 1072–1116 cm−1, which are ascribed to the asymmetric stretching vibration of Si–O–Si derived from POSS and P–O–Ph of DOPO.31
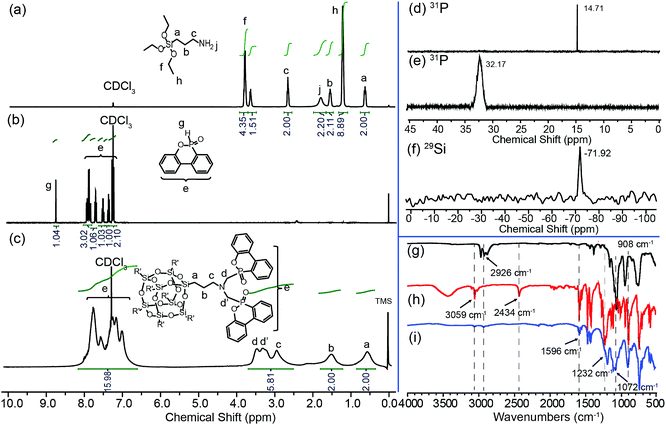 | ||
| Fig. 1 The 1H NMR, 31P, 29Si NMR and FT-IR spectra of APTES (a, g), DOPO (b, d, h) and ODMAS (c, e, f, i). | ||
The 1H, 31P and 29Si NMR spectra of the resultant product and staring materials are displayed in Fig. 1. All protons can be attributed to the expected signals. Compared with the 1H NMR spectra of the two original materials, the signal of P–H at 8.83 ppm in DOPO (Fig. 1b), the signals at 3.77–3.62 ppm and 1.18 ppm assigned to methylene and methyl protons of Si–O–CH2CH3, and the signal of NH2 in APTES at 1.76 ppm (Fig. 1a) disappear in the 1H NMR spectrum of ODMAS. New signals at 3.48–3.32 ppm in the 1H NMR spectrum of ODMAS are assigned to methylene protons (d and d′) in N–CH2–DOPO group (Fig. 1c). In the 31P NMR spectra, ODMAS displays a signal at 32.17 ppm (Fig. 1e), while DOPO itself has a signal at 14.71 ppm (Fig. 1d). The 29Si NMR spectrum of ODMAS displays a single peak at −71.92 ppm (Fig. 1f), implying the single chemical environment of Si atom in ODMAS. These results in combination with the FT-IR data suggest that ODMAS has been successfully synthesized with high purity and yield.
The thermal stability of ODMAS was evaluated by TGA under both air and nitrogen atmospheres. Fig. S2† shows the TGA and derivative thermogravimetric (DTG) curves, and the corresponding data of which are summarized in Table 2. The initial decomposition temperature (Td) which is defined as the temperature for 5 wt% weight loss (T5), Tmax is defined as the temperature for maximum weight loss rate. The Td of ODMAS under air atmospheres is about 301 °C and the Tmax1 and Tmax2 are about 324 °C and 505 °C, respectively, which are higher than the cured temperature of epoxy. Thus, ODMAS is probably stable during the curing process of epoxy. Moreover, the residual char of ODMAS at 800 °C is 23.28%, which can improve the char yield of the modified epoxy.
The morphology characterization of the composites
Since the compatibility of flame retardant in epoxy matrix greatly affects thermal, mechanical and optical properties of the composites materials, much effort have been focused on designing of flame retardants with high affinity to epoxy resin. The high solubility of DOPO in epoxy resin has been verified by many reports.19,32 Our previous work also demonstrated that DOPO possesses a high affinity with DGEBA, while POSS–NH2 has a poor solubility in DGEBA. Importantly, we have found that a flame retardant prepared by the incorporation of DOPO onto POSS has an enhanced compatibility with DGEBA.30 Therefore, we expect that ODMAS with sixteen DOPO groups attached on a POSS cage may has excellent solubility in DGEBA. Fig. 2a gives the photos of neat epoxy resin and ODMAS/EP composites. Obviously, the addition of ODMAS has no evident impact on the transparency of epoxy resin. The light transmittances of the samples were studied by UV-vis spectrophotometer. As shown in Fig. 2b, like the neat epoxy, the ODMAS/EP composites exhibit high optical transparency. For example, at 600 nm UV irradiation, the transmittance of the samples containing 1 wt%, 5 wt%, 10 wt% and 15 wt% of ODMAS are 89.2%, 89.1%, 84.5% and 81.2%, respectively, as compared to 91.7% for neat epoxy. These results give the first indication that ODMAS were completely dissolved in DGEBA.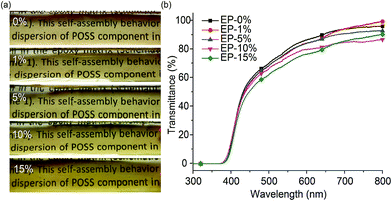 | ||
| Fig. 2 Photographs (a) and UV-vis light transmittances (b) of cured epoxy composites with different ODMAS contents. | ||
SEM and TEM images of the fractures of the samples were taken to further understand the solubility of ODMAS in epoxy resin. Samples were frozen in liquid nitrogen and then fractured immediately to obtain the fractures which maintaining their original morphologies. As is shown in Fig. 3, EP-0% shows a smooth fracture, indicating a homogeneous structure. Similar morphology without phase separation was also observed in the SEM images of EP-1% and EP-5%, implying the good solubility of ODMAS in DGEBA. A further increase in the content (10% and 15%) of ODMAS caused a slight roughness of the fracture surface. We then used DCM to etch the fracture to verify whether ODMAS form aggregates in the epoxy matrix. As expected, the fracture surface is still smooth (Fig. 3 EP-15%'), further revealing that ODMAS is dissolvable in epoxy matrix. The morphologies of ODMAS in epoxy matrix were also observed directly by TEM. As shown in Fig. S3,† TEM images of EP-0% and EP-10% were all homogeneous, and no obvious agglomeration can be observed in EP-10%.
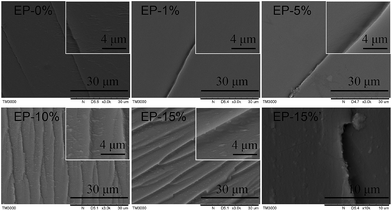 | ||
| Fig. 3 SEM images of the fracture surface of ODMAS/EP composites 0–15% (before etching by DCM) and 15%' (after etching by DCM). | ||
Thermal properties
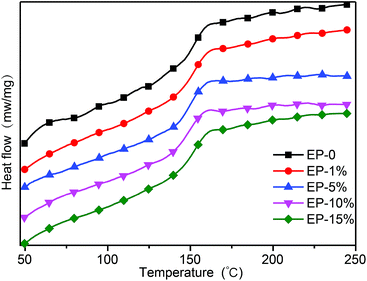
The glass transition temperature (Tg) is an important parameter that determines the applicability of epoxy resin thermosets. Fig. 4 and S4† show the DSC thermograms and DMTA curves, respectively. Table 1 summarizes the sample compositions, flame retardant elements content, as well as the Tg of the final materials measured by DSC and DMTA. The Tg values of ODMAS/EP composites were very close to that of neat epoxy, and decrease slightly with adding of ODMAS (Fig. 4). It is well known that Tg is generally ascribed to the segmental motion of the polymer networks, and the value of Tg is determined by segmental motion freedom, crosslinking density, entanglement constraints and the packing density of the segments.33,34 The increased crosslink density of EP restrained the motion of segment, thus inducing an increased Tg. However, the huge molecular volume of ODMAS can also enlarge the intermolecular space and improved the motion ability of segments, thus resulting in a decrease of Tg. Therefore, the similar Tg of pure epoxy resin and ODMAS/EP is believed to be the co-effect of these two factors ultimately. Also, DMTA can give information on the microstructure of cured epoxy resins. The loss tangent spectrum (tan![[thin space (1/6-em)]](https://www.rsc.org/images/entities/char_2009.gif) δ) curves exhibit a major relaxation as observed in most epoxy resins.35,36 Fig. S4† shows the storage modulus E′ and tan
δ) curves exhibit a major relaxation as observed in most epoxy resins.35,36 Fig. S4† shows the storage modulus E′ and tan![[thin space (1/6-em)]](https://www.rsc.org/images/entities/char_2009.gif) δ of neat epoxy and ODMAS/EP composites. The Tg values of neat epoxy and ODMAS/EP composites were also extracted in terms of the peak temperature of tan
δ of neat epoxy and ODMAS/EP composites. The Tg values of neat epoxy and ODMAS/EP composites were also extracted in terms of the peak temperature of tan![[thin space (1/6-em)]](https://www.rsc.org/images/entities/char_2009.gif) δ–T curves as listed in Table 1. Apparently, the Tg values derived from DMTA have the same evolution trend with that of the DSC results. The thermal stability of neat epoxy as well as the ODMAS/EP composites was investigated by TGA under nitrogen and air atmospheres. The TGA and DTG curves of the epoxy composites are shown in Fig. 5, and the corresponding decomposition data, including T5, Tmax and the char yield at 800 °C are summarized in Table 2. All the samples have a single-step degradation progress under nitrogen atmosphere (Fig. 5a and b) and a two-step degradation progress under air atmosphere (Fig. 5c and d), which are consistent with the results reported in the literature.37 Under nitrogen atmosphere, EP-0% begins to decompose at 355 °C, and reaches the maximum weight loss at 383 °C with a maximum degradation rate 1.44 wt% min−1 and 18.1 wt% residue at 800 °C. However, EP-1% exhibits T5 and Tmax at 349 °C and 378 °C, respectively, which are relatively lower than that of EP-0%. This lower thermal stability can be attributed to the decomposition of ODMAS at a lower temperature (291 °C). Notably, the maximum weight loss rate of EP-1% (1.16 wt% min−1) which is lower than that of EP-0%, while its residue char at 800 °C (18.7 wt%) is higher than that of EP-0%. When the ODMAS contents was increased from 5%, 10% to 15%, the T5, Tmax and the maximum weight loss rate of the ODMAS/EP composites decreases gradually. Moreover, the increase in ODMAS content resulted in an improved residual char at 800 °C, and the increased char gives the first indication for the enhanced flame resistance. The gradual decrease of T5 and Tmax can be primarily attributed to the decomposition of phosphorus group (mainly caused by the weak P–O–C bond of ODMAS).38 Under air atmosphere, the first decomposition process of all samples from EP-0% to EP-15% occurred at around 300 °C, implying their same thermal decomposition pathway. Probably, this is induced by the dehydrogenation and aromatization of alkyl groups.39 The second decomposition step of all the samples occurred at around 570 °C, which could be attributed to the further oxidative degradation of the unstable char layer.35 Moreover, the residual char increases and degradation rate reduces with the increasing ODMAS load. All these results further reveal that ODMAS can enhance flame resistance.
δ–T curves as listed in Table 1. Apparently, the Tg values derived from DMTA have the same evolution trend with that of the DSC results. The thermal stability of neat epoxy as well as the ODMAS/EP composites was investigated by TGA under nitrogen and air atmospheres. The TGA and DTG curves of the epoxy composites are shown in Fig. 5, and the corresponding decomposition data, including T5, Tmax and the char yield at 800 °C are summarized in Table 2. All the samples have a single-step degradation progress under nitrogen atmosphere (Fig. 5a and b) and a two-step degradation progress under air atmosphere (Fig. 5c and d), which are consistent with the results reported in the literature.37 Under nitrogen atmosphere, EP-0% begins to decompose at 355 °C, and reaches the maximum weight loss at 383 °C with a maximum degradation rate 1.44 wt% min−1 and 18.1 wt% residue at 800 °C. However, EP-1% exhibits T5 and Tmax at 349 °C and 378 °C, respectively, which are relatively lower than that of EP-0%. This lower thermal stability can be attributed to the decomposition of ODMAS at a lower temperature (291 °C). Notably, the maximum weight loss rate of EP-1% (1.16 wt% min−1) which is lower than that of EP-0%, while its residue char at 800 °C (18.7 wt%) is higher than that of EP-0%. When the ODMAS contents was increased from 5%, 10% to 15%, the T5, Tmax and the maximum weight loss rate of the ODMAS/EP composites decreases gradually. Moreover, the increase in ODMAS content resulted in an improved residual char at 800 °C, and the increased char gives the first indication for the enhanced flame resistance. The gradual decrease of T5 and Tmax can be primarily attributed to the decomposition of phosphorus group (mainly caused by the weak P–O–C bond of ODMAS).38 Under air atmosphere, the first decomposition process of all samples from EP-0% to EP-15% occurred at around 300 °C, implying their same thermal decomposition pathway. Probably, this is induced by the dehydrogenation and aromatization of alkyl groups.39 The second decomposition step of all the samples occurred at around 570 °C, which could be attributed to the further oxidative degradation of the unstable char layer.35 Moreover, the residual char increases and degradation rate reduces with the increasing ODMAS load. All these results further reveal that ODMAS can enhance flame resistance.
| Samples | DGEBA + DDM (wt%) | ODMAS (wt%) | Element content (wt%) | Tg (°C) | |||
|---|---|---|---|---|---|---|---|
| P | Si | N | DSC | DMTA | |||
| ODMAS | — | — | 10.46 | 4.98 | 2.40 | — | — |
| EP-0% | 100 | 0 | 0 | 0 | 2.82 | 153.2 | 162.6 |
| EP-1% | 99 | 1 | 0.105 | 0.050 | 2.82 | 153.7 | 161.1 |
| EP-5% | 95 | 5 | 0.523 | 0.249 | 2.80 | 150.8 | 159.5 |
| EP-10% | 90 | 10 | 1.046 | 0.498 | 2.78 | 151.5 | 162.7 |
| EP-15% | 85 | 15 | 1.569 | 0.747 | 2.76 | 153.1 | 162.4 |
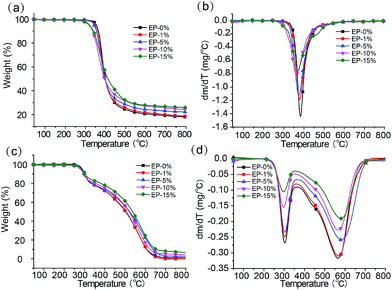 | ||
| Fig. 5 TGA and DTG curves of neat epoxy resin and ODMAS/EP composites with different loading of ODMAS (a, b) nitrogen atmosphere, (c, d) air atmosphere, 10 °C min−1. | ||
| Samples | Nitrogen | Air | |||||
|---|---|---|---|---|---|---|---|
| Td (°C) | Tmax1 (°C) | Char (%) | Td (°C) | Tmax1 (°C) | Tmax2 (°C) | Char (%) | |
| ODMAS | 291.5 | 444.5 | 23.0 | 300.7 | 324.7 | 507.7 | 23.3 |
| EP-0% | 355.0 | 383.0 | 18.1 | 290.3 | 302.8 | 566.0 | 1.1 |
| EP-1% | 348.6 | 377.6 | 18.7 | 289.7 | 302.8 | 568.5 | 1.3 |
| EP-5% | 344.6 | 374.6 | 22.2 | 285.8 | 302.8 | 581.0 | 2.5 |
| EP-10% | 320.2 | 364.2 | 24.2 | 281.8 | 297.8 | 566.0 | 4.1 |
| EP-15% | 319.7 | 370.7 | 25.9 | 280.8 | 297.8 | 580.9 | 6.6 |
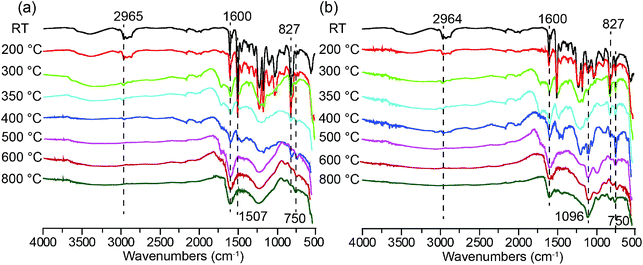
FT-IR analysis was employed to confirm the component and chemical structure changes during the thermal oxidative process of neat epoxy and EP-10%. The sample EP-10% was treated under several representative temperatures (R.T., 200 °C, 300 °C, 350 °C, 400 °C, 500 °C, 600 °C and 800 °C) in a muffle furnace and then tested by FT-IR. For comparison, the FT-IR spectra of the char residue of EP-0% at different temperature were also shown in Fig. 6a. As shown in Fig. 6b, the peaks at 2860–2965 cm−1 (CH2 stretching vibration) decrease evidently in intensity at 200 °C and disappear completely at the temperature over 350 °C, indicating the decomposition of hydrocarbons. This is consistent with the TGA results. The peaks at 1600, 1507, 827 and 750 cm−1 still exist in the high-temperature region (≥400 °C), implying the formation of aromatic structures during the pyrolysis process.40 Importantly, a strong peak at 1096 cm−1 attributed to the stretching vibration of Si–O–Si structure, can still be observed for the ODMAS/EP composites at the temperature ≥400 °C.41,42 In comparison, this peak does not appear in the spectra of neat epoxy at any temperatures. Consequently, the char residues of ODMAS/EP mainly comprise Si–O–Si and aromatic components, which play a key role in for protective barrier that separates heat and cuts off oxygen.
Flame retardant properties
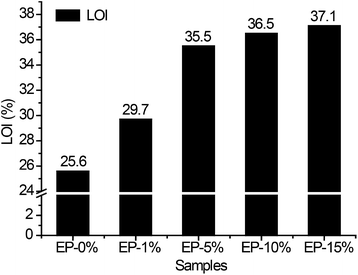
Conventional epoxy resins are ignitable and potentially dangerous in fire, and therefore the flame-retardants modification of epoxy resins is of particular importance. LOI values and UL-94 text were conducted to characterize the flame resistance of ODMAS/EP composites (see Table 3). As shown in Fig. 7 and Table 3, the LOI value of neat epoxy iabout 25.6%, 5 wt% addition of ODMAS results in an evident improvement of flame retardant ability with LOI value of 35.5%. An increase in LOI value is then observed when increasing the content of ODMAS from 5% to 15%.| Samples | LOI (vol%) | Flammability from vertical burning testing | |||
|---|---|---|---|---|---|
| UL-94 rating | Dripping | Maximal flaming time (s) | Total flaming time (s) | ||
| EP-0 | 25.6 | NR | Yes | >30 | >250 |
| EP-1% | 29.7 | V-1 | No | 12.1 | >50 |
| EP-5% | 35.5 | V-0 | No | 8.2 | 37.4 |
| EP-10% | 36.5 | V-0 | No | 7.1 | 31.6 |
| EP-15% | 37.1 | V-0 | No | 3.7 | 13.5 |
The UL-94 measurement commonly evaluates the time of self-extinguish after ignition for 10 s, therefore determining the flammability of materials. The classification of V-0 is obtained if the burning time of a sample bar does not exceed 10 s after removing flame, and the total burning time for five samples does not exceed 50 s; at the same time, the surgical cotton below the specimen cannot be ignited by flaming drippings. Indeed, neat epoxy failed in the UL-94 test and exhibited dripping behaviour. However, the ODMAS/EP composites exhibited enhanced flame resistance, and no drippings were observed during test (see in Table 3). Based on the UL-94 test, EP-1% was classified as V1 rating, and samples including EP-5%, EP-10% and EP-15% were all classified as V0 rating. These results in combination with the LOI values, indicate that ODMAS can significantly improve the fire resistance of neat epoxy resins, and the lower amount of flame retardants is beneficial to the reduction of cost.
To further understand the flame-retardant mechanism, the morphology and chemical composition of residue char were studied. Fig. 8 shows the photographs of residue char of EP-0% and EP-10% after treating at 800 °C for 30 min in a muffle furnace. Apparently, after thermal treatment, EP-10% can maintain its original shape well (Fig. 8b) while EP-0% can't (Fig. 8a). The corresponding SEM images are show in Fig. 8c–f. The residue char of EP-0% (see in Fig. 8a) has obvious surface cracks (Fig. 8c), which can't act as a heat or oxygen shield to protect the inner matrix during burning. In contrast, the exterior char of EP-10% is shaggy and multi-porous features (Fig. 8d), and its inner char is smooth, compact structure and have some holes on the surface (Fig. 8f). The difference between the inner and the outer surface of the char can be observed more directly from the cross-sectional SEM image (Fig. 8e). The smooth and compact structural feature of the inner char serves as an effective barrier against heat and oxygen diffusion and protects the polymer matrix inside from further burning; simultaneously, the shaggy and multi-porous structure of outer char, which fills with air, can shield the interior matrix from further combustion.
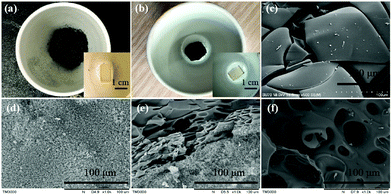 | ||
| Fig. 8 Photographs of EP-0% (a) and EP-10% (b) after maintaining at 800 °C, SEM images of the char EP-0% (c) and EP-10% (exterior (d), cross-section (e) and interior (f)). | ||
The FT-IR spectra of pure EP and ODMAS/EP composites and their pyrolysis residues were compared to further study the flame retardant mechanism. For the ODMAS/EP composites before pyrolysis, the peak at 1096 cm−1 corresponding to the Si–O–Si bond increases as the increasing addition of ODMAS (Fig. S5a†). Also, peaks corresponding to aromatic structures appear at around 1600, 1507, 827 and 750 cm−1. After pyrolysis (Fig. S5b†), the characteristic infrared peaks of Si–O–Si and aromatic structures remain in the FT-IR spectra of char. Moreover, a peak at 913 cm−1 which assigned to P–O–Ph of DOPO can also be observed in the FT-IR spectra of residue char. These results demonstrate that the heat and oxygen shield mainly comprises of Si–O–Si, P–O–Ph and aromatic structures.
Based on the results above, we consider that the flame retardant mechanism of ODMAS mainly accords a condensed-phase by charring due to the synergistic effect among phosphorus, nitrogen and silicon.43,44 Residue char mainly formed by the oxidation of silicon, phosphorus and dehydration of the organic epoxy matrix. The char layer of the hierarchical structure, which acts as a barrier, can slow the heat and oxygen transfer into the epoxy matrix, thus protecting the underlying materials from further burning. The formation of the char layer with hierarchical structure should be the main reason for the enhanced flame resistance.
Mechanical properties
Finally, we are interested in demonstrating the influence of the flame retardant on the mechanical properties of the composites. Three-point bending test was used to measure the flexural modulus of the composite materials. The flexural modulus of a series sample bars with an increasing mass fraction of ODMAS (from 0 wt% to 15 wt%) are shown in Fig. S6,† and the value of the mechanical properties data of the composites are summarized in Table 4. The flexural modulus could be estimated from the slope of the σ–ε curves according to eqn (3) (see in experimental part), in which εf2 = 0.0025, εf1 = 0.0005, σf2 and σf1 represent the corresponding flexural strain. The flexural modulus of the composites with ODMAS (from 1 wt% to 15 wt%) are higher than that of the neat epoxy resin (EP-0%) and reach the maximum value of 2984 MPa at 10 wt% content of ODMAS. A further increase of the ODMAS content leads to a reduction in modulus. The improved modulus of the sample with the addition of ODMAS may be attributed to the good affinity between DOPO and DGEBA. In the ODMAS molecular, the outer DOPO groups combine with DGEBA, making the inside POSS acted as an effective physical cross-linking point. However, huge molecular volume of ODMAS can also enlarge the intermolecular space and improve the motion ability of segments, thus resulting in a lower modulus.45,46 When the ODMAS loading is low, the physical crosslinking is the main factor, however, when ODMAS increased to a certain extent (more than 10 wt% in our work), the free volume has a greater effect on modulus reduction. Therefore, on account of the co-effect of these two factors, the modulus of ODMAS/EP composites increased with the increasing of ODMAS content first and then decreased. In addition, the similar tendency was also observed in the DMA results (see in Fig. S4†). In other words, the enhanced flexural modulus of ODMAS/EP composites can be ascribed to the strong intermolecular force between the ODMAS and epoxy matrix.| Systems | Flexural modulus E (MPa) | Percentage of increased modulus strength (%) |
|---|---|---|
| EP-0% | 2696 ± 41.4 | 0 |
| EP-1% | 2703 ± 47.9 | 2.80 |
| EP-5% | 2821 ± 57.7 | 4.63 |
| EP-10% | 2984 ± 60.2 | 10.67 |
| EP-15% | 2829 ± 97.4 | 4.93 |
Conclusions
In summary, a novel halogen-free flame retardant (ODMAS) was synthesized through a high yield and purity combining both the Kabachnik–Fields reaction and hydrolysis reaction. The chemical structure of ODMAS was confirmed by 1H, 29Si, and 31P NMR, FT-IR spectroscopy, and elemental analysis. ODMAS can be homogeneously dispersed in epoxy resins, resulting in an entirely transparent composite materials. The introduction of ODMAS into epoxy matrix leads to an optimized flame resistance, including the increased char yield at 800 °C and reduced maximum mass loss rate. Moreover, the LOI value is significantly improved to 37.1%, and the samples are classified as V0 rating in the UL-94 test. The remarkable enhancement in the flame resistance is mainly attributed to the hierarchical structure of the char which acted as an effectively barrier to protect the inner epoxy matrix from further burning. The three-point bending test results show that ODMAS can enhance the mechanical properties, and with the increased ODMAS load the flexural modulus increases first and then decreases. The work illustrates an example for the development of multi-element synergistic halogen-free flame retardant with good solubility in polymer matrix, can simultaneously improve the flame resistance and mechanical properties of the polymeric materials.Experiment
Materials
(3-Aminopropyl)triethoxysilane (APTES) was purchased from Aladdin and used as received. 9,10-Dihydro-9-oxa-10-phosphaphenanthrene-10-oxide (DOPO) was purchased from Shanghai Eutec Chemical, China. Diglycidyl ether of bisphenol A (DGEBA, trade name was E51) was a kind of liquid epoxy resins and supplied by Sinopec Baling Branch Company, China. 4,4′-diaminodiphenylmethane (DDM) and polyoxymethylene (POM) were purchased from Sinopharm Chemical Reagent Co. Ltd., China. The reagents were analytical grade and used as received unless otherwise noted.Synthesis of octa-(N,N-(bis-(9,10-dihydro-9-oxa-10-phosphaphenanthene-10-yl)methyl)aminopropyl)silsesquioxane (ODMAS)
APTES (40 mmol, 8.81 g), POM (88 mmol, 2.64 g), DOPO (88 mmol, 19.04 g) and chloroform (70 mL) were introduced into a 150 mL round bottom glass flask equipped with a condenser and magnetic stirrer. The mixture was vigorously stirred at 50 °C for 12 h. Then the solvent was evaporated by vacuum-rotary evaporation to obtain white powder. The white power was then dispersed in 70 mL of methanol to obtained a homogeneously solution followed by addition of 5 mL HCl (37%) as catalyst. After reaction at 80 °C for 12 h, the reaction solvent was concentrated into 15 mL by vacuum-rotary evaporation and then 150 mL of cold methanol was added slowly to afford white precipitate. The white precipitate was washed with deionized water for three times, and dried under vacuum at 50 °C for 24 h to obtain final product ODMAS (16.67 g, yield 90.4%). The synthetic scheme of ODMAS is shown in Scheme 1.FT-IR (ATR, cm−1): 3059 (biphenyl in DOPO), 2926 (C–H), 1460 (P-biphenyl), 1232 (P![[double bond, length as m-dash]](https://www.rsc.org/images/entities/char_e001.gif) O), 1072 (Si–O–Si), 908 (P–O–biphenyl); 1H NMR (CDCl3, 300 MHz) δ (ppm): 6.75–7.96 (128H, Ar-H), 3.28–3.67 (32H, N–(CH2–P)2), 2.68–3.28 (16H, N–CH2–CH2–CH2–Si), 1.53 (16H, Si–CH2–CH2–CH2–N), 0.56 (16H, Si–CH2–CH2–CH2–N); 31P NMR (CDCl3, 121 MHz) δ (ppm): 32.17; 29Si NMR (80 MHz) δ (ppm): −71.92. Anal. calcd for C232H208N8O44P16Si8: C, 61.48%; H, 4.63%; N, 2.47%. Found: C, 59.95%; H, 4.79%; N, 2.41%.
O), 1072 (Si–O–Si), 908 (P–O–biphenyl); 1H NMR (CDCl3, 300 MHz) δ (ppm): 6.75–7.96 (128H, Ar-H), 3.28–3.67 (32H, N–(CH2–P)2), 2.68–3.28 (16H, N–CH2–CH2–CH2–Si), 1.53 (16H, Si–CH2–CH2–CH2–N), 0.56 (16H, Si–CH2–CH2–CH2–N); 31P NMR (CDCl3, 121 MHz) δ (ppm): 32.17; 29Si NMR (80 MHz) δ (ppm): −71.92. Anal. calcd for C232H208N8O44P16Si8: C, 61.48%; H, 4.63%; N, 2.47%. Found: C, 59.95%; H, 4.79%; N, 2.41%.
Preparation of ODMAS/DGEBA/DDM thermosets and control sample
The flame-retardant epoxy resins were obtained via the procedural curing of DGEBA. Fig. S1† gives the detailed process for get the final thermosets. The contents of ODMAS were 1, 5, 10 and 15 wt%, stoichiometric amounts of DDM were used as curing agents, and the resultant samples were marked as EP-1%, EP-5%, EP-10%, and EP-15%, respectively. Neat epoxy resin prepared through a DGEBA/DDM system without ODMAS was used as control sample (marked as EP-0%). All the compositions of samples are listed in Table 1. Typically, flame-retardant ODMAS was added in DGEBA under continuous stirring at 90 °C until the mixture became transparent, after which DDM was added. The mixture was poured into a steel mould once the mixture became homogeneous. A three-step curing procedure was carried out to prepare the thermosetting resins. All sample were thermally cured at 120 °C for 4 h followed by at 140 °C for 2 h, then further post-cured at 180 °C for 2 h to ensure the complete curing reaction. Thereafter, all specimens were naturally cooled to room temperature in order to avoid stress cracking.Characterization
Attenuated total reflectance Fourier transform infrared (ATR-FTIR) spectra were obtained on a Nicolet Avatar 360 spectrophotometer. Nuclear magnetic resonance (1H NMR, 29Si NMR and 31P NMR) spectra were recorded on a Bruker Advanced II AV300 MHz NMR spectrometer with CDCl3 as the solvent. UV-vis absorption data of the samples were acquired on a Unico UV-vis 2802PCS UV spectrometer in transmission mode with specimens dimension 50 × 10 × 4 mm3. The wavelengths ranges from 300 to 800 nm.Scanning electron microscope (SEM) images were obtained from a Hitachi TM3000 instrument. The fracture surface morphology of the specimens before and after etching by DCM and the morphological structures of the char residue after LOI tests were studied.
Thermogravimetric analysis (TGA) was performed with a NETZSCH STA 409EP, heating from R.T. to 800 °C at a heating rate of 10 °C min−1 under air and nitrogen conditions, respectively.
Differential scanning calorimetry (DSC) was conducted on a NETZSCH STA 449C, heating from R.T. to 250 °C at a heating rate of 10 °C min−1 under nitrogen atmosphere. The mass of each sample was approximate 4–10 mg.
The limiting oxygen index (LOI) was determined with a FTT 0077 type instrument (FTT, UK) with specimens dimension were 100 × 6 × 4 mm3. The percentage of O2 in the O2/N2 mixture was taken as the LOI which was just sufficient to sustain the flame.
The UL-94 test was performed by FTT 0082 type instrument (FTT, UK) with the specimens dimension were 120 × 12.5 × 4 mm3. The UL-94 test determines the upward burning characteristics of a solid. Five sample bars suspended vertically over surgical over cotton were ignited by a Bunsen burner, after ignition for 10 s, the flame was removed and the time for the polymer to self-extinguish (t1) was recorded.
Dynamic mechanical analysis (DMA) was performed on a TA instrument (NETZSCH DMA 242E) in double-cantilever mode, with temperature ranging from R.T. to 250 °C. The frequencies was set at 1 Hz, with an oscillation amplitude of 20 μm. The heating rate was fixed at 2 °C min−1. The typical dimensions of the sample beams were 60 × 10 × 4 mm3.
Three-point bending experiment was conducted on an electronic universal testing machines (AGS-X, Shimadzu, Japan). The crosshead speed was 1 mm min−1 and typical dimensions of the sample beams were 120 × 10 × 4 mm3. Bending stress (σ) was calculated by the eqn (1):
 | (1) |
 . Flexural strain (ε) was calculated by the eqn (2):
 | (2) |
 | (3) |
 .
.
Conflicts of interest
There are no conflicts to declare.Acknowledgements
This work was supported by the National Natural Science Foundation of China (51673161, 51573150), National Science Technology Supporting Program (2014BAF08B03), Scientific and Technological Innovation Platform of Fujian Province (2014H2006), and Xiamen Science and Technology Plan Project (3502Z20150047). Key Project of Fujian Department Science and Technology (2013HZ0005-1); Natural Science Foundation of Fujian Province (2016J01257).References
- A. Toldy, P. Anna, I. Csontos, A. Szabó and G. Marosi, Polym. Degrad. Stab., 2007, 92, 2223–2230 CrossRef CAS.
- G. H. Hsiue, Y. L. Liu and H. H. Liao, J. Polym. Sci., Part A: Polym. Chem., 2001, 39, 986–996 CrossRef CAS.
- Y. Nakamura, M. Yamaguchi, M. Okubo and T. Matsumoto, J. Appl. Polym. Sci., 1992, 45, 1281–1289 CrossRef CAS.
- J. Wan, C. Li, Z.-Y. Bu, C.-J. Xu, B.-G. Li and H. Fan, Chem. Eng. J., 2012, 188, 160–172 CrossRef CAS.
- X. Wang, E. N. Kalali and D.-Y. Wang, ACS Sustainable Chem. Eng., 2015, 3, 3281–3290 CrossRef CAS.
- B. Guo, Y. Liu, Q. Zhang, F. Wang, Q. Wang, Y. Liu, J. Li and H. Yu, ACS Appl. Mater. Interfaces, 2017, 9, 23039–23047 CAS.
- J. N. Md, N. H. T. Diana, T. Tran Thanh, K. Shervin and L. Dusan, ACS Appl. Mater. Interfaces, 2017, 9, 10160–10168 Search PubMed.
- V. Marta, A. Salamova and R. A. Hites, Acc. Chem. Res., 2015, 48, 1853–1861 CrossRef PubMed.
- J. A. Mikroyannidis and D. A. Kourtides, J. Appl. Polym. Sci., 1984, 29, 197–209 CrossRef CAS.
- S. Tang, V. Wachtendorf, P. Klack, L. Qian, Y. Dong and B. Schartel, RSC Adv., 2017, 7, 720–728 RSC.
- J. Sun, X. Wang and D. Wu, ACS Appl. Mater. Interfaces, 2012, 4, 4047–4061 CAS.
- S. Yang, J. Wang, S. Huo, J. Wang and Y. Tang, Polym. Degrad. Stab., 2016, 126, 9–16 CrossRef CAS.
- W. Zhang, G. Camino and R. Yang, Prog. Polym. Sci., 2017, 67, 77–125 CrossRef CAS.
- C. Martin, G. Lligadas, J. Ronda, M. Galia and V. Cadiz, J. Polym. Sci., Part A: Polym. Chem., 2006, 44, 6332–6344 CrossRef CAS.
- Y. Shi, B. Yu, L. Duan, Z. Gui, B. Wang, Y. Hu and R. K. Yuen, J. Hazard. Mater., 2017, 332, 87–96 CrossRef CAS PubMed.
- P. Zhang, H. Fan, S. Tian, Y. Chen and J. Yan, RSC Adv., 2016, 6, 72409–72422 RSC.
- B. Wu, W. Kong, K. Hu, X. Fu, J. Lei and C. Zhou, Adv. Polym. Technol., 2017, 1–13 Search PubMed.
- L. Gu, G. Chen and Y. Yao, Polym. Degrad. Stab., 2014, 108, 68–75 CrossRef CAS.
- Z. Li and R. Yang, Polym. Degrad. Stab., 2014, 109, 233–239 CrossRef CAS.
- H. Ma, P. Song and Z. Fang, Sci. China: Chem., 2011, 54, 302–313 CrossRef CAS.
- S. Song, J. Ma, K. Cao, G. Chang, Y. Huang and J. Yang, Polym. Degrad. Stab., 2014, 99, 43–52 CrossRef CAS.
- S.-H. Liao, P.-L. Liu, M.-C. Hsiao, C.-C. Teng, C.-A. Wang, M.-D. Ger and C.-L. Chiang, Ind. Eng. Chem. Res., 2012, 51, 4573–4581 CrossRef CAS.
- X. Qian, L. Song, B. Yu, B. Wang, B. Yuan, Y. Shi, Y. Hu and R. K. K. Yuen, J. Mater. Chem. A, 2013, 1, 6822–6830 CAS.
- R. Jian, P. Wang, W. Duan, J. Wang, X. Zheng and J. Weng, Ind. Eng. Chem. Res., 2016, 55, 11520–11527 CrossRef CAS.
- S. Wang, S. Ma, C. Xu, Y. Liu, J. Dai, Z. Wang, X. Liu, J. Chen, X. Shen, J. Wei and J. Zhu, Macromolecules, 2017, 50, 1892–1901 CrossRef CAS.
- Z. Zhang, A. Gu, G. Liang, P. Ren, J. Xie and X. Wang, Polym. Degrad. Stab., 2007, 92, 1986–1993 CrossRef CAS.
- Z. Ruan, W. Rong, X. Zhan, Q. Li and Z. Li, Polym. Chem., 2014, 5, 5994–6002 RSC.
- W. Zhang, X. Li and R. Yang, Polym. Degrad. Stab., 2011, 96, 2167–2173 CrossRef CAS.
- W. Zhang, X. Li and R. Yang, Polym. Degrad. Stab., 2012, 97, 1314–1324 CrossRef CAS.
- C. Liu, T. Chen, C. Yuan, C. Song, Y. Chang, G. Chen, Y. Xu and L. Dai, J. Mater. Chem. A, 2016, 4, 3462–3470 CAS.
- F. J. Feher, D. A. Newman and J. F. Walzer, J. Am. Chem. Soc., 1989, 111, 1741–1748 CrossRef CAS.
- X. He, W. Zhang and R. Yang, Composites, Part A, 2017, 98, 124–135 CrossRef CAS.
- C. G. Robertson and C. M. Roland, Rubber Chem. Technol., 2008, 81, 506–522 CrossRef CAS.
- H. Wang, Y. Zhang, L. Zhu, Z. Du, B. Zhang and Y. Zhang, Thermochim. Acta, 2011, 521, 18–25 CrossRef CAS.
- J.-Y. Shieh and C.-S. Wang, Polymer, 2001, 42, 7617–7625 CrossRef CAS.
- M. C. O. Chang, D. A. Thomas and L. H. Sperling, J. Appl. Polym. Sci., 1987, 34, 409–422 CrossRef CAS.
- X. Zhang, Q. He, H. Gu, H. A. Colorado, S. Wei and Z. Guo, ACS Appl. Mater. Interfaces, 2013, 5, 898–910 CAS.
- X. Wang, Y. Hu, L. Song, W. Xing, H. Lu, P. Lv and G. Jie, Polymer, 2010, 51, 2435–2445 CrossRef CAS.
- K. Wu, L. Song, Y. Hu, H. Lu, B. K. Kandola and E. Kandare, Prog. Org. Coat., 2009, 65, 490–497 CrossRef CAS.
- X. Wang, Y. Hu, L. Song, H. Yang, W. Xing and H. Lu, Prog. Org. Coat., 2011, 71, 72–82 CrossRef CAS.
- B. Yu, Y. Shi, B. Yuan, S. Qiu, W. Xing, W. Hu, L. Song, S. Lo and Y. Hu, J. Mater. Chem. A, 2015, 3, 8034–8044 CAS.
- B. Yu, Y. Tao, L. Liu, Y. Shi, H. Yang, G. Jie, S. Lo, Q. Tai, L. Song and Y. Hu, RSC Adv., 2015, 5, 75254–75262 RSC.
- F. Laoutid, L. Bonnaud, M. Alexandre, J. M. Lopez-Cuesta and P. Dubois, Mater. Sci. Eng., R, 2009, 63, 100–125 CrossRef.
- X. Wang, Y. Hu, L. Song, W. Xing and H. Lu, J. Polym. Sci., Part B: Polym. Phys., 2010, 48, 693–705 CrossRef CAS.
- Y.-J. Lee, J.-M. Huang, S.-W. Kuo, J.-S. Lu and F.-C. Chang, Polymer, 2005, 46, 173–181 CrossRef CAS.
- N. T. Tsui, A. J. Paraskos, L. Torun, T. M. Swager and E. L. Thomas, Macromolecules, 2006, 39, 3350–3358 CrossRef CAS.
Footnote |
| † Electronic supplementary information (ESI) available: Additional experimental details and spectra, including schematic illustration of the preparation of ODMAS/epoxy nanocomposites, a figure indicating thermogravimetric measurements of ODMAS, a figure indicating TEM images of EP-0% and EP-10%, and a figure indicating FT-IR spectra of composites with vary ODMAS contents and that of corresponding char residues, and figures indicating δ–ε curves and DMTA data of various ODMAS/EP systems. See DOI: 10.1039/c7ra09327f |
| This journal is © The Royal Society of Chemistry 2017 |


