 Open Access Article
Synthesis of graphene wrapped porous CoMoO4 nanospheres as high-performance anodes for rechargeable lithium-ion batteries†
Donghao Lyu‡
a,
Lingling Zhang‡a,
Huaixin Weic,
Hongbo Geng*b and
Hongwei Gu *a
*a
aKey Laboratory of Organic Synthesis of Jiangsu Province, College of Chemistry, Chemical Engineering and Materials Science, Collaborative Innovation Center of Suzhou Nano Science and Technology, Soochow University, Suzhou, 215123, China. E-mail: hongwei@suda.edu.cn
bSchool of Chemical Engineering and Light Industry, Guangdong University of Technology, Guangzhou 510006, China
cSchool of Chemical Biology and Materials Engineering, Jiangsu Key Laboratory for Environment Functional Materials, Suzhou University of Science and Technology, Suzhou 215009, China
First published on 6th November 2017
Abstract
Herein, we described a facile method to synthesise porous CoMoO4 nanospheres wrapped with graphene (CoMoO4@G). The porous CoMoO4@G composites were generated from the calcination treatment of CoMo precursors, followed by a graphene-coating process. Compared with pristine CoMoO4 porous spheres, the graphene sheets endowed the CoMoO4@G with higher electrical conductivity and structural stability. When used as an anode materials for lithium-ion batteries (LIBs), the CoMoO4@G electrode delivers a high initial specific capacity (1355.8 mA h g−1 at 100 mA g−1), good cycling stability (783 mA h g−1 over 150 cycles at 500 mA g−1) and excellent rate capacity (697.7 mA h g−1 at 2000 mA g−1). In view of this, the combination of the graphene sheets with CoMoO4 nanospheres serve as potential anode materials for application in the new generation of LIBs.
Introduction
It has been several years since high power density and environmentally friendly energy systems, such as fuel cells, solar cells, lithium-ion batteries (LIBs), etc., came into public applications.1–4 Among them, LIBs, as a remarkable alternative and clean energy conversion, have attracted crucial attention, because of their high energy and power density, lack of memory effect, eco-friendliness as well as universal availability.5–7 With the development of electronic devices and power-driven machines, traditional LIBs using a graphite anode (whose specific capacity is about 372 mA h g−1) cannot meet the expanding energy demand.8–11Recently, many researchers have focused on exploring high-performance electrode materials for LIBs. Among the anode materials investigated, metal molybdates (XMoO4, X = transition metal) have received extensive attention.12–15 As a representative, CoMoO4 with a high theoretical capacity (980 mA h g−1) has attracted great attention due to its high electrochemical activity.16–18 Unfortunately, the low conductivity and strong aggregation tendency of CoMoO4 compromise its electrochemical properties and hinder its practical application to a great extent.19–21 To address these problems, it is proposed and reported that coating CoMoO4 nanostructure with conductive carbon could remedy the disadvantages mentioned above. Graphene with a huge specific surface area (2630 m2 g−1), high electrical conductivity and unique mechanical strength, is a promising candidate to improve the electrochemical properties of CoMoO4. Two-dimensional (2D) graphene layer can effectively suppress the structural pulverization and large volumetric expansion in the cycling process, so as to maintain the stability of electrode material.22,24–29 For example, Yang et al. have successfully synthesized CoMoO4/rGO composite via a simple green wet chemical method, and it delivers a discharge specific capacity of 628 mA h g−1 after 100 cycles at a current density of 100 mA g−1.22 Xu and his co-workers also prepared lotus root-like CoMoO4@graphene nanofibers by electrospinning and subsequent heat treatment which displayed high reversible capacity of 735 mA h g−1 at 100 mA g−1.23 However, the relatively low specific capacities reported in the above literatures can not still satisfied the commercial applications of CoMoO4 electrode materials.
In this work, we have synthesized the graphene wrapped CoMoO4 structures (referred as CoMoO4@G) via a facile method. When used as a anode for LIBs, the CoMoO4@G composites demonstrated splendid electrochemical capacity, e.g. stable cycling performance (783.0 mA h g−1 after 150 cycles at a current density of 500 mA g−1), high coulombic efficiency and excellent rate performance (1103.0, 990.0, 909.3, 829.2 and 697.7 mA h g−1 at 100, 200, 500, 1000 m and 2000 mA g−1).
Experimental section
Materials
All reagents used in the experiment were of analytical purity and were used without further purification.Synthesis of porous CoMoO4 nanospheres
The CoMoO4 nanospheres were synthesized via a controllable hydrothermal method as followed: 1.5 mmol Co(NO3)2·6H2O and 1.5 mmol molybdenum(IV) acetylacetonate were dissolved in 200 mL isopropyl alcohol and 40 mL glycerol. After stirred over night at room temperature, the above mixed solution was transferred and uniformly distributed to four 100 mL hydrothermal reactor and reacted at 180 °C for 12 h. The light brown precipitate was collected by centrifugation and washed with ethanol and water for three times. After calcined at 600 °C in air for 2 h with a rate of 1 °C min−1 and maintained at the temperature for 3 h in a muffle, a black powder was finally obtained (CoMoO4 nanospheres).Synthesis of the CoMoO4@G complex
Typically, 80 mg as-prepared CoMoO4 nanospheres were re-dispersed into 30 mL deionized water and then 40 mg graphene oxide (GO) aqueous suspension (0.5 mg mL−1) was added into the above solution under stirring for 2 h to form a homogeneous solution. Next, the mixture was transferred into a 100 mL Teflon-lined stainless steel autoclave and kept at 180 °C for 12 h. After cooled to room temperature, the product was collected and washed with distilled water and absolute alcohol for three times. The final product was sintered under Ar atmosphere at 600 °C for 2 h with a rate of 1 °C min−1.Materials characterization
The morphologies of the materials were visualized by scanning electron microscopy (SEM Hitachi S-4700), transmission electron microscopy (TEM TecnaiG220, FEI, American) and high-resolution TEM (HRTEM) recorded on a Tecnai G2 F20 S-TWIN microscope with an accelerating voltage of 200 kV. The element contents were tested by energy dispersive X-ray spectroscopy (EDS) on a Hitachi S-4700 SEM. The crystal structure was measured by an X-ray diffraction (XRD) machine using an X'Pert diffractometer (Netherland PANalytical, a Cu Kα X-ray source, λ = 1.540598 Å). Thermogravimetric analysis (TGA) was tested on Perkin Elmer TGA 4000 thermogravimetric analyser and X-ray photoelectron spectroscopy (XPS, Escalab250Xi, UK) was utilized to investigate the elemental composition and oxidation state.Electrochemical measurements
To prepare the electrode, active materials (CoMoO4@G), acetylene black as well as polyvinylidene fluoride (PVDF) (7![[thin space (1/6-em)]](https://www.rsc.org/images/entities/char_2009.gif) :
:![[thin space (1/6-em)]](https://www.rsc.org/images/entities/char_2009.gif) 2
2![[thin space (1/6-em)]](https://www.rsc.org/images/entities/char_2009.gif) :
:![[thin space (1/6-em)]](https://www.rsc.org/images/entities/char_2009.gif) 1 in weight ratio) were dispersed in 1-methyl-2-pyrrolidone (NMP) to form a homogeneous slurry. The slurry was casted onto a copper foil and dried overnight at 110 °C in a vacuum oven. In the system, the as-prepared electrodel was used as the working electrode, a metallic lithium foil (15 mm in diameter) was employed as the counter and reference electrode and Celgard 2400 membrane was applied as the separator. The electrolyte was 1 M LiPF6 in the mixture of ethylene carbonate and diethyl carbonate (EC/DEC, 1/1 by volume). The charge/discharge measurement was performed using a LAND CT2001 test system with huge current ranging of 0.01–3.0 V (vs. Li/Li+). Cyclic voltammetry (CV) tests were carried out at a scanning rate of 0.1 mV s−1 in the range of 0.01–3.0 V. Electrochemical Impedance Spectroscopy (EIS) was measured by a using a CS350 electrochemical workstation with the frequency changing from 100 kHz to 0.01 mHz.
1 in weight ratio) were dispersed in 1-methyl-2-pyrrolidone (NMP) to form a homogeneous slurry. The slurry was casted onto a copper foil and dried overnight at 110 °C in a vacuum oven. In the system, the as-prepared electrodel was used as the working electrode, a metallic lithium foil (15 mm in diameter) was employed as the counter and reference electrode and Celgard 2400 membrane was applied as the separator. The electrolyte was 1 M LiPF6 in the mixture of ethylene carbonate and diethyl carbonate (EC/DEC, 1/1 by volume). The charge/discharge measurement was performed using a LAND CT2001 test system with huge current ranging of 0.01–3.0 V (vs. Li/Li+). Cyclic voltammetry (CV) tests were carried out at a scanning rate of 0.1 mV s−1 in the range of 0.01–3.0 V. Electrochemical Impedance Spectroscopy (EIS) was measured by a using a CS350 electrochemical workstation with the frequency changing from 100 kHz to 0.01 mHz.
Results and discussion
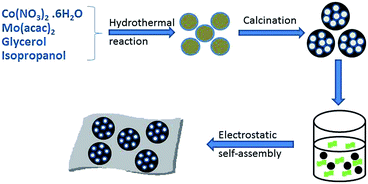
The preparation process of the CoMoO4@G composites is illustrated in Scheme 1. Briefly, the CoMo precursors were obtained by a facile hydrothermal method using cobalt nitrate and molybdenyl acetylacetone as the starting materials, followed by a calcination procedure, and the porous CoMoO4 nanospheres were obtained. Afterwards, the CoMoO4 nanospheres were wrapped with graphene oxide sheets though further hydrothermal and calcining approach to form the CoMoO4@G composites.From the SEM image (Fig. 1a), we can see that the precursor has smooth surface, with the diameter between 300 and 400 nm, which can be clearly observed via the corresponding TEM image (Fig. 1c). After the heat treatment, a large number of pores form on the surface of nanospheres (Fig. 1b). From the TEM images (Fig. 1d), the porous structure of the nanospheres is clearly presented. Besides, the result of energy dispersive X-ray spectroscopy (EDS) was also given to measure the element composition of the CoMo precursor and the porous CoMoO4 nanospheres. As shown in Fig. S1a,† the CoMo precursor consist of Co, Mo, C, N, O element, of which the mass fraction are 15.24%, 22.51%, 29.77%, 3.91%, 28.56%, respectively. In Fig. S1b,† The atomic ratio of Co, Mo and O identifies with the stoichiometric ratio of CoMoO4.
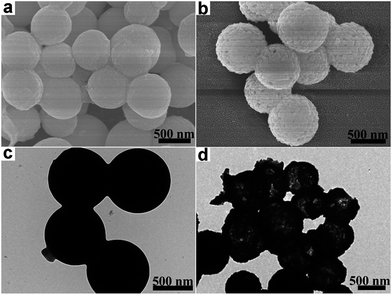 | ||
| Fig. 1 (a) SEM image and (c) TEM image of precursor; (b) SEM image and (d) TEM image of CoMoO4 nanospheres. | ||
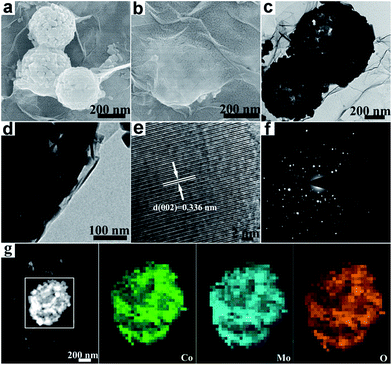
The morphology of CoMoO4@G was investigated by SEM and TEM. As shown in Fig. 2a and b, the nanospheres was coated with two-dimensional graphene membrane, which can be lightly acquainted from the TEM images (Fig. 2c and d). In Fig. 2e, the high-resolution TEM (HRTEM) image reveals the lattice fringes possessing a spacing distance of 0.336 nm, in correspondence with the (002) lattice plane of CoMoO4.30 The selective area electron diffraction (SAED) further supports the result (Fig. 2f). As displayed in Fig. 2g, the corresponding element mapping images further confirm the nanospheres consist of Co, Mo, O, which have uniform distribution. The element composition of the CoMoO4@G was exhibited in Fig. S1c† as well.
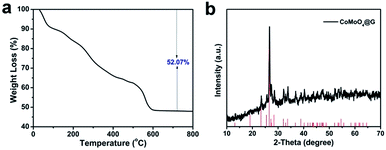
Thermogravimetric metric analysis (TGA) was utilized to estimate the optimal calcination temperature to form the CoMoO4 nanospheres. In Fig. 3a, it was carried out in definite air flow from 0–800 °C, with a heating rate of 10 °C min−1 and the weight loss is about 52.07% ascribed to the thermal decomposition of precursors. With the temperature rising, the weight is reduced uniformity and stabilized at 600 °C. Powder X-ray diffraction (XRD) was used to analyze the crystallographic structure and purity of the CoMoO4@G composites. As shown in Fig. 3b, it can be found that the XRD pattern of CoMoO4@G is similar to pure CoMoO4 nanospheres and all the diffraction peaks are indexed to the standard XRD data card (JCPDS no. 21-0868).31–34 In addition, the XRD pattern of pure CoMoO4 was also displayed in Fig. S2,† which further confirm the high purity of the obtained products. The CoMoO4 content in the CoMoO4@G sample was also measured by the thermogravimetric analysis (TGA) carried out at same condition (Fig. S3†). It is implied based on the TGA result that the CoMoO4 content was about 57.5%. Moreover, we took advantage of Raman spectrum to further investigate the graphitic sp2 carbon in the CoMoO4@G composite. The two broad peaks located at 1334 and 1579 cm−1 could be attributable to typical D- and G-bands of graphene, respectively, confirming the presence of carbon (Fig. S4†).
The elemental composition and relevant electronic states was indicated evidently by X-ray photoelectron spectroscopy (XPS). Fig. 4a shows the survey spectrum of the CoMoO4@G complex, revealing that the product is comprised of Co, Mo, O and C elements. In which, the peaks of Co, Mo and O can be attributed to CoMoO4, while the C peak originate from graphene. Moreover, the Co 2p core level spectrum was presented in Fig. 4b, two peaks located at 796.5 and 779.5 eV are attributed to Co 2p1/2 and Co 2p3/2. The XPS spectra for Mo 3d was shown in Fig. 4c, it displays two peaks at 235.7 and 232.5 eV are attributed to Mo 3d3/2 and Mo 3d5/2, demonstrating the Mo6+ oxidation state is the main existence form of Mo element.35,36 In Fig. 4d, the peak with binding energies at 284.6 eV corresponds to sp2 hybridized carbon. Nitrogen adsorption–desorption isotherms was also given in Fig. S5.† As the result, The Brunauer–Emmett–Teller (BET) surface area of CoMoO4@G is calculated to be 15.5 m2 g−1 (Fig. S5a†). The pore-size distribution analyzed using the Barrett–Joyner–Halenda (BJH) method was display in Fig. S5b.† The dominant pore size distribution of CoMoO4@G is about 11.5 nm, revealing the porous structure of the CoMoO4@G composites.
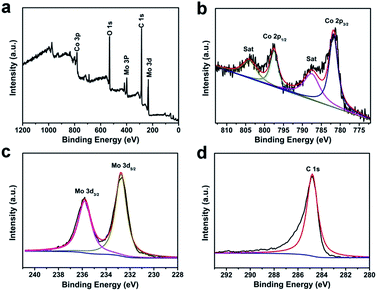 | ||
| Fig. 4 XPS spectra for as-obtained CoMoO4@G: (a) the survey spectrum and the high resolution for (b) Co 2p, (c) Mo 3d and (d) C 1s. | ||
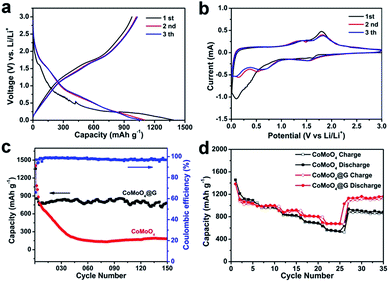
Fig. 5a presents the charge/discharge profiles of the CoMoO4@G electrode in the first three cycles at a current density of 100 mA g−1. In the initial discharge process, the voltage dropping from 2.5 V to a plateau at 0.01 V can be attributed to the reduction of CoMoO4 and the irreversible reaction with the electrolyte.30,37 The first discharge and charge capacities of CoMoO4@G electrode at 100 mA g−1 is 1355.8 and 893.0 mA h g−1, respectively. The initial coulombic efficiency is 65.9%. Fig. 5b displays the cyclic voltammograms (CVs) of the as-prepared CoMoO4@G electrode in a potential voltage between 0.01 and 3.0 V at a scan rate of 0.1 mV s−1. In the initial cathodic scan, three peaks located at 0.08, 0.7 and 1.6 V are relevant to the structural change caused by the reduction reaction of Co and Mo oxide, together with the formation of solid electrolyte interface (SEI), expressed by eqn (1). In the anodic process, two peaks at 1.4 and 1.8 V can be obviously observed in correspondence with the lithium extraction from graphene and the formation of Co and Mo oxide. In which, the peak at 1.4 V might be ascribed to the oxidation of Mo0 to Mo4+, and the peak at 1.8 V could indicate the oxidation of Co to Co2+ and Mo4+ to Mo6+, expressed by eqn (2) and (3). In the subsequent cycles, two cathodic peaks at 0.6 and 1.55 V and two anodic peaks at 1.4 and 1.8 V can be surveyed, respectively. The difference between the first cycle curves and the followings might be caused by the inevitable formation of a solid electrolyte interphase (SEI). But the high overlap of the following cycles still implies the great cycling performance of the CoMoO4@G electrode material.22,32,38–42 Based on the charge–discharge profile, CV curves, the Li+ insertion/extraction behaviour of the CoMoO4@G electrode can be suggested as follows:
| CoMoO4 + 8Li+ + 8e− → Co + Mo + 4Li2O | (1) |
| Co + Li2O → CoO + 2Li | (2) |
| Mo + 3Li2O → MoO3 + 6Li | (3) |
Fig. 5c displayed the cycling performance and coulombic efficiency of CoMoO4 and CoMoO4@G electrodes at a current density of 500 mA g−1. The CoMoO4@G electrode can deliver a specific capacity of 783.0 mA h g−1 after 150 cycles at a density of 500 mA g−1, which is higher than that of pure CoMoO4. It can be concluded that the presence of graphene layer plays an important role on the improvement of cycling stability.23 The CoMoO4@G electrode was tested at different current densities in order to survey the rate performance of CoMoO4@G material. As shown in Fig. 5d, the sample delivers specific capacities of 1103.0, 990.0, 909.3, 829.2 and 697.7 mA h g−1 at 100, 200, 500, 1000 m and 2000 mA g−1, superior to pure CoMoO4 nanospheres. When the current density reduced to 100 mA g−1, the capacity can return to be 1132.7 mA h g−1.
Electrochemical impedance spectra (EIS) of pure CoMoO4@G nanospheres and CoMoO4@G composites fitted using an equivalent circuit was also carried out to examine the improved electrochemical performance. As we all know, every plot consists of a semicircle in the high-frequency region and a straight sloping line in the low-frequency. As seen in Fig. 6, the high-frequency semicircle diameter of CoMoO4@G is smaller than that of pure CoMoO4. As a result, the CoMoO4@G electrode possess enhanced electrochemical properties, the presence of graphene can improve the electrical conductivity as well.
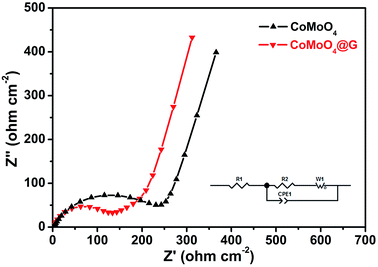 | ||
| Fig. 6 Electrochemical impedance spectroscopy plots of pure CoMoO4 nanospheres and as-prepared CoMoO4@G composite. | ||
Conclusion
In summary, porous CoMoO4 nanospheres (about 400 nm in diameter) embedded in graphene sheets were successfully synthesized via a facile hydrothermal, calcination and graphene-coating approach. When tested as an anode for LIBs, the CoMoO4@G electrode exhibited outstanding cycling performance (783 mA h g−1 over 150 cycles at a current density of 500 mA g−1), and rate capacity (1103.0, 990.0, 909.3, 829.2 and 697.7 mA h g−1 at 100, 200, 500, 1000 m and 2000 mA g−1). The good electrochemical performance can be attributed to the synergistic effect of porous structure and well-defined graphene-coating design. The utilization of porous architecture can shorten the lithium ion diffusion distance and restrain the volume change, enhancing the space for both Li+ and electron transport. In addition, the graphene layer can effectively maintain the stability of CoMoO4 nanospheres and improve the electric conductivity, which can improve the cycling and rate performances.Conflicts of interest
There are no conflicts to declare.Acknowledgements
H. W. G. acknowledges financial support from National Natural Science Foundation of China (No. 21373006), the Science and Technology Program of Suzhou (SYG201732). The project was funded by the Priority Academic Program Development of Jiangsu Higher Education Institution (PAPD).Notes and references
- J. M. Tarascon and M. Armand, Nature, 2001, 414, 359–367 CrossRef CAS PubMed.
- M. Winter and J. B. Brodd, Chem. Rev., 2004, 104, 4245–4259 CrossRef CAS PubMed.
- L. H. Tang, Y. Wang, Y. M. Li, H. B. Feng, J. Lu and J. H. Li, Adv. Funct. Mater., 2009, 19, 2782–2789 CrossRef CAS.
- P. G. Bruce, B. Scrosati and J. M. Tarascon, Angew. Chem., Int. Ed., 2008, 47, 2930–2946 CrossRef CAS PubMed; J. A. Gu, B. Li, Z. G. Du, C. Zhang, D. Zhang and S. B. Yang, Adv. Funct. Mater., 2017, 27, 1700840 CrossRef; J. A. Gu, Z. G. Du, C. Zhang, J. G. Ma, B. Li and S. B. Yang, Adv. Energy Mater., 2017, 7, 1700447 CrossRef.
- Z. Chen, Y. Yuan, H. Zhou, X. Wang, Z. Gan, F. Wang and Y. Lu, Adv. Mater., 2014, 26, 339–345 CrossRef CAS PubMed.
- Z. W. Chen, Z. Jiao, D. Y. Pan, Z. Li, M. H. Wu, C. H. Shek, C. M. L. Wu and J. K. L. Lai, Chem. Rev., 2012, 112, 3833–3855 CrossRef CAS PubMed.
- Z. Lyu, L. Yang, D. Xu, J. Zhao, H. Lai, Y. Jiang, Q. Wu, Y. Li, X. Wang and Z. Hu, Nano Res., 2015, 8, 3535–3543 CrossRef CAS.
- H. L. Wang, L. F. Cui, Y. A. Yang, H. S. Casalongue, J. T. Robinson, Y. Y. Liang, Y. Cui and H. J. Dai, J. Am. Chem. Soc., 2010, 132, 13978–13980 CrossRef CAS PubMed.
- R. N. Xue, W. Hong, Z. Pan, W. Jin, H. L. Zhao, Y. H. Song, J. K. Zhou and Y. Liu, Electrochim. Acta, 2016, 222, 838–844 CrossRef CAS.
- C. N. He, S. Wu, N. Q. Zhao, C. S. Shi, E. Z. Liu and J. J. Li, ACS Nano, 2013, 7, 4459–4469 CrossRef CAS PubMed.
- X. H. Rui, H. T. Tan and Q. Y. Yan, Nanoscale, 2014, 6, 9889–9924 RSC.
- C. T. Cherian, M. V. Reddy, S. C. Haur and B. V. Chowdari, ACS Appl. Mater. Interfaces, 2013, 5, 918–923 CAS.
- L. Q. Mai, F. Yang, Y. L. Zhao, X. Xu, L. Xu and Y. Z. Luo, Nat. Commun., 2011, 2, 503–507 CrossRef PubMed.
- S. Peng, L. Li, H. B. Wu, S. Madhavi and X. W. Lou, Adv. Energy Mater., 2015, 5, 1401172 CrossRef.
- R. Ramkumar and M. Minakshi, Dalton Trans., 2015, 44, 6158–6168 RSC.
- Y. Yang, S. Wang, C. Jiang, Q. Lu, Z. Tang and X. Wang, Chem. Mater., 2016, 28, 2417–2423 CrossRef CAS.
- Y. Zhao, X. Li, B. Yan, D. Xiong, D. Li, S. Lawes and X. Sun, Adv. Energy Mater., 2016, 6, 1502175 CrossRef.
- M. C. Liu, L. B. Kong, C. Lu, X. M. Li, Y. C. Luo and L. Kang, Mater. Lett., 2013, 94, 197–200 CrossRef CAS.
- J. Xu, S. Gu, L. Fan, P. Xu and B. Lu, Electrochim. Acta, 2016, 196, 125–130 CrossRef CAS.
- H. Li, W. J. Li, L. Ma, W. X. Chen and J. M. Wang, J. Alloys Compd., 2009, 471, 442–447 CrossRef CAS.
- H. Yu, C. Guan, X. Rui, B. Ouyang, B. Yadian, Y. Huang, H. Zhang, H. R. Hoster, H. J. Fan and Q. Yan, Nanoscale, 2014, 6, 10556–10561 RSC.
- T. Yang, H. N. Zhang, Y. Z. Luo, L. Mei, D. Guo, Q. H. Li and T. H. Wang, Electrochim. Acta, 2015, 158, 327–332 CrossRef CAS.
- J. Xu, S. Z. Gu, L. Fan, P. Xu and B. G. Lu, Electrochim. Acta, 2016, 196, 125–130 CrossRef CAS.
- X. Guan, J. W. Nai, Y. P. Zhang, P. X. Wang, J. Yang, L. R. Zheng, J. Zhang and L. Guo, Chem. Mater., 2014, 26, 5958–5964 CrossRef CAS.
- Y. Sun, Q. Wu and G. Shi, Energy Environ. Sci., 2011, 4, 1113–1132 CAS.
- L. Mei, C. Xu, T. Yang, J. M. Ma, L. B. Chen, Q. H. Li and T. H. Wang, J. Mater. Chem. A, 2013, 1, 8658–8664 CAS.
- E. Yoo, J. Kim, E. Hosono, H. S. Zhou, T. Kudo and I. Honma, Nano Lett., 2008, 8, 2277–2282 CrossRef CAS PubMed.
- O. C. Compton and S. T. Nguyen, Small, 2010, 6, 711–723 CrossRef CAS PubMed.
- M. Zhang, D. N. Lei, X. M. Yin, L. B. Chen, Q. H. Li, Y. G. Wang and T. H. Wang, J. Mater. Chem., 2010, 20, 5538–5543 RSC; J. A. Gu, Z. G. Du, C. Zhang and S. B. Yang, Adv. Energy Mater., 2016, 6, 1600917 CrossRef CAS.
- Y. S. Wang, Y. F. Sun, X. Zhang, Y. H. Wen and J. X. Guo, RSC Adv., 2016, 6, 51710–51715 RSC.
- L. J. Wang, X. H. Cui, L. L. Gong, Z. Y. Lyu, Y. Zhou, W. H. Dong, J. Liu, M. Lai, F. W. Huo, W. Huang, M. Lin and W. Chen, Nanoscale, 2017, 9, 3898–3904 RSC.
- Y. P. Chen, B. R. Liu, W. Jiang, Q. Liu, J. Y. Liu, J. Wang, H. S. Zhang and X. Y. Jing, J. Power Sources, 2015, 300, 132–138 CrossRef CAS.
- X. L. Liu, Y. X. Yang and S. Y. Guan, Chem. Phys. Lett., 2017, 675, 11–14 CrossRef CAS.
- B. Wang, S. M. Li, X. Y. Wu, J. H. Liu, W. M. Tian and J. Chen, New J. Chem., 2016, 40, 2259–2267 RSC.
- L. Jinlong, Y. Meng, K. Suzuki and H. Miura, Microporous Mesoporous Mater., 2017, 242, 264–270 CrossRef.
- M. Prabu, K. Ketpang and S. Shanmugam, Nanoscale, 2014, 6, 3173–3181 RSC.
- C. T. Cherian, M. V. Reddy, S. C. Haur and B. V. R. Chowdari, ACS Appl. Mater. Interfaces, 2013, 5, 918–923 CAS.
- P. Meduri, E. Clark, J. H. Kim, E. Dayalan, G. U. Sumanasekera and M. K. Sunkara, Nano Lett., 2012, 12, 1784–1788 CrossRef CAS PubMed.
- H. Yu, C. Guan, X. H. Rui, B. Ouyang, B. Yadian, Y. Z. Huang, H. Zhang, H. E. Hoster, H. J. Fan and Q. Y. Yan, Nanoscale, 2014, 6, 10556–10561 RSC.
- L. F. Shen, Q. Che, H. S. Li and X. G. Zhang, Adv. Funct. Mater., 2014, 24, 2630 CrossRef CAS.
- W. L. Yao, J. Yang, J. L. Wang and L. Tao, Electrochim. Acta, 2008, 53, 7326 CrossRef CAS.
- L. L. Zhang, D. H. Ge, G. L. Qu, J. W. Zheng, X. Q. Cao and H. W. Gu, Nanoscale, 2017, 9, 5451–5457 RSC; H. B. Geng, J. Yang, Z. F. Dai, Y. Zhang, Y. Zheng, H. Yu, H. W. Wang, Z. Z. Luo, Y. Y. Guo, Y. F. Zhang, H. S. Fan, X. L. Wu, J. W. Zheng, Y. G. Yang, Q. Y. Yan and H. W. Gu, Small, 2017, 13, 1603490 CrossRef CAS PubMed.
Footnotes |
| † Electronic supplementary information (ESI) available. See DOI: 10.1039/c7ra09284a |
| ‡ These authors contribute equally. |
| This journal is © The Royal Society of Chemistry 2017 |

