
 Open Access Article
 This Open Access Article is licensed under a Creative Commons Attribution-Non Commercial 3.0 Unported Licence
Network-based collaborative filtering recommendation model for inferring novel disease-related miRNAs
Changlong Gu a,
Bo Liao*a,
Xiaoying Lia,
Lijun Caia,
Haowen Chena,
Keqin Lib and
Jialiang Yangc
a,
Bo Liao*a,
Xiaoying Lia,
Lijun Caia,
Haowen Chena,
Keqin Lib and
Jialiang Yangc
aCollege of Information Science and Engineering, Hunan University, Changsha, Hunan 410082, China. E-mail: dragonbw@163.com
bDepartment of Computer Science, State University of New York, New Paltz, New York 12561, USA
cDepartment of Genetics and Gnomic Science, Icahn School of Medicine at Mount Sinai, New York 10029, USA
First published on 20th September 2017
Abstract
MicroRNAs (miRNAs) play important roles in the pathogenesis and development of many complex diseases. The experimental confirmation of disease-related miRNAs is costly and time-consuming. An efficient and accurate computational model for identifying potential miRNA–disease associations is a useful supplement for experimental approaches. In this study, we develop a new method for measuring miRNA and disease similarities, which are key issues in identifying miRNA–disease associations, based on normalized mutual information. Subsequently, a network-based collaborative filtering recommendation model, network-based collaborative filtering (NetCF), is proposed for predicting potential miRNA–disease associations by integrating miRNA and disease similarities along with experimentally verified miRNA–disease associations. Leave-one-out cross validation is implemented to evaluate the predicted performance of NetCF. NetCF obtains a reliable AUC value of 0.8960, which is superior to other competitive methods. Implementing NetCF to predict lung cancer and prostate cancer-related miRNAs, 94% of the top 50 predicted miRNAs of each cancer have been confirmed by other databases.
1. Introduction
MicroRNAs (miRNAs) are small non-coding RNA molecules (∼22 nt) that can regulate gene expression at the post-transcriptional level.1 Accumulating evidence indicates that miRNA mutations and dysregulations are closely related to various human diseases,2 including cardiovascular diseases,3 schizophrenia,4 and cancer.5,6 Thus, identification of disease-related miRNAs will be helpful in the diagnosis, treatment, and prevention of diseases. Biological experiment methods such as microarray profiling and qRT-PCR can effectively identify miRNA–disease associations. For instance, Manavalan et al.7 confirmed miRs-10a, 21, 22, 29a, 93, 125b, 181, 200a, 200b, 200c, 205, and 222, which are associated with human breast cancer cells by microarray profiling. Some associations between miRNAs and diseases have been reported over the last few years. A number of researchers have constructed a miRNA–disease association database by collecting data from experiments that support human miRNAs and disease associations from published studies. These databases include HMDD,8 miR2Disease,9 dbDEMC,10,11 and PhenomiR,12 which provide a strong data basis for studying miRNAs. However, only a small amount of miRNA–disease associations have been reported in these databases. Due to the high cost and long time required for the identification of disease-related miRNAs through biological experimental methods, effective computational approaches for predicting disease-related miRNAs received great attention.Several computational models have been developed to infer potential miRNA–disease associations. The aforementioned methods can be divided into two categories: network-based methods and machine-learning-based methods.13
The key problem of network-based methods is predicting that miRNA–disease associations are similar to the calculation among miRNAs and diseases over the networks. Some approaches have been reported to measure miRNA and disease similarities;14–16 Zou et al.17 reviewed the main similarity computation methods. Based on the common assumption that miRNAs are normally associated with phenotypically similar diseases and vice versa, Jiang et al.18 constructed a functionally related miRNA network and a human phenome-miRNAome network to prioritize potential disease-related miRNAs. However, the main limitation of this method is the high number of false positives that are produced in the miRNA target prediction step. To improve predicted performance, Jiang et al.19 subsequently proposed a Naive Bayes model to infer disease-related miRNAs by integrating multiple types of data resources. Some researchers have successfully applied the random walk algorithm to predict miRNA–disease associations.20–22 Based on global network similarity measures, Chen et al.21 constructed a miRNA–miRNA functional similarity network and implemented Random Walk with Restart (RWR) from known disease-related miRNA seed nodes to prioritize potential disease-related miRNAs. By integrating disease–gene associations, miRNA–mRNA interactions, and protein–protein interactions, Shi et al.22 developed an improved method based on RWR to predict disease-related miRNAs and achieved a satisfactory performance with cross validation. Liu et al.20 recently constructed a heterogeneous network by connecting disease and miRNA similarity subnetworks using known miRNA–disease associations and extended RWR method to infer potential miRNA–disease associations in the heterogeneous network. Although the RWR method presented good performance in predicting miRNA–disease associations, it cannot be implemented to diseases without any known associated miRNA. A similarity-based method called network-consistency-based inference (NetCBI) has been proposed by Chen et al.23 to predict miRNA–disease associations. NetCBI can predict disease-related miRNAs when diseases have no known associated miRNA. However, the cross validation exhibited poor performance. Xuan et al.24 presented a novel method (HDMP) after considering the local information of network, based on weighted k where most similar neighbors predict disease-related miRNAs. Cross validation and case studies of HDMP indicate good predicted performance, but it does not work for diseases without known related miRNAs. Furthermore, based solely on gene expression profiles, Zhao et al.25 presented a computational framework to identify the cancer-related miRNAs, and constructed a cancer–miRNA-pathway network, which can help explain how miRNAs are involved in cancer. Recently, Qin et al.26 proposed a method to predict disease-associated miRNAs based on protein domains. The results on real datasets demonstrate the effectiveness of the approach.
Some researchers proposed machine-learning-based methods to predict potential miRNA–disease associations. To distinguish positive miRNA–disease from large-scale negative miRNA–disease associations, Jiang et al.27 extracted a set of features from each positive and negative microRNA–disease association and trained a Support Vector Machine (SVM) classifier to predict novel miRNA–disease associations. Based on miRNA–disease heterogeneous network, Zeng et al.28 used a path-based measure named HeteSim,29 to calculate relevance between objects in the heterogeneous network and combined HeteSim scores with a machine learning method to predict novel miRNA–disease associations. The challenge of using machine-learning-based methods for predicting novel miRNA–disease associations is the difficulty in obtaining negative samples (a miRNA is not associated with a disease). Given that limited trials do not provide enough evidence to prove that miRNA is not associated with a disease, Chen et al.30 proposed the Regularized Least Squares for miRNA–disease Associations (RLSMDA) to prioritize potential miRNA–disease associations without utilizing negative samples. RLSMDA is a semi-supervised classification algorithm that can predict associations for disease without any associated miRNA.
By analyzing the aforementioned methods, the existing computation methods for predicting miRNA–disease associations are restricted by several limitations. First, some methods18 calculated miRNA similarities based on miRNA–mRNA database, and would produce higher false positives in the miRNA target prediction step. Second, some approaches21,23,24,30 calculated miRNA similarity based on the known miRNA–disease associations and evaluated their predicted performance through leave-one-out cross validation (LOOCV). The predicted performance would be overestimated, given that the similarity calculation has included the removal of the miRNA–disease association when LOOCV is performed.13 Third, some methods21,24 cannot be implemented to disease without any known associated miRNA. Finally, some machine-learning-based methods27,28 require negative samples to train classifiers; however, obtaining the negative samples is difficult.
To solve these complications, a network-based collaborative filtering recommend algorithm (NetCF) is proposed to reveal the potential associations between miRNAs and diseases. NetCF integrates miRNA and disease similarities along with the known miRNA–disease associations to reveal potential miRNA–disease associations. NetCF exhibits a clear advantage over other methods, which involve various features, such as LOOCV, case studies, global prediction for all diseases, prediction of disease without any known related miRNA (isolated disease), and prediction of miRNA with no associated disease (novel miRNA).
The main contributions of the paper are summarized as follows.
(1) miRNA similarities are calculated by experimentally verifying miRNA–mRNA interactions to eliminate false positives of the miRNA-target.
(2) miRNA and disease similarities are not dependent on the known miRNA–disease associations, so that LOOCV will not be too high to estimate its predicted performance.
(3) NetCF integrates miRNA- and disease-similarity-based recommendations to predict potential miRNA–disease associations. Therefore, when a disease is not related with any miRNA, the association can be predicted by miRNA-similarity-based recommendation. For the same reason, NetCF can also be applied to predict novel miRNA.
(4) NetCF uses similarity information and known miRNA–disease associations to infer potential miRNA–disease associations without requiring negative sample information.
2. Materials and methods
The flowchart of NetCF and the calculation of the predictive score between miRNA i and disease j are shown in Fig. 1.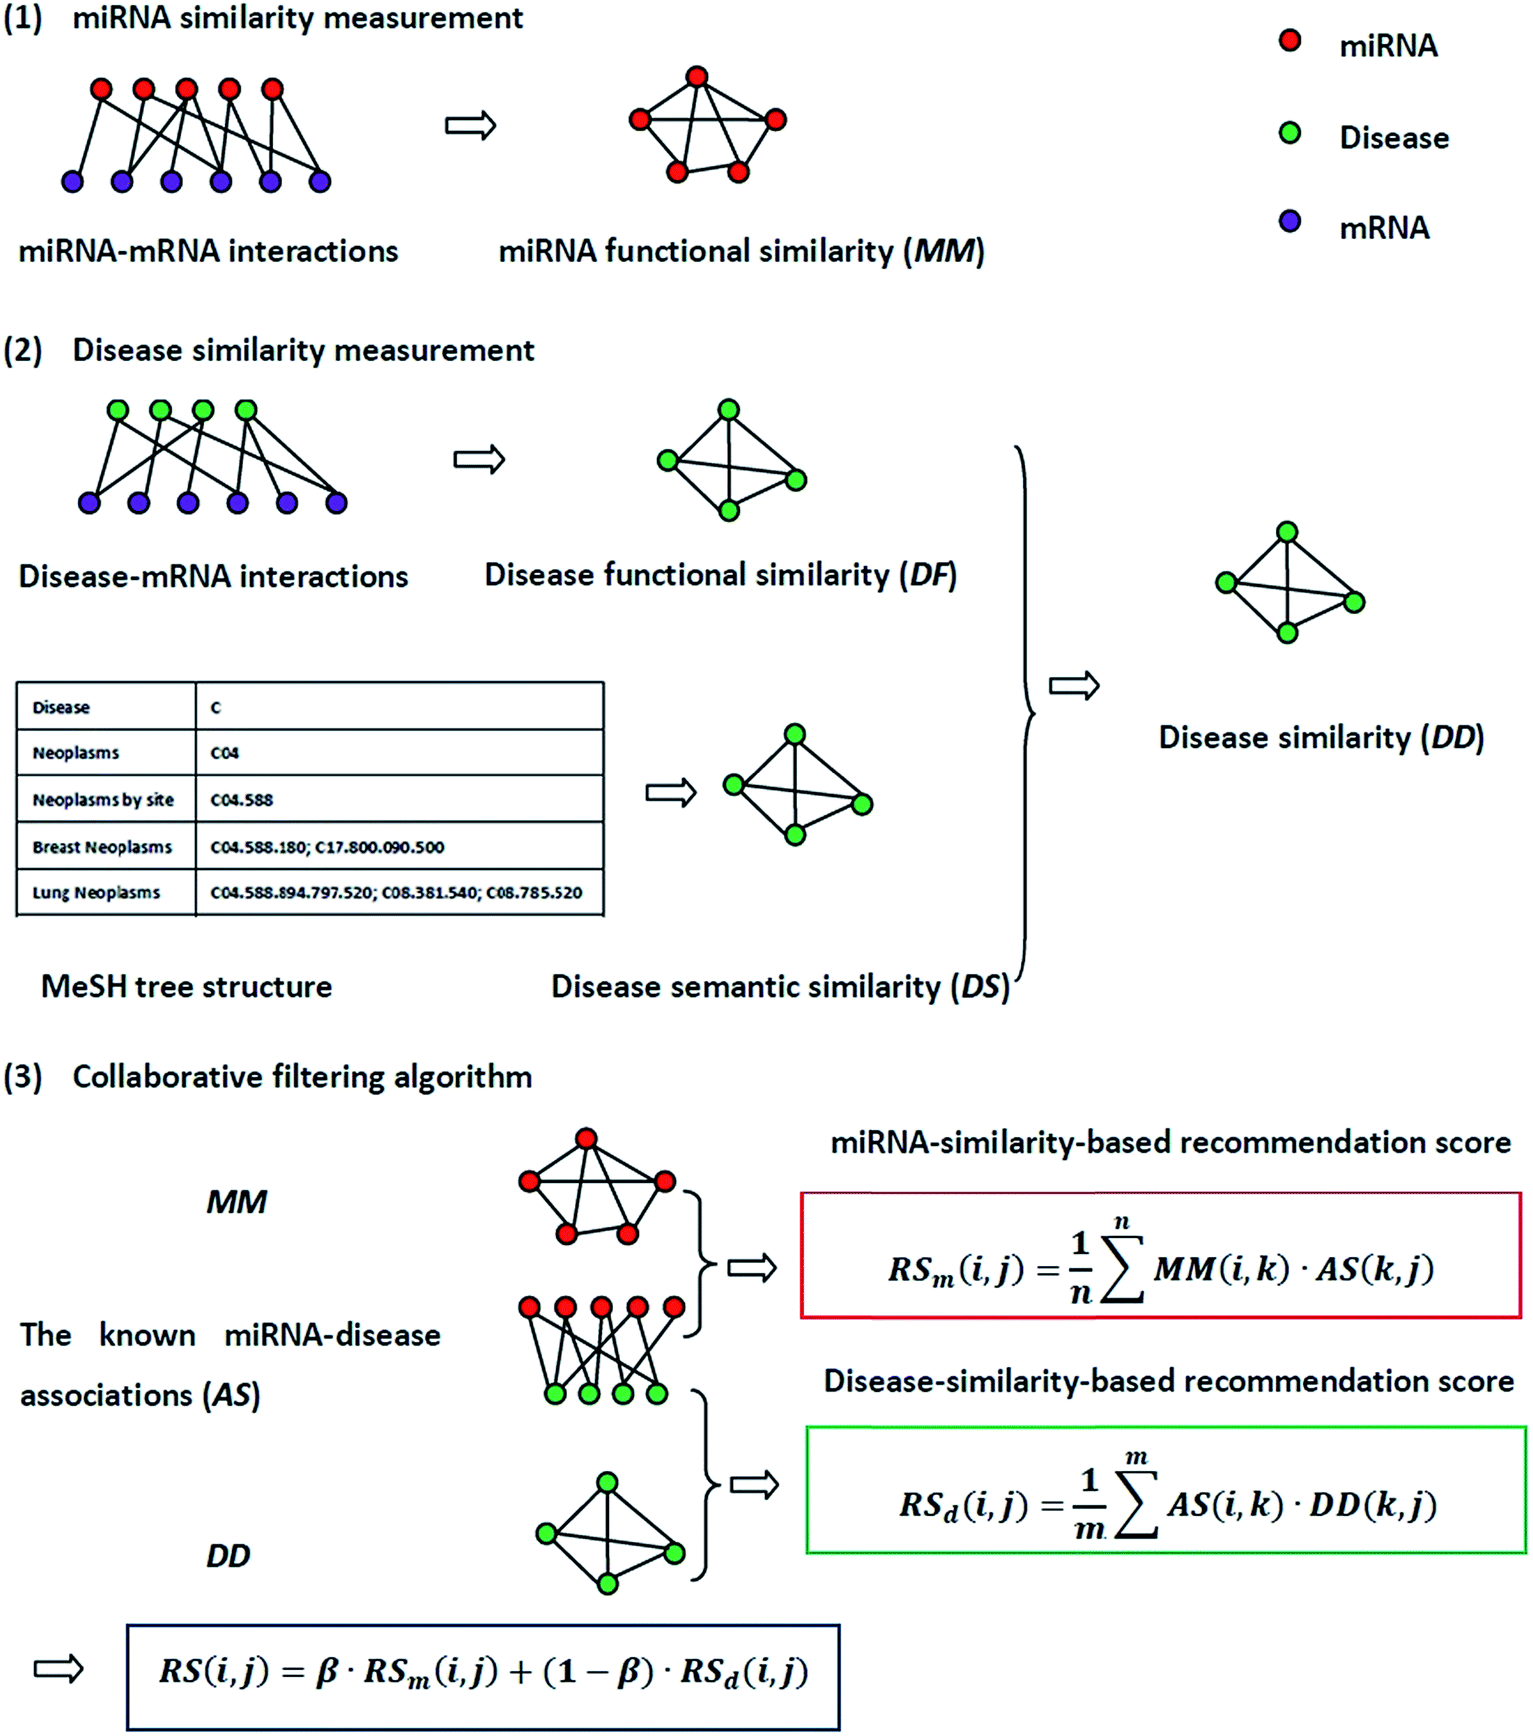 | ||
| Fig. 1 The flowchart of NetCF. NetCF calculates the association score between miRNA i and disease j is divided into three steps: (1) miRNA similarities are calculated based on known miRNA–mRNA interactions. (2) The disease functional similarities are calculated based on the known disease–mRNA interactions, and the disease semantic similarities are calculated based on disease MeSH tree structures, and then they are integrated to obtain disease similarities. (3) Based on the similarity information between miRNA i and their neighbors and the association information between the neighbors and disease j, the miRNA-similarity-based recommendation score between miRNA i and disease j is calculated. Using a similar method to calculate the disease-similarity-based recommendation score, and then they were integrated to obtain the final prediction score. | ||
2.1. Human miRNA–disease associations
The experimentally verified human miRNA–disease associations are downloaded from last updated HMDD database.8 We perform the following operations on these associations. The disease names are mapped to the disease MeSH description (https://www.ncbi.nlm.nih.gov/mesh). Repeated associations and several diseases without any MeSH descriptors or tree numbers are removed. Moreover, the experimentally verified disease-related genes from the DisGeNET database31 are used to calculate disease similarity; thus, the disease names from the DisGeNET database are also mapped to the MeSH description and the diseases not found in the DisGeNET database are removed. After this treatment, 5048 distinct high-quality experimentally verified miRNA–disease associations are obtained, including 475 miRNAs and 334 diseases. We use this dataset as the benchmark dataset and variables nm and nd to represent the number of miRNAs and diseases, respectively. The adjacency matrix of miRNA–disease associations is denoted by matrix AS, whereas the entity AS(i,j) in row i and column j is 1 if miRNA i is associated with disease j, and 0 otherwise.2.2. miRNA similarity measurement
The miRNA and disease similarities calculated based on known miRNA–disease associations overestimate predicted performance when cross validation is implemented. Based on the assumption that miRNAs with similar functions tend to be associated with similar target genes (mRNA), we presented the measurement of the functional similarity of two miRNAs by considering their related target genes. To eliminate false positive miRNA-target, miRNA similarities are calculated using experimentally verified miRNA–mRNA interactions downloaded from the miRTarBase database,32,33 Release 6.1. Let set TmA = {TmA(1),TmA(2),…,TmA(ma)} and set TmB = {TmB(1),TmB(2),…,TmB(mb)} denote the target gene sets of miRNAs A and B, where variables ma and mb are the number of target genes of miRNA A and B, respectively. The information entropy of TmA is defined in eqn (1):
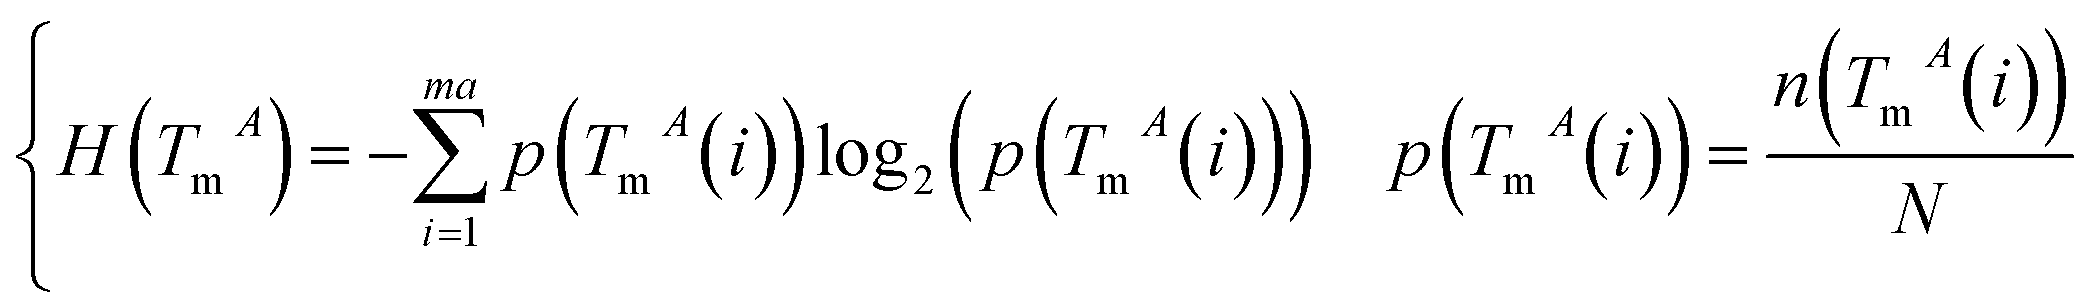 | (1) |
The normalized mutual information (NMI) of TmA and TmB is used to measure the functional similarity of miRNAs A and B:
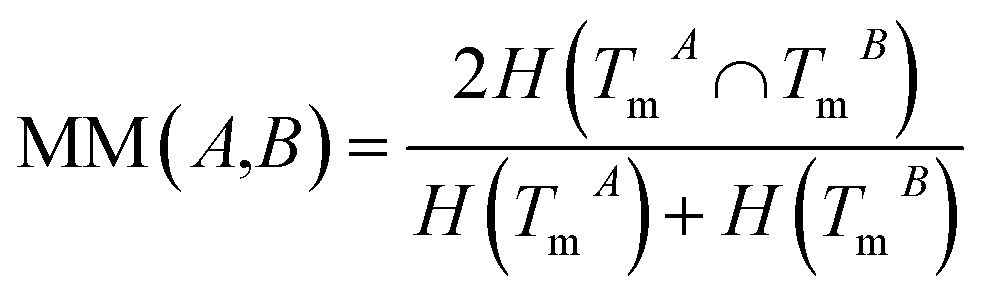 | (2) |
2.3. Disease similarity measurement
Disease similarity is composed of two parts: disease functional and disease semantic similarities.Based on the common assumption that two diseases with similar functions are normally associated with similar target genes, we also used the NMI of two disease-target gene sets to measure their functional similarity. Experimentally-verified disease–mRNA interactions are employed in this study and downloaded from the DisGeNET database. We use sets TdA = {TdA(1),TdA(2),…,TdA(da)} and TdB = {TdB(1),TdB(2),…,TdB(db)} to denote the target gene set of diseases A and B, where da and db refer to the number of target genes of diseases A and B, respectively. Similar to the miRNA function similarity calculation, the NMI of TdA and TdB is used to measure the functional similarity between diseases A and B as follows:
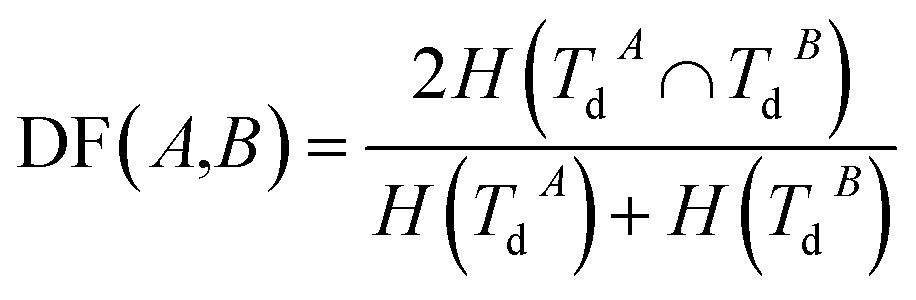 | (3) |
An improved form of Wang's method14 for disease semantic similarity calculation is implemented in this paper. This method calculates disease semantic similarity based on the hierarchical structure of MeSH. A disease can be described as a directed acyclic graph (DAG), in which the nodes represent diseases, whereas the links represent the relationship between nodes. Let DAGd = (d,Td,Ed) denote the DAG graph of disease d, where Td is the node set (all ancestor nodes of disease d including disease d itself) and Ed is the connected edge set. Wang's method defines the semantic contribution of node t ∈ Td as follows:
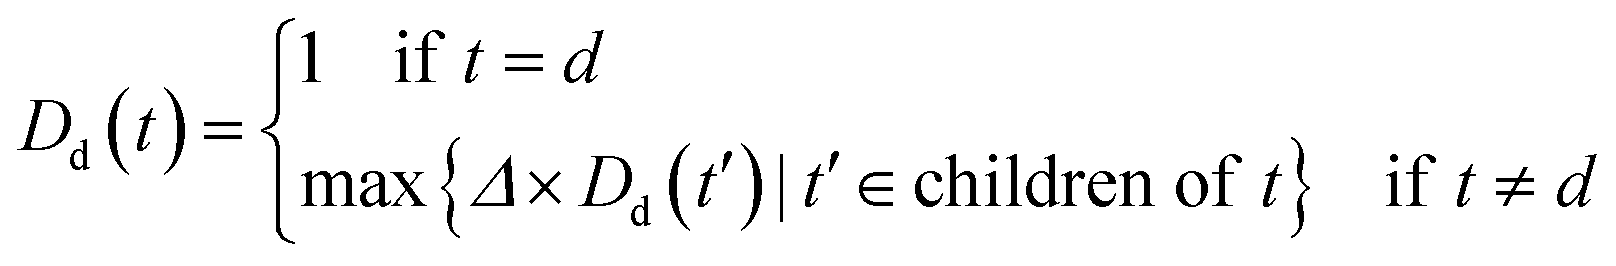 | (4) |
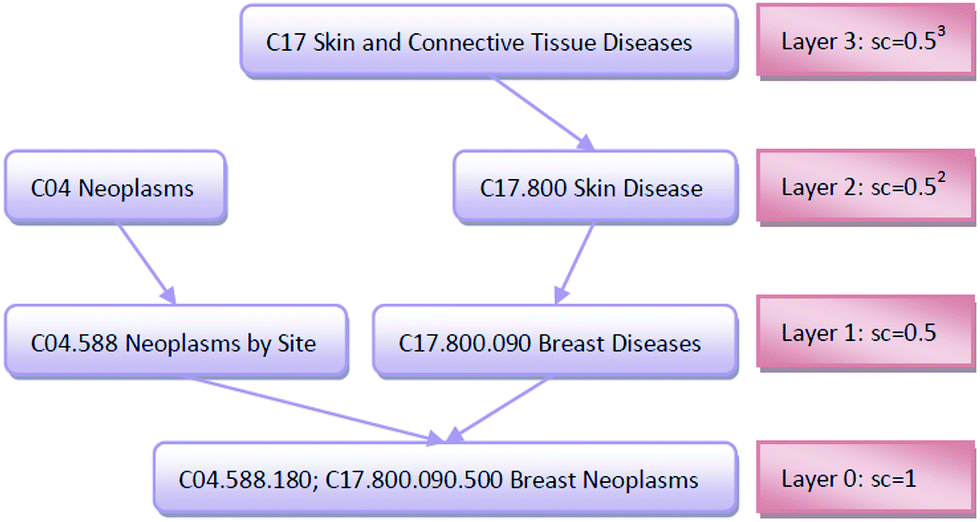 | ||
| Fig. 2 The DAG graph of “Breast Neoplasms” and the semantic contribution values of each node. | ||
The importance of the disease term itself is considered; for example, disease terms “liver neoplasms” and “neoplasms” are specifically described as “liver neoplasms”, such that its semantic contribution value should be greater than the contribution value of “neoplasms.” We use information content (IC) to measure the importance of the disease term itself:
| IC(t) = −log2(p(t)) | (5) |
![[thin space (1/6-em)]](https://www.rsc.org/images/entities/char_2009.gif) 840 disease tree numbers with their corresponding disease terms. The semantic contribution value of disease t is obtained by integrating Dd(t) and IC(t) as Cd(t) = Dd(t) × IC(t). The semantic similarity of diseases A and B can be calculated by their shared ancestors as follows:
840 disease tree numbers with their corresponding disease terms. The semantic contribution value of disease t is obtained by integrating Dd(t) and IC(t) as Cd(t) = Dd(t) × IC(t). The semantic similarity of diseases A and B can be calculated by their shared ancestors as follows:
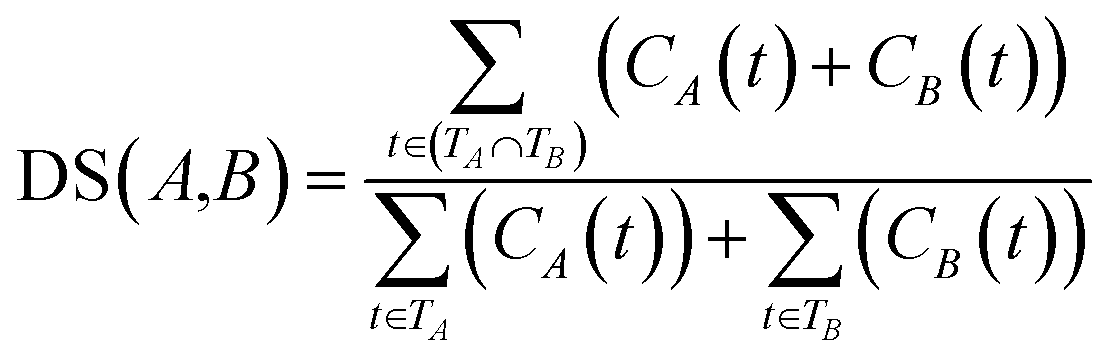 | (6) |
Finally, the similarity between diseases A and B is calculated by integrating disease functional and disease semantic similarities as follows:
| DD(A,B) = αDF(A,B) + (1 − α)DS(A,B) | (7) |
2.4. NetCF
Collaborative filtering (CF) algorithm is one of the most important techniques used by recommender systems,34 and it has enjoyed tremendous success in e-business, marketing, and other personalized recommendation services. CF algorithm generates recommendations or predictions based on observed preferences.35 In this study, by integrating the miRNA similarity, disease similarity, and known miRNA–disease association networks, a NetCF recommendation model is proposed to predict potential miRNA–disease associations. NetCF is implemented in three steps as follows: (1) miRNA-similarity-based recommendation score calculation; (2) disease-similarity-based recommendation score calculation; (3) and the calculation of final predictor score of potential miRNA–disease associations by integrating the results of steps (1) and (2).The detailed implementation procedure of NetCF for calculating the predictor score between miRNA i and disease j is as follows.
First, based on the similarity information between miRNA i and their neighbors and the association information between the neighbors and disease j, the miRNA-similarity-based recommendation score between miRNA i and disease j is calculated. Evidently, if the similarity between a neighbor and miRNA i is extremely small, then the contribution of the neighbor can be ignored. The miRNA-similarity-based recommendation score according to the n most similar neighbors of miRNA i is calculated as follows:
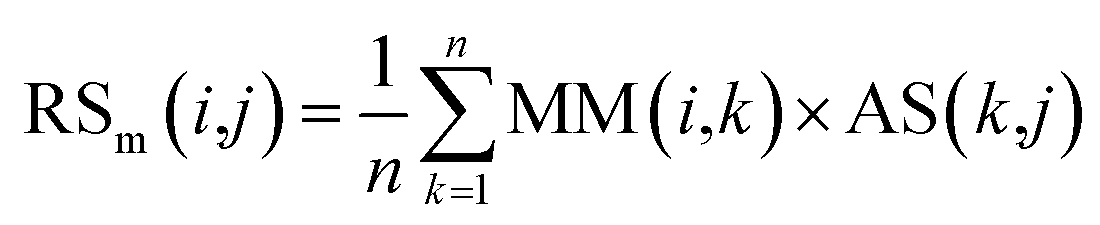 | (8) |
Second, the disease-similarity-based recommendation score between miRNA i and disease j is calculated based on the similarity information between disease j and their neighbors and the association information between the neighbors and miRNA i. For the same reason, the disease-similarity-based recommendation score is calculated by the m most similar neighbors of disease j as follows:
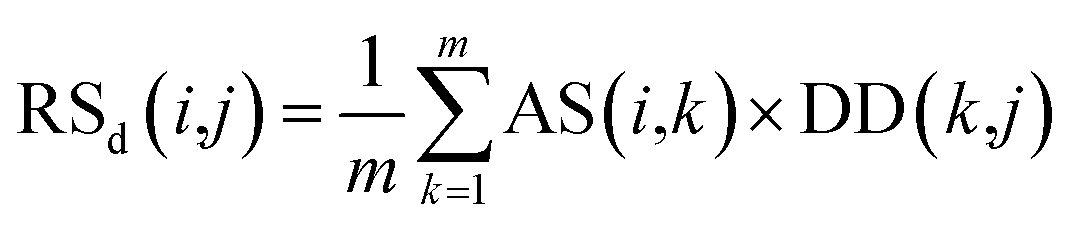 | (9) |
Finally, miRNA- and disease-similarity-based recommendation scores are integrated as the final recommendation score of miRNA i and disease j as follows:
| RS(i,j) = βRSm(i,j) + (1 − β)RSd(i,j) | (10) |
3. Results
3.1. Performance evaluation
The predicted performance of NetCF is compared with the other four state-of-the-art computational models, i.e., Liu's method,20 NetCBI,23 RLSMDA,30 and KATZ.36Using our proposed similarity computation method to measure the similarity of miRNA and disease, LOOCV is implemented on the benchmark dataset; and receiver operating characteristic (ROC) curve and the area under ROC curve (AUC) are adopted to evaluate the predicted performance of NetCF and comparison methods. The four parameters of NetCF are set to α = 0.5, β = nm/(nm + nd), n = 47, and m = 33. Optimal parameters are selected for Liu's method, NetCBI, RLSMDA, and KATZ as described in their literatures. The ROC curves of NetCF and comparison methods are plotted in Fig. 3, and the AUC values are indicated in the legends.
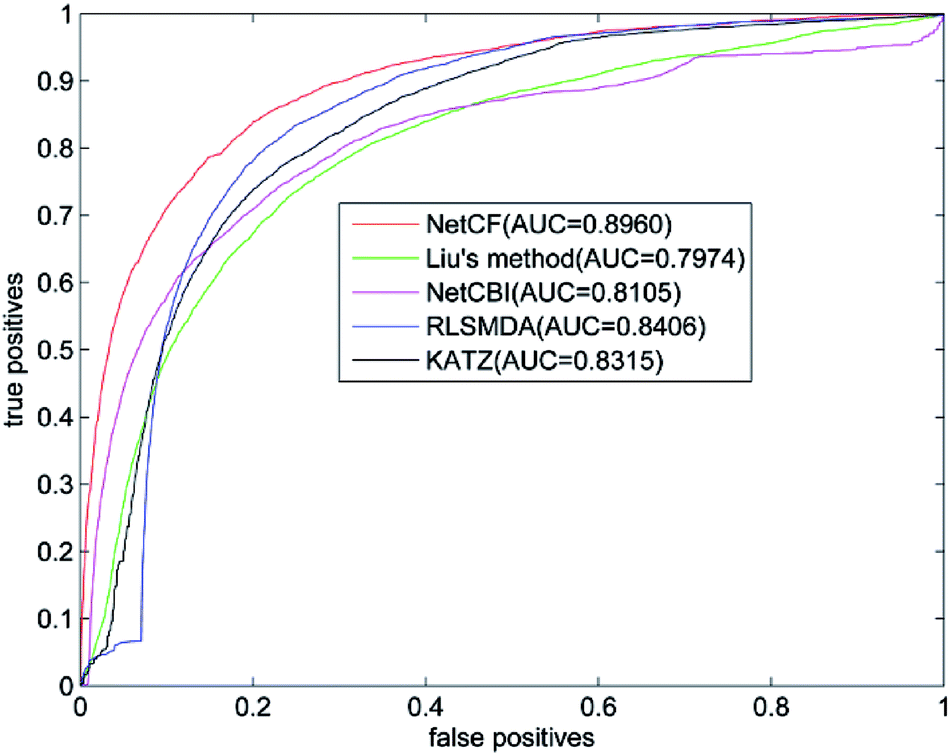 | ||
| Fig. 3 Performance comparisons of NetCF, Liu's method, NetCBI, RLSMDA, and KATZMDA in terms of ROC curves and AUCs based on LOOCV. | ||
The AUC value of NetCF is 0.8960, whereas those of Liu's method, NetCBI, RLSMDA, and KATZ are 0.7974, 0.8105, 0.8406, and 0.8315, respectively. All methods obtained a reliable AUC value when LOOCV is implemented on the benchmark dataset, which proves the rationality of our miRNA and disease similarity measure.
Evidently, NetCF shows better predicted performance compared with Liu's method, NetCBI, RLSMDA, and KATZ.
3.2. Parameters effects
The value of Δ is set to 0.5 according to the suggestion in author's.14 The parameter n represents the number of the most similar neighbors of the query miRNA, and 10% of the number of miRNAs is empirically set. The parameter m is set in the same way. In this section, we mainly discuss the influence of the weight coefficient α and the integrated parameter β on the predictive performance of NetCF. To evaluate the effects of the integrated parameter β, the other parameters are fixed (α = 0.5, Δ = 0.5, n = 47, and m = 33), and the value of parameter β changes from 0.1 to 0.9. Then, according to the optimal β value, the effects of parameter α on NetCF are tested in the same way. The results are shown in Fig. 4. When the parameter α varies from 0.1 to 0.9, the range of AUCs is 0.8927 to 0.8970; and when the parameter β varies from 0.1 to 0.9, the range of AUCs is 0.8732 to 0.8970. Therefore, NetCF is not sensitive to these two parameters. And for the integrated parameter β, we do not want to be too focused on miRNA- or disease-similarity-based recommendation score. In the experiment we set β = nm/(nm + nd), and the other parameters are set to α = 0.5, Δ = 0.5, n = 47, and m = 33.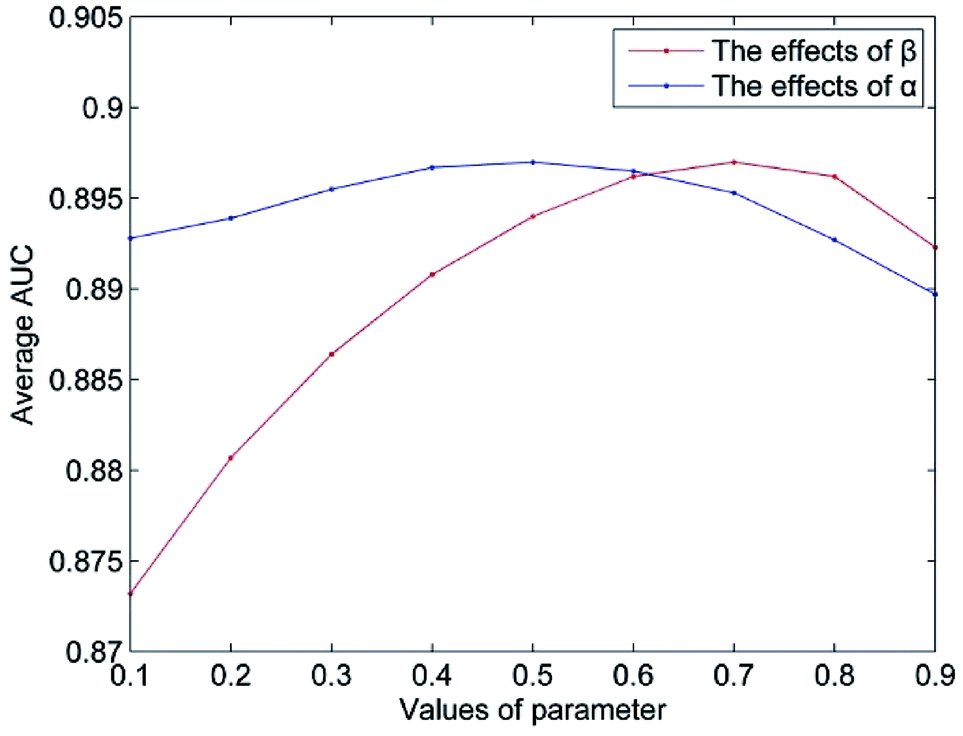 | ||
| Fig. 4 The parameters effects on NetCF. | ||
3.3. Case study
A large number of researchers have indicated that miRNA plays an important role in the development of various forms of cancer from different perspectives. To further evaluate the predicted performance of NetCF for predicting potential disease-related miRNAs, lung and prostate cancers are chosen as case studies. All known associations are used as training set, and recommendation scores are calculated using NetCF. The unknown associations of each disease are ranked according to their recommendation scores, and the top 50 are selected for further validation. The predicted results are verified based on the recently updated dbDEMC10 and PhenomiR12 databases. To explore aberrantly expressed miRNAs in different cancers, the dbDEMC database is used as different experimental designs and data sources. To obtain reliable results, we only chose the results of the experimental conditions “cancer vs. normal” and the data from TCGA (The Cancer Genome Atlas, https://cancergenome.nih.gov/). By collecting data from published studies, the PhenomiR database provides information on differentially regulated miRNA expression in diseases and other biological processes. The top 50 potential lung cancer- and prostate cancer-related miRNAs predicted by NetCF and the confirmation by the dbDEMC and PhenomiR databases are listed in Tables 1 and 2.| Rank | miRNA | Evidences |
|---|---|---|
| 1 | hsa-mir-16 | dbDEMC, PhenomiR |
| 2 | hsa-mir-195 | dbDEMC, PhenomiR |
| 3 | hsa-mir-429 | dbDEMC |
| 4 | hsa-mir-15a | dbDEMC, PhenomiR |
| 5 | hsa-mir-451a | dbDEMC |
| 6 | hsa-mir-141 | dbDEMC, PhenomiR |
| 7 | hsa-mir-106b | dbDEMC, PhenomiR |
| 8 | hsa-mir-449a | PhenomiR |
| 9 | hsa-mir-193b | dbDEMC, PhenomiR |
| 10 | hsa-mir-302d | PhenomiR |
| 11 | hsa-mir-383 | PhenomiR |
| 12 | hsa-mir-20b | dbDEMC, PhenomiR |
| 13 | hsa-mir-194 | dbDEMC, PhenomiR |
| 14 | hsa-mir-130a | dbDEMC, PhenomiR |
| 15 | hsa-mir-151a | dbDEMC |
| 16 | hsa-mir-99a | dbDEMC, PhenomiR |
| 17 | hsa-mir-296 | dbDEMC, PhenomiR |
| 18 | hsa-mir-320a | dbDEMC, PhenomiR |
| 19 | hsa-mir-215 | PhenomiR |
| 20 | hsa-mir-378a | dbDEMC |
| 21 | hsa-mir-15b | dbDEMC, PhenomiR |
| 22 | hsa-mir-153 | dbDEMC, PhenomiR |
| 23 | hsa-mir-328 | dbDEMC, PhenomiR |
| 24 | hsa-mir-149 | dbDEMC, PhenomiR |
| 25 | hsa-mir-302c | PhenomiR |
| 26 | hsa-mir-130b | dbDEMC, PhenomiR |
| 27 | hsa-mir-122 | PhenomiR |
| 28 | hsa-mir-302a | PhenomiR |
| 29 | hsa-mir-449b | PhenomiR |
| 30 | hsa-mir-10a | dbDEMC, PhenomiR |
| 31 | hsa-mir-152 | dbDEMC, PhenomiR |
| 32 | hsa-mir-147 | dbDEMC |
| 33 | hsa-mir-302b | PhenomiR |
| 34 | hsa-mir-204 | dbDEMC, PhenomiR |
| 35 | hsa-mir-181d | dbDEMC, PhenomiR |
| 36 | hsa-mir-139 | dbDEMC, PhenomiR |
| 37 | hsa-mir-372 | PhenomiR |
| 38 | hsa-mir-196b | dbDEMC, PhenomiR |
| 39 | hsa-mir-423 | dbDEMC, PhenomiR |
| 40 | hsa-mir-148b | dbDEMC, PhenomiR |
| 41 | hsa-mir-520g | Unconfirmed |
| 42 | hsa-mir-615 | dbDEMC |
| 43 | hsa-mir-151b | dbDEMC |
| 44 | hsa-mir-373 | PhenomiR |
| 45 | hsa-mir-452 | dbDEMC, PhenomiR |
| 46 | hsa-mir-367 | PhenomiR |
| 47 | hsa-mir-630 | Unconfirmed |
| 48 | hsa-mir-324 | dbDEMC, PhenomiR |
| 49 | hsa-mir-519c | Unconfirmed |
| 50 | hsa-mir-625 | dbDEMC |
| Rank | miRNA | Evidences |
|---|---|---|
| 1 | hsa-mir-18a | dbDEMC, PhenomiR |
| 2 | hsa-mir-155 | PhenomiR |
| 3 | hsa-mir-429 | Unconfirmed |
| 4 | hsa-mir-9 | dbDEMC, PhenomiR |
| 5 | hsa-mir-19b | dbDEMC, PhenomiR |
| 6 | hsa-mir-19a | dbDEMC, PhenomiR |
| 7 | hsa-mir-181a | dbDEMC, PhenomiR |
| 8 | hsa-mir-196a | dbDEMC, PhenomiR |
| 9 | hsa-mir-29c | dbDEMC, PhenomiR |
| 10 | hsa-mir-10b | PhenomiR |
| 11 | hsa-mir-138 | PhenomiR |
| 12 | hsa-mir-24 | dbDEMC, PhenomiR |
| 13 | hsa-mir-7 | dbDEMC, PhenomiR |
| 14 | hsa-mir-210 | dbDEMC, PhenomiR |
| 15 | hsa-mir-150 | PhenomiR |
| 16 | hsa-mir-451a | dbDEMC |
| 17 | hsa-let-7e | dbDEMC, PhenomiR |
| 18 | hsa-mir-30a | dbDEMC, PhenomiR |
| 19 | hsa-mir-125a | dbDEMC, PhenomiR |
| 20 | hsa-mir-149 | dbDEMC, PhenomiR |
| 21 | hsa-mir-103a | dbDEMC |
| 22 | hsa-let-7g | dbDEMC, PhenomiR |
| 23 | hsa-mir-192 | dbDEMC |
| 24 | hsa-mir-186 | dbDEMC, PhenomiR |
| 25 | hsa-mir-140 | dbDEMC |
| 26 | hsa-mir-20b | dbDEMC |
| 27 | hsa-mir-302d | PhenomiR |
| 28 | hsa-mir-128 | dbDEMC, PhenomiR |
| 29 | hsa-mir-328 | dbDEMC, PhenomiR |
| 30 | hsa-mir-215 | dbDEMC, PhenomiR |
| 31 | hsa-mir-383 | dbDEMC, PhenomiR |
| 32 | hsa-mir-26b | dbDEMC, PhenomiR |
| 33 | hsa-mir-302a | PhenomiR |
| 34 | hsa-let-7f | dbDEMC, PhenomiR |
| 35 | hsa-mir-181d | dbDEMC |
| 36 | hsa-mir-142 | PhenomiR |
| 37 | hsa-mir-449b | Unconfirmed |
| 38 | hsa-mir-197 | dbDEMC, PhenomiR |
| 39 | hsa-mir-10a | dbDEMC, PhenomiR |
| 40 | hsa-mir-302b | PhenomiR |
| 41 | hsa-mir-615 | dbDEMC |
| 42 | hsa-mir-365a | dbDEMC |
| 43 | hsa-mir-92b | Unconfirmed |
| 44 | hsa-mir-139 | dbDEMC, PhenomiR |
| 45 | hsa-mir-423 | dbDEMC, PhenomiR |
| 46 | hsa-mir-212 | dbDEMC, PhenomiR |
| 47 | hsa-mir-137 | PhenomiR |
| 48 | hsa-mir-181c | dbDEMC, PhenomiR |
| 49 | hsa-mir-497 | dbDEMC, PhenomiR |
| 50 | hsa-mir-302c | PhenomiR |
The high mortality rate of lung cancer makes it the most common cause of cancer-related death in men and second in women.37 Many researchers have demonstrated that miRNA dysregulation is associated with lung cancer, and in the benchmark dataset, 128 lung cancer-related miRNAs are verified by biological experiments. Unknown lung cancer-related miRNAs are predicted by NetCF. Among the top 50 predicted miRNAs, 47 of them are confirmed by the dbDEMC and PhenomiR databases; and only 3 miRNAs (hsa-mir-520g, hsa-mir-630 and hsa-mir-519c, ranked 41st, 47th and 49th, respectively) are not confirmed. The confirmation of the top 40 predictions is particularly gratifying. Moreover, Cao et al.38 reported that has-mir-630 inhibits cell proliferation of lung cancer by targeting cell-cycle kinase 7 (CDC7); and Cha et al.39 identified has-mir-519c as a tumor suppressor involved in lung cancer progression.
Prostate cancer is the most common cancer in males in 84 countries,37 occurring more commonly in the developed world.
Biological experiments have demonstrated several important associations between prostate cancer and dysregulation of miRNAs. NetCF is implemented to predict potential prostate cancer-related miRNAs. Of the top 50 predicted miRNAs, 47 are confirmed based on the dbDEMC and PhenomiR databases; and only 3 miRNAs (hsa-mir-429, hsa-mir-449b and hsa-mir-92b, ranked third, 37th and 43rd, respectively) are not found in the two databases. Further literature search demonstrated that hsa-mir-429 inhibits cell proliferation by targeting p27Kip1 in human prostate cancer cells.40
3.4. Application of NetCF to predict isolated disease-related miRNAs
An isolated disease refers to a disease without any known associated miRNA. To further evaluate the predicted performance of NetCF for predicting isolated disease-related miRNAs, the recommended scores of potential associations are calculated by removing all known associations related to predicted disease. In other words, we only use the similarity information and known associations of other diseases to predict isolated disease-related miRNAs. Isolated disease-related miRNAs prediction is implemented for lung and prostate cancers with the top 50 potential miRNAs are listed in Tables 3 and 4, respectively. For lung cancer, all top 50 predicted miRNAs are confirmed based on the dbDEMC and PhenomiR databases. For prostate cancer, only 2 miRNAs (hsa-mir-499a and hsa-mir-429, ranked 22nd and 24th) of top 50 predicted results are not found in the two databases; and hsa-mir-429 is confirmed to be associated with prostate cancer by recently published literature.40 Acording to the above description, NetCF exhibits good performance for predicting potential miRNA–disease associations and isolated disease-related miRNAs.| Rank | miRNA | Evidences |
|---|---|---|
| 1 | hsa-mir-16 | dbDEMC, PhenomiR |
| 2 | hsa-mir-15a | dbDEMC, PhenomiR |
| 3 | hsa-mir-195 | dbDEMC, PhenomiR |
| 4 | hsa-mir-141 | dbDEMC, PhenomiR |
| 5 | hsa-mir-151a | dbDEMC |
| 6 | hsa-mir-130a | dbDEMC, PhenomiR |
| 7 | hsa-mir-302b | PhenomiR |
| 8 | hsa-mir-106b | dbDEMC, PhenomiR |
| 9 | hsa-mir-429 | dbDEMC |
| 10 | hsa-mir-296 | dbDEMC, PhenomiR |
| 11 | hsa-mir-122 | PhenomiR |
| 12 | hsa-mir-451a | dbDEMC |
| 13 | hsa-mir-99a | dbDEMC, PhenomiR |
| 14 | hsa-mir-193b | dbDEMC, PhenomiR |
| 15 | hsa-mir-708 | dbDEMC |
| 16 | hsa-mir-378a | dbDEMC |
| 17 | hsa-mir-302c | PhenomiR |
| 18 | hsa-mir-152 | dbDEMC, PhenomiR |
| 19 | hsa-mir-625 | dbDEMC |
| 20 | hsa-mir-204 | dbDEMC, PhenomiR |
| 21 | hsa-mir-15b | dbDEMC, PhenomiR |
| 22 | hsa-mir-149 | dbDEMC, PhenomiR |
| 23 | hsa-mir-328 | dbDEMC, PhenomiR |
| 24 | hsa-mir-20b | dbDEMC, PhenomiR |
| 25 | hsa-mir-129 | dbDEMC, PhenomiR |
| 26 | hsa-mir-139 | dbDEMC, PhenomiR |
| 27 | hsa-mir-302a | PhenomiR |
| 28 | hsa-mir-194 | dbDEMC, PhenomiR |
| 29 | hsa-mir-10a | dbDEMC, PhenomiR |
| 30 | hsa-mir-320a | dbDEMC, PhenomiR |
| 31 | hsa-mir-449a | PhenomiR |
| 32 | hsa-mir-302d | PhenomiR |
| 33 | hsa-mir-196b | dbDEMC, PhenomiR |
| 34 | hsa-mir-148b | dbDEMC, PhenomiR |
| 35 | hsa-mir-215 | PhenomiR |
| 36 | hsa-mir-151b | dbDEMC |
| 37 | hsa-mir-99b | dbDEMC, PhenomiR |
| 38 | hsa-mir-452 | dbDEMC, PhenomiR |
| 39 | hsa-mir-367 | PhenomiR |
| 40 | hsa-mir-342 | dbDEMC, PhenomiR |
| 41 | hsa-mir-373 | PhenomiR |
| 42 | hsa-mir-345 | dbDEMC, PhenomiR |
| 43 | hsa-mir-449b | PhenomiR |
| 44 | hsa-mir-339 | dbDEMC, PhenomiR |
| 45 | hsa-mir-425 | dbDEMC, PhenomiR |
| 46 | hsa-mir-23b | dbDEMC, PhenomiR |
| 47 | hsa-mir-130b | dbDEMC, PhenomiR |
| 48 | hsa-mir-211 | PhenomiR |
| 49 | hsa-mir-92b | PhenomiR |
| 50 | hsa-mir-181d | dbDEMC, PhenomiR |
| Rank | miRNA | Evidences |
|---|---|---|
| 1 | hsa-mir-18a | dbDEMC, PhenomiR |
| 2 | hsa-mir-155 | PhenomiR |
| 3 | hsa-mir-19a | dbDEMC, PhenomiR |
| 4 | hsa-mir-9 | dbDEMC, PhenomiR |
| 5 | hsa-mir-10b | PhenomiR |
| 6 | hsa-mir-210 | dbDEMC, PhenomiR |
| 7 | hsa-mir-19b | dbDEMC, PhenomiR |
| 8 | hsa-mir-181a | dbDEMC, PhenomiR |
| 9 | hsa-mir-7 | dbDEMC, PhenomiR |
| 10 | hsa-mir-138 | PhenomiR |
| 11 | hsa-mir-196a | dbDEMC, PhenomiR |
| 12 | hsa-mir-24 | dbDEMC, PhenomiR |
| 13 | hsa-mir-142 | PhenomiR |
| 14 | hsa-mir-29c | dbDEMC, PhenomiR |
| 15 | hsa-mir-30a | dbDEMC, PhenomiR |
| 16 | hsa-mir-125a | dbDEMC, PhenomiR |
| 17 | hsa-mir-302b | PhenomiR |
| 18 | hsa-mir-199b | dbDEMC, PhenomiR |
| 19 | hsa-let-7i | dbDEMC, PhenomiR |
| 20 | hsa-let-7g | dbDEMC, PhenomiR |
| 21 | hsa-let-7e | dbDEMC, PhenomiR |
| 22 | hsa-mir-499a | Unconfirmed |
| 23 | hsa-mir-150 | PhenomiR |
| 24 | hsa-mir-429 | Unconfirmed |
| 25 | hsa-mir-135a | dbDEMC, PhenomiR |
| 26 | hsa-let-7f | dbDEMC, PhenomiR |
| 27 | hsa-mir-451a | dbDEMC |
| 28 | hsa-mir-192 | dbDEMC |
| 29 | hsa-mir-302c | PhenomiR |
| 30 | hsa-mir-18b | dbDEMC |
| 31 | hsa-mir-139 | dbDEMC, PhenomiR |
| 32 | hsa-mir-103a | dbDEMC |
| 33 | hsa-mir-625 | dbDEMC |
| 34 | hsa-mir-140 | dbDEMC |
| 35 | hsa-mir-20b | dbDEMC |
| 36 | hsa-mir-215 | dbDEMC, PhenomiR |
| 37 | hsa-mir-128 | dbDEMC, PhenomiR |
| 38 | hsa-mir-129 | dbDEMC, PhenomiR |
| 39 | hsa-mir-137 | PhenomiR |
| 40 | hsa-mir-302a | PhenomiR |
| 41 | hsa-mir-10a | dbDEMC, PhenomiR |
| 42 | hsa-mir-149 | dbDEMC, PhenomiR |
| 43 | hsa-mir-26b | dbDEMC, PhenomiR |
| 44 | hsa-mir-328 | dbDEMC, PhenomiR |
| 45 | hsa-mir-497 | dbDEMC, PhenomiR |
| 46 | hsa-mir-30b | dbDEMC, PhenomiR |
| 47 | hsa-mir-302d | PhenomiR |
| 48 | hsa-mir-542 | dbDEMC |
| 49 | hsa-mir-342 | dbDEMC, PhenomiR |
| 50 | hsa-mir-338 | dbDEMC, PhenomiR |
4. Conclusions
Accumulative evidence has indicated that miRNAs play important roles in the pathogenesis and development of many complex diseases. The identification of novel disease-associated miRNAs is an important task in biomedical research, and it is beneficial for an in-depth understanding of disease mechanisms at the miRNA level. As a useful supplement to experimental studies, using computational approaches to identify disease-related miRNAs is beneficial in detecting the functions of miRNA biomarker for disease diagnosis, treatment, and prevention.In this work, we develop a new method for measuring miRNA and disease similarities based on normalized mutual information. This method combines disease associated genes and disease DAG graphs to calculate disease similarity; and it calculates miRNA similarity based on miRNA–mRNA interactions. Given that no known association information is used in the similarity computation process, LOOCV does not overestimate the predicted performance. We then proposed NetCF for predicting new miRNA–disease associations by integrating miRNA and disease similarities with known miRNA–disease associations. Reliable AUC values for all comparable methods demonstrated that our proposed similarity computation method is reasonable and feasible. The AUC value of NetCF is superior to the other comparable methods, which indicates that NetCF has reliable predicted performance. Case studies further demonstrated the good predicted performance of NetCF for predicting potential and isolated disease-related miRNAs.
Even with the favorable results obtained using our method, this study reveals certain limitations. First, miRNA pair similarity is calculated based on the known common target genes because known miRNA–mRNA are scarce; thus, the similarities of many miRNA pairs are 0. The problem will be addressed considering that miRNA-target genes are increasingly recognized. In our future work, we will integrate more miRNA-related data to further improve the miRNA similarity measure. Second, future work should consider parameter optimization. For example, for the numbers of miRNA's neighbors and disease's neighbors, we separately choose 10% of the numbers of miRNAs and diseases based on experiments. This selection works well in our dataset, but not necessarily for other datasets.
Conflicts of interest
There are no conflicts to declare.Acknowledgements
This work is supported by the Program for National Nature Science Foundation of China (61672214, 61672223, 61572178, 61370171 and 61472127).References
- S. Chatterjee and H. Grosshans, Nature, 2009, 461, 546–549 CrossRef CAS PubMed.
- J. T. Mendell and E. N. Olson, Cell, 2012, 148, 1172–1187 CrossRef CAS PubMed.
- E. M. Small and E. N. Olson, Nature, 2011, 469, 336–342 CrossRef CAS PubMed.
- W. Shi, J. Du, Y. Qi, G. Liang, T. Wang, S. Li, S. Xie, B. Zeshan and Z. Xiao, J. Psychiatr. Res., 2012, 46, 198–204 CrossRef PubMed.
- E. N. Olson, Sci. Transl. Med., 2014, 6(239), 239ps3 CrossRef PubMed.
- Y. W. Kong, D. Ferland-McCollough, T. J. Jackson and M. Bushell, Lancet Oncol., 2012, 13, e249–258 CrossRef CAS PubMed.
- T. T. Manavalan, Y. Teng, S. N. Appana, S. Datta, T. S. Kalbfleisch, Y. Li and C. M. Klinge, Cancer Lett., 2011, 313, 26–43 CrossRef CAS PubMed.
- Y. Li, C. Qiu, J. Tu, B. Geng, J. Yang, T. Jiang and Q. Cui, Nucleic Acids Res., 2014, 42, D1070–D1074 CrossRef CAS PubMed.
- Q. Jiang, Y. Wang, Y. Hao, L. Juan, M. Teng, X. Zhang, M. Li, G. Wang and Y. Liu, Nucleic Acids Res., 2009, 37, D98–D104 CrossRef CAS PubMed.
- Z. Yang, L. Wu, A. Wang, W. Tang, Y. Zhao, H. Zhao and A. E. Teschendorff, Nucleic Acids Res., 2017, 45, D812–D818 CrossRef PubMed.
- Z. Yang, F. Ren, C. Liu, S. He, G. Sun, Q. Gao, L. Yao, Y. Zhang, R. Miao, Y. Cao, Y. Zhao, Y. Zhong and H. Zhao, BMC Genomics, 2010, 11(4), S5 CrossRef CAS PubMed.
- A. Ruepp, A. Kowarsch, D. Schmidl, F. Buggenthin, B. Brauner, I. Dunger, G. Fobo, G. Frishman, C. Montrone and F. J. Theis, Genome Biol., 2010, 11, R6 CrossRef PubMed.
- X. X. Zeng, X. Zhang and Q. Zou, Briefings Bioinf., 2016, 17, 193–203 CrossRef PubMed.
- D. Wang, J. Wang, M. Lu, F. Song and Q. Cui, Bioinformatics, 2010, 26, 1644–1650 CrossRef CAS PubMed.
- J. Freudenberg and P. Propping, Bioinformatics, 2002, 18(2), S110–S115 CrossRef PubMed.
- M. A. van Driel, J. Bruggeman, G. Vriend, H. G. Brunner and J. A. Leunissen, Eur. J. Hum. Genet., 2006, 14, 535–542 CAS.
- Q. Zou, J. Li, L. Song, X. Zeng and G. Wang, Briefings Funct. Genomics, 2016, 15, 55–64 Search PubMed.
- Q. Jiang, Y. Hao and G. Wang, et al., BMC Syst. Biol., 2010, 4(1), S2 CrossRef PubMed.
- Q. Jiang, G. Wang and Y. Wang, An approach for prioritizing disease-related microRNAs based on genomic data integration, Biomedical Engineering and Informatics (BMEI), 2010 3rd International Conference On. IEEE, 2010, vol. 6, pp. 2270–2274 Search PubMed.
- Y. Liu, X. Zeng, Z. He and Q. Zou, IEEE/ACM Trans. Comput. Biol. Bioinf., 2016 DOI:10.1109/TCBB.2016.2550432.
- X. Chen, M. X. Liu and G. Y. Yan, Mol. BioSyst., 2012, 8, 2792–2798 RSC.
- H. Shi, J. Xu and G. Zhang, et al., BMC Syst. Biol., 2013, 7(1), 101 CrossRef PubMed.
- H. Chen and Z. Zhang, BMC Med. Genomics, 2013, 6, 12 CrossRef CAS PubMed.
- P. Xuan, K. Han and M. Guo, et al., PloS one, 2013, 8(8), e70204 CAS.
- X. M. Zhao, K. Q. Liu, G. H. Zhu, F. He, B. Duval, J. M. Richer, D. S. Huang, C. J. Jiang, J. K. Hao and L. N. Chen, Bioinformatics, 2015, 31, 1226–1234 CrossRef PubMed.
- G. M. Qin, R. Y. Li and X. M. Zhao, IEEE/ACM Trans. Comput. Biol. Bioinf., 2016, 13, 1027–1035 CrossRef PubMed.
- Q. Jiang, G. Wang, S. Jin, Y. Li and Y. Wang, International journal of data mining and bioinformatics, 2013, 8, 282–293 CrossRef PubMed.
- X. X. Zeng, X. Zhang, Y. L. Liao and L. Q. Pan, Biochim. Biophys. Acta, Gen. Subj., 2016, 1860, 2735–2739 CrossRef CAS PubMed.
- C. Shi, X. N. Kong, Y. Huang, P. S. Yu and B. Wu, IEEE Transactions on Knowledge and Data Engineering, 2014, 26, 2479–2492 CrossRef.
- X. Chen and G. Y. Yan, Sci. Rep., 2014, 4 DOI:10.1038/srep05501.
- J. Pinero, N. Queralt-Rosinach and A. Bravo, et al., Database, 2015, 2015 DOI:10.1093/database/bav028.
- S. D. Hsu, Y. T. Tseng, S. Shrestha, Y. L. Lin, A. Khaleel, C. H. Chou, C. F. Chu, H. Y. Huang, C. M. Lin, S. Y. Ho, T. Y. Jian, F. M. Lin, T. H. Chang, S. L. Weng, K. W. Liao, I. E. Liao, C. C. Liu and H. D. Huang, Nucleic Acids Res., 2014, 42, D78–D85 CrossRef CAS PubMed.
- S. D. Hsu, F. M. Lin, W. Y. Wu, C. Liang, W. C. Huang, W. L. Chan, W. T. Tsai, G. Z. Chen, C. J. Lee, C. M. Chiu, C. H. Chien, M. C. Wu, C. Y. Huang, A. P. Tsou and H. D. Huang, Nucleic Acids Res., 2011, 39, D163–D169 CrossRef CAS PubMed.
- F. Ricci, L. Rokach and B. Shapira, Introduction to recommender systems handbook, Springer, 2011 Search PubMed.
- Y. Zhou, B. Song and H. T. Zheng, Exploiting Latent Relations Between Users and Items for Collaborative Filtering, International Conference on Neural Information Processing, Springer, Cham, 2015, pp. 365–374 Search PubMed.
- Q. Zou, J. Li and Q. Hong, et al., BioMed Res. Int., 2015, 2015 DOI:10.1155/2015/810514.
- S. McGuire, Adv. Nutr., 2016, 7, 418–419 CrossRef PubMed.
- J. X. Cao, Y. Lu, J. J. Qi, G. S. An, Z. B. Mao, H. T. Jia, S. Y. Li and J. H. Ni, Cell Death Discovery, 2014, 5, e1426 CrossRef CAS PubMed.
- S. T. Cha, P. S. Chen, G. Johansson, C. Y. Chu, M. Y. Wang, Y. M. Jeng, S. L. Yu, J. S. Chen, K. J. Chang, S. H. Jee, C. T. Tan, M. T. Lin and M. L. Kuo, Cancer Res., 2010, 70, 2675–2685 CrossRef CAS PubMed.
- Y. Ouyang, P. Gao, B. Zhu, X. Chen, F. Lin, X. Wang, J. Wei and H. Zhang, Mol. Med. Rep., 2015, 11, 1435–1441 CrossRef CAS PubMed.
| This journal is © The Royal Society of Chemistry 2017 |