
 Open Access Article
 This Open Access Article is licensed under a
 Creative Commons Attribution 3.0 Unported Licence
Arsine adsorption in copper-exchanged zeolite under low temperature and micro-oxygen conditions
Xueqian Wang,
Yingjie Zhang,
Ping Ning *,
Shudi Yan,
Langlang Wang and
Qiang Ma
*,
Shudi Yan,
Langlang Wang and
Qiang Ma
Faculty of Environmental Science and Engineering, Kunming University of Science and Technology, Kunming 650500, China. E-mail: ningping_58@163.com
First published on 15th December 2017
Abstract
Arsenic pollution is a worldwide issue. Nearly all arsenic is converted to arsine (AsH3) under the reducing atmosphere required for the gasification process. Growing industrialization has increased AsH3 emissions, for example, the ore smelting process leads to AsH3 emissions. The conditions used in the ore smelting process are low temperature and micro-oxygen. A series of Hβ zeolites loaded on different metal oxides has been prepared using an impregnation method and tested for adsorption of arsine (AsH3) under low temperature and micro-oxygen conditions. Based on the results obtained from the adsorbent optimization experiments, Hβ zeolite modified with Cu(NO3)2 (denoted as Cu/Hβ) was found to possess a significantly enhanced adsorption removal ability towards arsine. The effects of the impregnation concentration, calcination temperature, reaction temperature, and oxygen content on the AsH3 removal process were investigated. The results indicate that adsorbents with 0.2 mol L−1 Cu(NO3)2 after calcination at 400 °C have superior activity for AsH3 removal. In addition, a breakthrough capacity of 43.7 mg AsH3/g adsorbent at 60 °C as well as 1.0% oxygen was observed with Cu/Hβ for the AsH3 adsorption process. The structure and surface properties of the Hβ zeolite samples were characterized by N2-BET (N2 adsorption/desorption), XRD (X-ray powder diffraction), XPS (X-ray photoelectron spectroscopy), and FTIR (Fourier transform infrared) spectroscopy. It is feasible that the exhausted Cu/Hβ can be regenerated by thermal desorption, and the adsorbents can be recycled at least two times with little capacity loss.
1. Introduction
Arsine (AsH3) is a hydrophobic, very volatile, and highly poisonous gas, which plays an important role in the cycling of arsenic on earth. AsH3 released in the air commonly arises from various sources such as the processes in which arsenic-containing metals react with acids, coal gasification, yellow phosphorus tail gas, and the burning of fossil fuels at high temperatures.1–6 For example, ore smelting flue gas includes reducing gaseous pollutants such as AsH3 and H2S; however, arsenic emissions during the ore smelting process have not received adequate attention due to the micro-oxygen and low temperature conditions used; thus, these emissions have been easily overlooked despite their toxicity.37 The toxicity of AsH3 is about seven times higher than that of lewisite.7 AsH3 can enter the body through skin, respiratory tract or the digestive tract, which can easily induce severe human health hazards including serious damage to the lungs, respiratory tract, bronchus, and kidneys as well as cancer.8 Thus, the concentration of AsH3 in the workshop has been strictly limited in many countries. For instance, the permissible exposure limit of AsH3 should be between 0.016 mg m−3 and 0.001 mg m−3, which has been defined by the American Committee of government in Health and the Ministry of Environmental Protection of the People's Republic of China, respectively.9 Furthermore, synthesis gas can be used to produce C1 chemical products with the development of C1 chemical technology. However, the most important factors of synthesis catalyst poisoning is the existence of many impurities such as sulfur, phosphorus, arsenic, and cyanide in synthesis gas.10,11 Therefore, the removal of AsH3 has a profound significance.In general, the methods for removing AsH3 from air and off-gas include chemical adsorption, catalytic decomposition, combustion, and adsorption. However, catalytic decomposition and combustion are typically employed at high temperatures. Adsorption is one of the most mature and promising methods because of its ease of operation, flexible design, low temperature condition, and low-cost, and it is more appropriate for the removal of AsH3 at low concentrations. Adsorption technology was chosen to accomplish the required removal of contaminants. Although numerous materials have been reported as adsorbents for the effective removal of AsH3, high operating temperatures are typically required.12–18 For instance, Poulston et al. have reported that Pd can be used to modify Al2O3 for the adsorption of AsH3 from simulated flue gas at temperatures between 204 °C and 288 °C.19 Jiang et al. found that activated carbon modified with sulfonated cobalt phthalocyanine (CoPcS) and Cu(NO3)2 was able to adsorb AsH3 efficiently, and the AsH3 adsorption capacity was 35.7 mg g−1 adsorbent at 60 °C and a 4% oxygen content.20 However, some shortcomings with the present activated carbons have been identified including their thermal instability.21 On the other hand, zeolite materials have been found to have broad applications in various fields including as a catalyst support as well as in the development of adsorbents due to their stable structures, large specific surface area, well-developed porous structure, and high thermal stability.22 However, the possibility of removing AsH3 using zeolite dry adsorption has not been studied to date. Thus, Hβ zeolite was chosen as the adsorbent support in this study.
The objective of this study was to investigate the adsorption behavior of the modified zeolite adsorbents under low temperature and micro-oxygen conditions and to explore the adsorption mechanism of AsH3 adsorption removal. Herein, the adsorbents were prepared using an impregnation method, and the effects of the experimental conditions, including the types of impregnant, impregnation concentration, calcination temperature, reaction temperature, and oxygen content, were explored; this allowed us to obtain the optimal adsorption purification conditions for AsH3. The pore structure properties of the Cu/Hβ zeolite adsorbents before and after AsH3 adsorption were measured using N2-BET analysis. The phase and crystalline orientation of Cu/Hβ were determined using XRD analysis. XPS was employed to evaluate the chemical states of the elements in Cu/Hβ before and after AsH3 adsorption. Functional group and chemical bonding in the Cu/Hβ adsorbents were determined using FTIR spectroscopy.
2. Materials and methods
2.1 Sample preparation
Hβ zeolite prepared from the commercial zeolite (99.99%, Nankai University Catalyst Co., Ltd., Tianjin, China) was used as a support material for metal adsorbents in our experiments. Cu(NO3)2, Fe(NO3)3·9H2O, Zn(NO3)2·6H2O, Ni(NO3)2·6H2O, Mn(NO3)2, and Pb(Ac)2·3H2O were used as impregnates to improve the adsorption performance of the Hβ zeolite. M–Hβ (M = metal) zeolites were prepared using an impregnation method. At first, the Hβ zeolite was crushed and sieved with a 40–60 mesh size. The Hβ zeolite support (10 ± 0.1 g) was washed three times with 150 mL of distilled water at 70 °C to remove the soluble impurities and then dried at 110 °C for 12 h. Subsequently, the Hβ zeolite was impregnated with an aqueous Cu(NO3)2 solution (0.2 mol L−1, 50 mL), an aqueous Fe(NO3)3·9H2O solution (0.2 mol L−1, 50 mL), an aqueous Zn(NO3)2·6H2O solution (0.2 mol L−1, 50 mL), an aqueous Ni(NO3)2·6H2O solution (0.2 mol L−1, 50 mL), an aqueous Mn(NO3)2 solution (0.2 mol L−1, 50 mL) or an aqueous Pb(NO3)2 solution (0.2 mol L−1, 50 mL) at ambient temperature. Then, impregnation was carried out under stirring for 24 h, and the adsorbent was filtered from the reaction solution. The filtered adsorbent was dried at 110 °C for 12 h followed by calcination in a muffle furnace at a specified temperature for 6 h. Finally, the resulting samples were cooled down to ambient temperature and denoted as Cu/Hβ, Fe/Hβ, Zn/Hβ, Ni/Hβ, Mn/Hβ, and Pb/Hβ.2.2 Fixed-bed adsorption experiment
The model gas was composed of nitrogen with 70 ppm AsH3, which was mixed in the mixer evenly with micro-oxygen and subsequently introduced into the adsorption bed unit. This adsorption reaction was conducted in a quartz columnar reactor with a 9 mm inner diameter and 60 mm length under atmospheric pressure. The AsH3 breakthrough curves for AsH3 removal were assessed using dynamic tests at temperatures between 20 and 80 °C with an oxygen content between 0% and 2%. Each sample (0.4 g) was added to the quartz column and exposed to the gas containing 70 ppm AsH3 at a flow rate of 200 mL min−1, and the experiment was stopped when the adsorbent was saturated. AsH3 was adsorbed readily in potassium permanganate to avoid any safety problems. The concentration of AsH3 was measured using a silver diethyldithiocarbamate spectrophotometric method. The breakthrough time was defined as the time at which the AsH3 outlet concentration reached 5% of the inlet concentration according to the breakthrough curves. The adsorption capacity of AsH3 was calculated with the corresponding integral according to the following equation under various conditions of the breakthrough curves.23where X is the adsorption capacity in mg g−1, Q denotes the gas flow rate in m3 min−1, t represents the adsorption time in minutes, C0 represents the adsorption column entrance mass concentration of AsH3 in mg m−3, C represents the adsorption column outlet mass concentration of AsH3 in mg m−3, and m is the mass of adsorption in g obtained from the breakthrough curves.
2.3 Sample characterization
The pore size distribution, specific surface area, and pore volume of the samples were measured using the nitrogen adsorption/desorption isotherms obtained at 77 K using a NOVA 2000e (Quanta chrome instruments) surface area analyzer. The specific surface area was determined using the Brunauer–Emmett–Teller (BET) equation. The pore size distribution was evaluated using the Barrett–Joyner–Halenda (BJH) method. X-ray diffraction (XRD) patterns were obtained using a Rigaku diffractometer (D/MAX-2200), which was operated under the conditions of 36 kV and 30 mA using Ni-filtered Cu-Kα radiation (λ = 0.15406 nm) at a rate of 5° min−1 from 2θ = 5–80°. X-ray photoelectron spectroscopy (XPS) was carried out using an ESCALAB 250 spectrometer, in which the X-ray source was operated with an Al-Kα radiation source with a photo-energy of hν = 1361 eV. The core-level binding energy of the C 1s peak (284.8 eV) was used for calibration. Fourier transform infrared (FTIR) spectroscopy spectra were obtained using the KBR pellet technique via a Thermo spectrometer in the wavenumber range between 4000 and 300 cm−1.3. Results and discussion
3.1 Characterization of the samples
 | ||
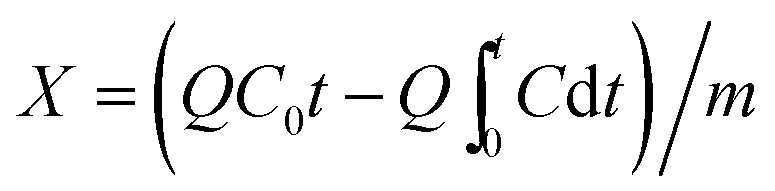
| Fig. 1 The nitrogen adsorption/desorption isotherms obtained for Hβ zeolite and the Cu(NO3)2 modified samples before and after AsH3 adsorption. | ||
 | ||
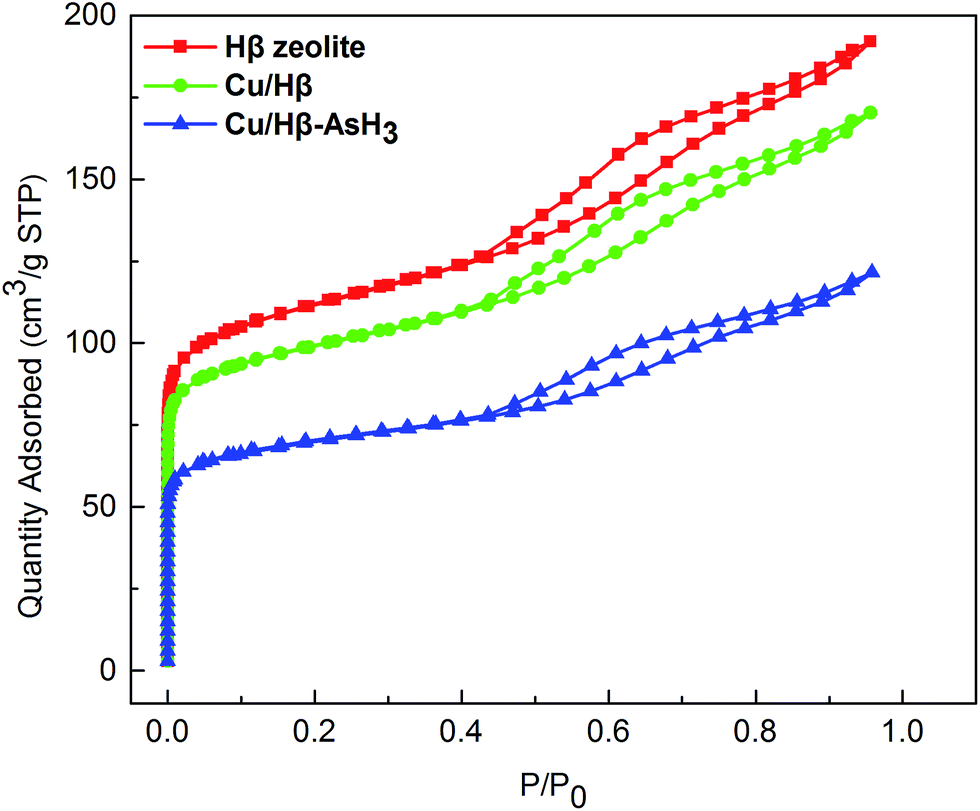
| Fig. 2 The pore size distributions of Hβ zeolite and the Cu(NO3)2-modified samples before and after AsH3 adsorption. | ||
| Samples | SBET (m2 g−1) | Vmicro (cm3 g−1) | Vtotal (cm3 g−1) | Daverage (nm) |
|---|---|---|---|---|
| Hβ zeolite | 416.6 | 0.1080 | 0.2094 | 2.2322 |
| Cu/Hβ | 371.6 | 0.0993 | 0.1826 | 2.2866 |
| Cu/Hβ–AsH3 | 263.4 | 0.0730 | 0.1271 | 2.4291 |
According to the IUPAC classification,26 the nitrogen adsorption–desorption isotherms of all the samples studied belong to the IUPAC type IV classification, suggesting that the adsorbents are mesoporous materials, and the capillary condensation phenomenon may occur in their pore channels. As illustrated in Fig. 1, the N2 adsorption capacity of the plain Hβ zeolite seems to be greater than that of the Cu/Hβ and Cu/Hβ–AsH3 samples; this is probably because the pores of Cu/Hβ and Cu/Hβ–AsH3 are partially covered by the active ingredient, and the surface area reduces. Furthermore, the hysteresis loop shifts in the relative pressure range of 0.4–1.0, which is a typical characteristic of mesoporous structures. It is considered that the position of the inflection point of P/P0 relates to a diameter in the mesoporous range, and the sharpness of the step shows the uniformity of the mesoporous size distribution.
The pore size distribution curves in Fig. 2 show that all the samples have pores in the radius range of 1.5–4.5 nm; this further confirms that all the samples are mesoporous. It can also be observed that the volume of the mesopores decreases in the order of Hβ zeolite > Cu/Hβ > Cu/Hβ–AsH3. This is because the pores are blocked by the active ingredients during the impregnation process and the products after the reaction; this ultimately leads to a decrease in the pore volume.
Detailed information on the textural properties of these samples is provided in Table 1. As illustrated in Table 1, when compared with Hβ zeolite, the Cu/Hβ and Cu/Hβ–AsH3 samples show that the impregnation process causes a decrease in the volume of pore radius in the range of 1.5–4.5 nm. The surface areas of the Cu/Hβ and Cu/Hβ–AsH3 samples were found to be 10.8% and 36.8% lower, and the volumes of the samples seemed to decrease by 12.8% and 39.3%, respectively.
As is well known, the presence of a large pore size is considered as fundamental for zeolite materials used in the field of adsorbents. These pore structures can provide more adsorption sites. Moreover, the AsH3 molecules can easily pass through the pore structures and enter the interior of the Hβ zeolite; this is beneficial to improve the amount of AsH3 adsorption on the Hβ zeolite.
 | ||
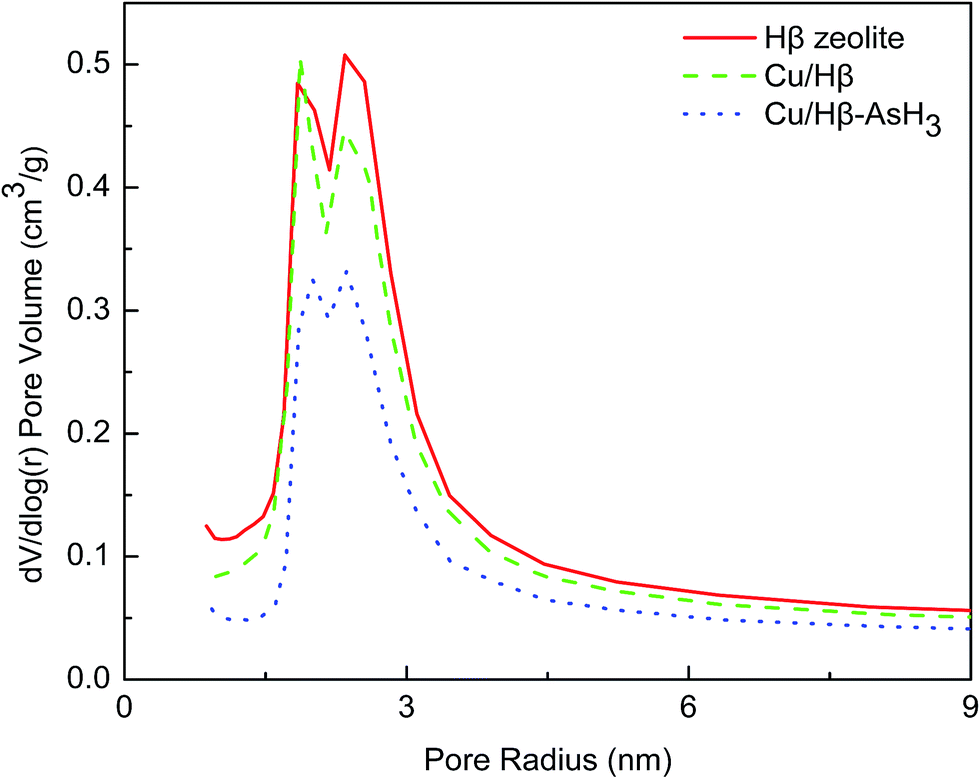
| Fig. 3 The XRD patterns obtained for the Cu/Hβ zeolites prepared with different impregnation concentrations of Cu2+. | ||
 | ||
| Fig. 4 The XPS spectra obtained for (a) Cu/Hβ and (b) Cu/Hβ–AsH3. | ||
Fig. 5 shows the XPS spectra of the core-level binding energies in Cu 2p (b) before and after the adsorption of AsH3 as well as As 2p (a) after the adsorption of AsH3. The XPS data of the Cu 2p and As 2p spectra and their possible statuses before and after AsH3 adsorption are listed in Table 2. As noted in Fig. 5 and Table 2, the main Cu 2p3/2 peak centers are located at 935.5 eV in the presence of a small satellite peak centers located at 943.9 eV and assigned to CuO,27 which is consistent with the XRD results shown in Fig. 3. In addition, the XPS analysis of As 2p for Cu/Hβ–AsH3 was also conducted to clarify the reaction products. Fig. 5 illustrates that the As 2p peak is centered at 1328.2 eV, indicating the possible presence of As2O5.28 The As species appearing in Cu/Hβ–AsH3 are likely to be formed via an oxidation process. Freshly prepared Cu/Hβ adsorbent shows no signs of As species, whereas after adsorption, it clearly contains As species.
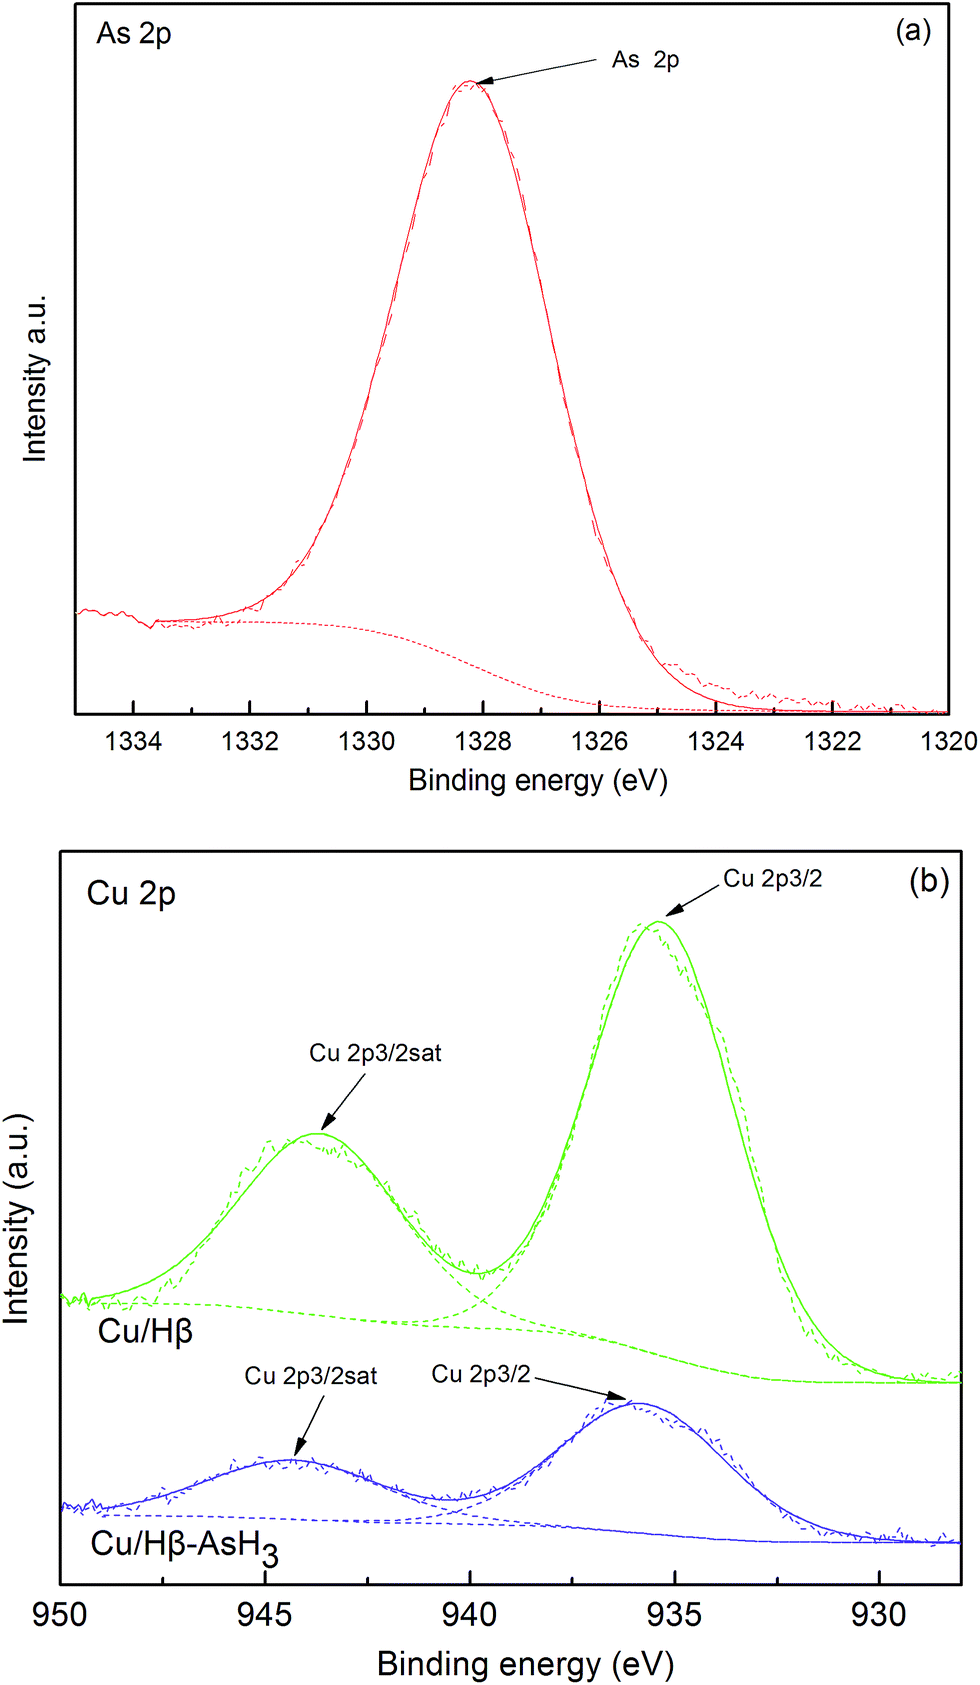 | ||
| Fig. 5 The XPS spectra obtained for (a) As 2p and (b) Cu 2p. | ||
| Element status | Cu/Hβ | Cu/Hβ–AsH3 | |||
|---|---|---|---|---|---|
| CuO | CuO | As2O5 | |||
| Binding energy (eV) | Cu 2p3/2, 935.31 | Cu 2p3/2sat, 943.64 | Cu 2p3/2, 935.74 | Cu 2p3/2sat, 944.28 | As 2p3/2, 1328.15 |
| fwhm (eV) | 4.198 | 4.628 | 4.821 | 4.932 | 3.174 |
| Doublet separation (eV) | 8.33 | 8.54 | |||
| Calculated As percentage (%) | — | — | — | — | 100 |
On the basis of the abovementioned XPS results, it was confirmed that Cu(NO3)2 played a very important role in the AsH3 adsorption process, in which AsH3 seemed to be fixed on the surface of the zeolite. There is no doubt that a higher quantity of As2O5 has been formed on the Cu/Hβ sample when compared with the case of the plain Hβ zeolite. These results suggest that Cu/Hβ may participate in the catalytic oxidation reaction during the process when zeolite adsorbs AsH3.
 | ||
| Fig. 6 The FTIR spectra obtained for (a) Cu/Hβ and (b) Cu/Hβ–AsH3. | ||
In Fig. 6, we can see a broad strong adsorption band at 3438 cm−1, which can be attributed to the ν(O–H) stretching vibrations of water or phenolic hydroxyl groups associated with hydrogen bonds and carboxylic groups.29–32 The broad band centered at 1632 cm−1 can be assigned to the δOH bending vibration of H2O molecules in the interlayer spaces.33 The band at around 1382 cm−1 was the IR characteristic peak of NO3−, which originated from (Cu(NO3)2) used in the adsorbent preparation process.25 It may be inferred that a small amount of nitrate may not decompose during the calcination step performed at 400 °C for 6 h. Another broad peak in the 700–1200 cm−1 region with a maximum at about 1095.78 cm−1 and a weak shoulder peak appearing at about 1228.71 cm−1 can be assigned to C–O vibrations of alcohol groups.34 The band at 620 cm−1 was assigned to coupled Al–O and Si–O out-of-plane vibrations.35 The spectra of the samples have absorption bands characteristic of amorphous silica (790 cm−1), which confirm that the zeolite structure is not decomposed.35 The bands appearing below 600 cm−1 can be assigned to the M–OH and M–O lattice vibration modes,36 and the peaks observed at 464.25 cm−1 and 568.13 cm−1 are due to ν(CuO) vibrations.35 The abovementioned results are consistent with the conclusions obtained from the XRD patterns; the characteristic feature of the zeolite has not been destroyed and CuO is formed at a calcination temperature of 400 °C. The IR spectra of the adsorbents (Cu/Hβ-400 °C, Cu/Hβ-400 °C–AsH3) are similar; however, in the case after AsH3 adsorption, the vibrations at 3438.45, 1632.44, and 1228.71 cm−1 (corresponding to O–H, δOH, and C–O, respectively) have been obviously diminished. This may be a result of the involvement of these functional groups and chemical bonds in the AsH3 adsorption process, thus leading to a change in the intensity of these functional groups.
3.2 Performance of the adsorbents
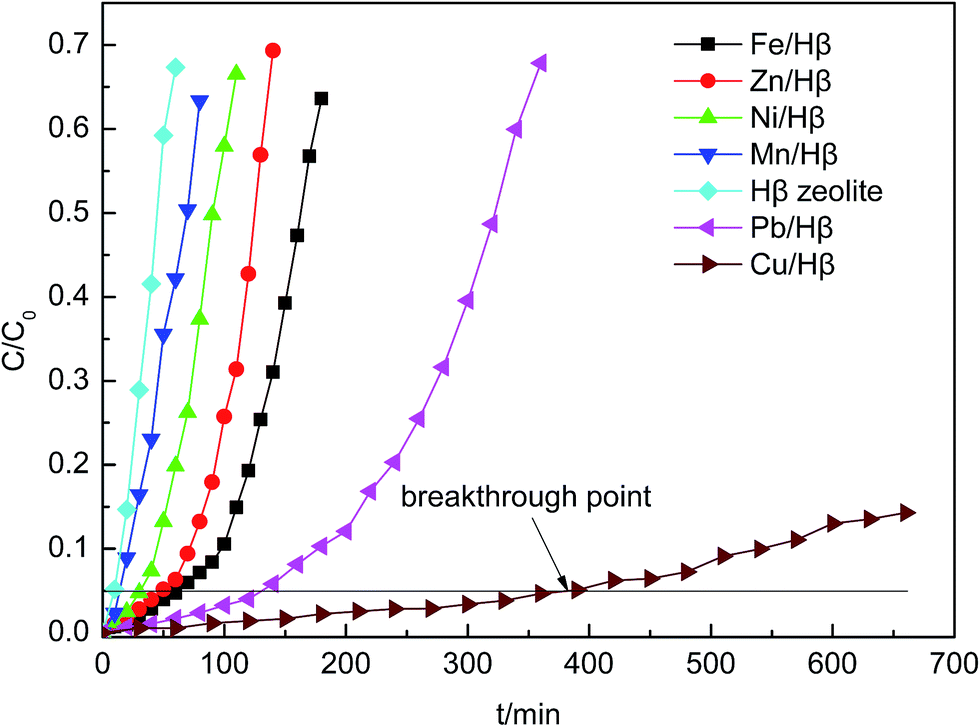 | ||
| Fig. 7 The AsH3 breakthrough curves obtained for the different adsorbents at 60 °C with 1.0% O2 (AsH3 inlet concentration = 200 mg m−3, calcination temperature = 300 °C and impregnation concentration = 0.2 mol L−1). | ||
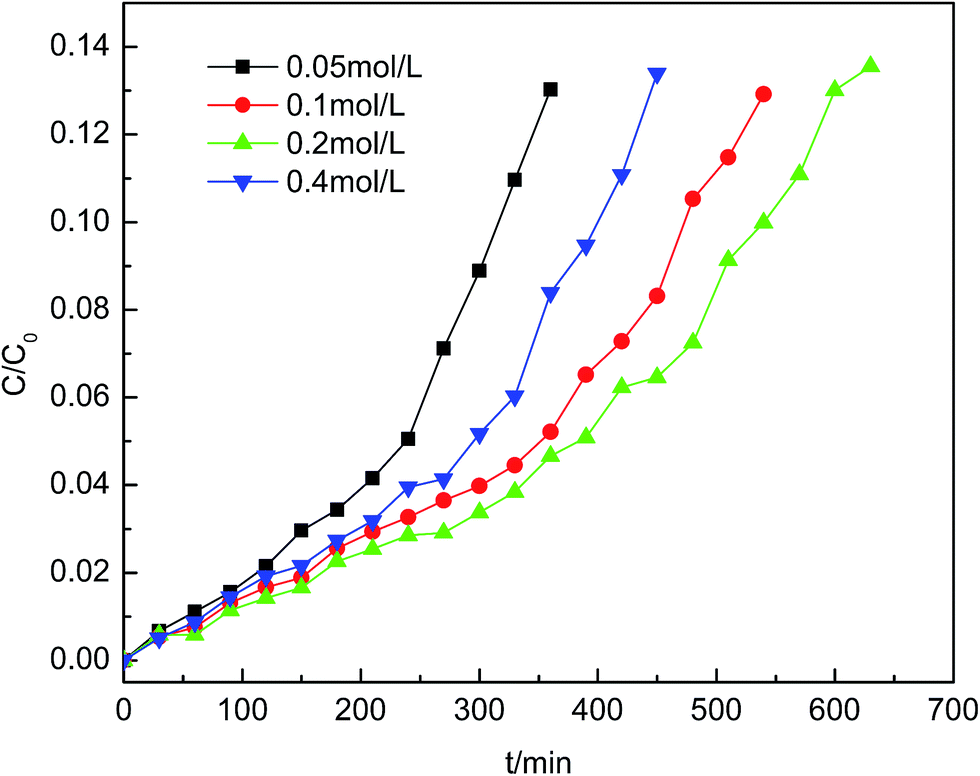 | ||
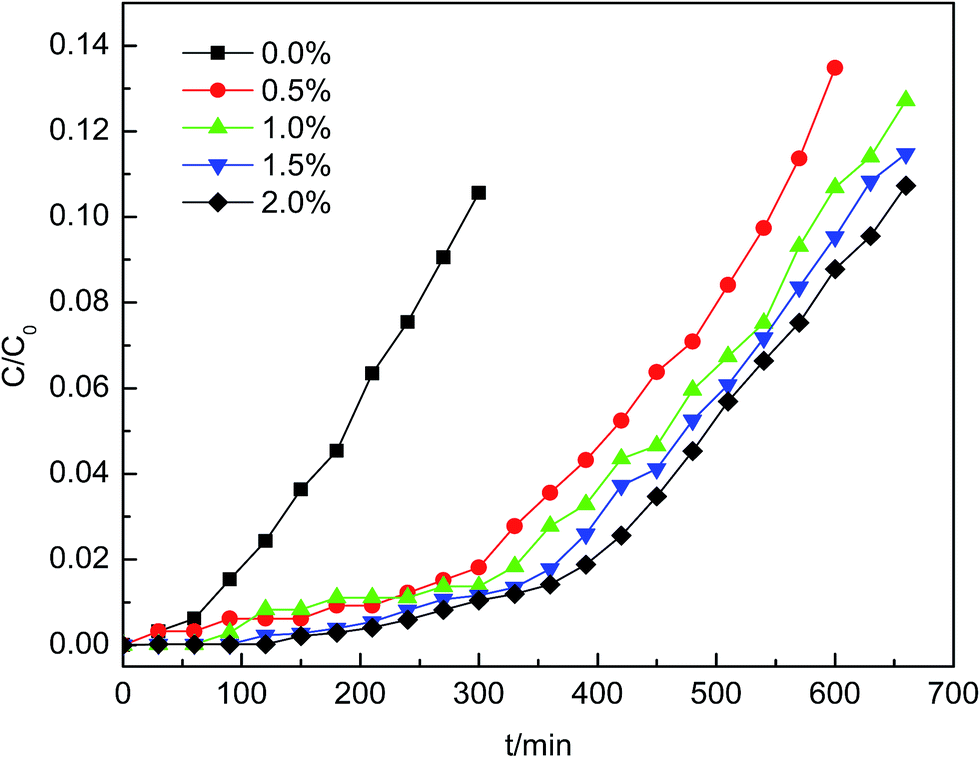
| Fig. 8 The AsH3 breakthrough curves obtained for the samples prepared with different concentrations of Cu(NO3)2 loaded on the Hβ zeolite at 60 °C with 1.0% O2 (AsH3 inlet concentration = 200 mg m−3 and calcination temperature = 300 °C). | ||
To evaluate the performance of the adsorbents, the actual Cu metal loadings of adsorbents were measured using inductively coupled plasma (ICP) analysis. As the impregnation concentration of Cu(NO3)2 was increased from 0.05 to 0.4 mol L−1, the copper element loading amount increased linearly. The sample of copper-exchanged zeolite with better efficiency was impregnated with 0.2 mol L−1 Cu2+ and had a Cu loading amount of 10.87 wt%.
 | ||
| Fig. 9 The AsH3 breakthrough curves obtained for the samples prepared at different calcination temperatures at 60 °C with 1.0% O2 (AsH3 inlet concentration = 200 mg m−3 and impregnation concentration = 0.2 mol L−1). | ||
 | ||
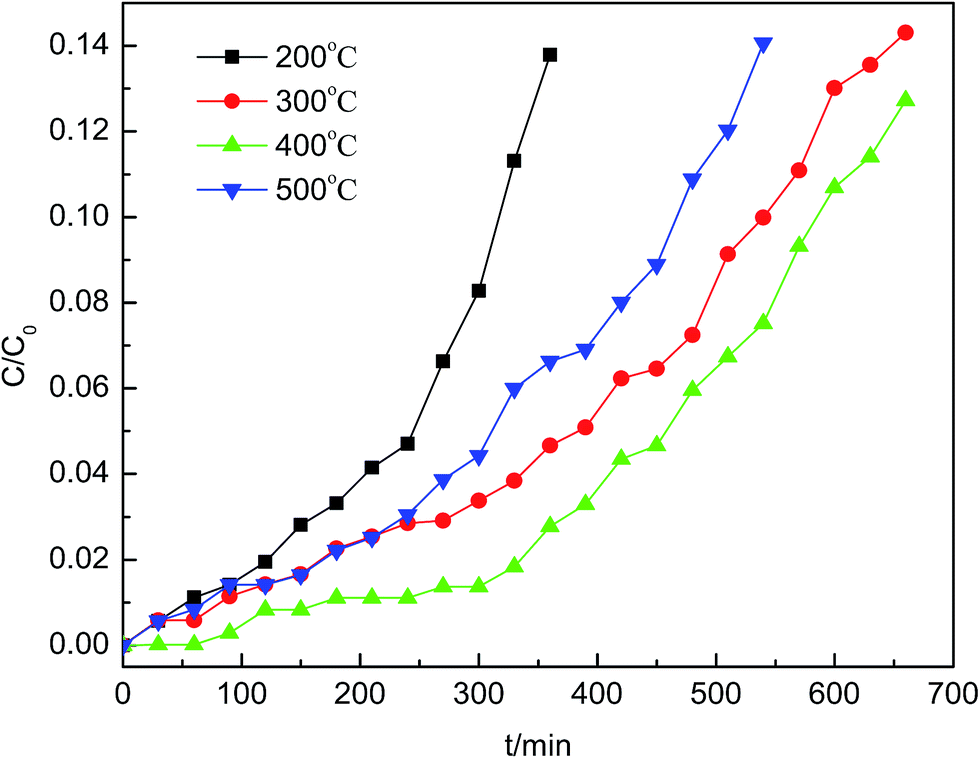
| Fig. 10 The AsH3 breakthrough curves obtained for a Cu/Hβ fixed bed as a function of the reaction temperature in the presence of 1.0% O2 (AsH3 inlet concentration = 200 mg m−3, impregnation concentration = 0.2 mol L−1 and calcination temperature = 400 °C). | ||
 | ||
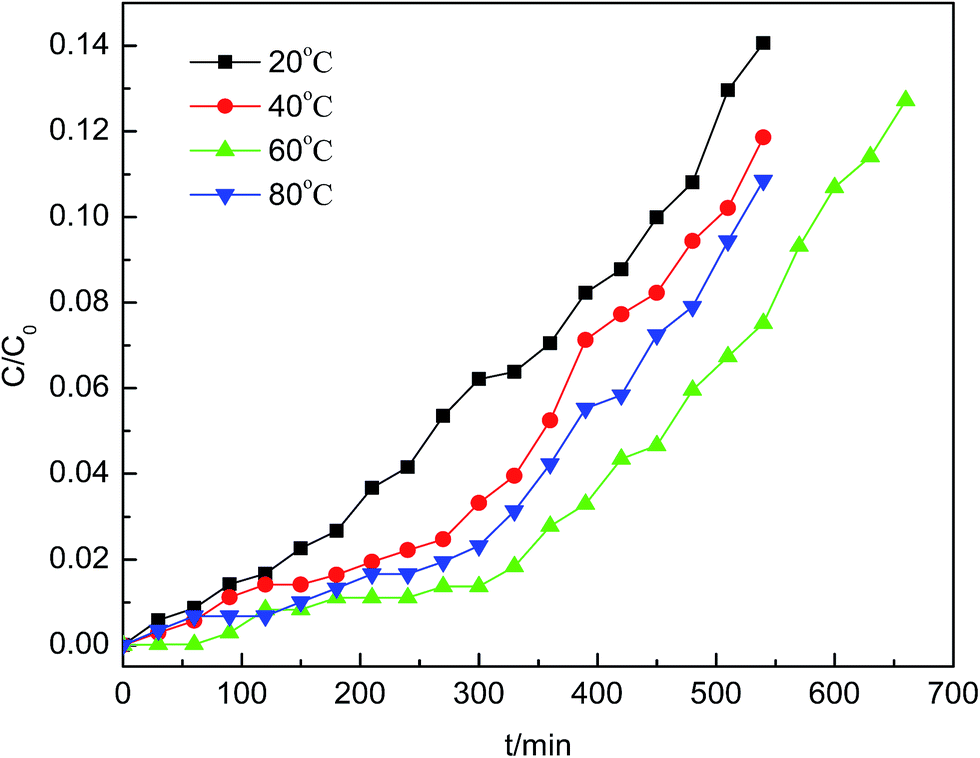
| Fig. 11 The AsH3 breakthrough curves obtained for a Cu/Hβ fixed bed at 60 °C as a function of the oxygen content (AsH3 inlet concentration = 200 mg m−3, impregnation concentration = 0.2 mol L−1 and calcination temperature = 400 °C). | ||
3.3 Thermal regeneration
Heating the adsorbents and then blowing with a nitrogen flow were performed in the spent adsorbent regeneration experiments. The Cu/Hβ–AsH3 sample was first reactivated for 4 h under hot air and washed with distilled water to a constant pH after cooling down to room temperature. The second step was to dry the sample at 110 °C for 5 h. Finally, the dried sample was heated at 300 °C for 3 h under N2 at a flow rate of 30 mL min−1 in the tube furnace and then cooled down to room temperature. Fig. 12 shows the AsH3 breakthrough behavior of Cu/Hβ, which has been used in the AsH3 breakthrough test with subsequent thermal regeneration (the sample is referred to as Cu/Hβ-R1, Cu/Hβ-R2, and Cu/Hβ-R3). The generation efficiency of adsorbents and the regeneration time were the two key parameters used to investigate the adsorbent regeneration performance. When compared with that of fresh Cu/Hβ, the adsorption behaviors of the spent adsorbents (Cu/Hβ-R1) were similar and the breakthrough time remained as long as 430 min. However, Cu/Hβ-R2 and Cu/Hβ-R3 displayed a shorter breakthrough time than Cu/Hβ-R1. Despite the adsorption reaction being carried on for 290 min, the adsorption efficiency of Cu/Hβ-R3 for AsH3 still remained above 95%. This result indicated that the regeneration thermal desorption was effective, and the Cu/Hβ zeolite adsorbent could be recycled at least two times with a slight loss in capacity.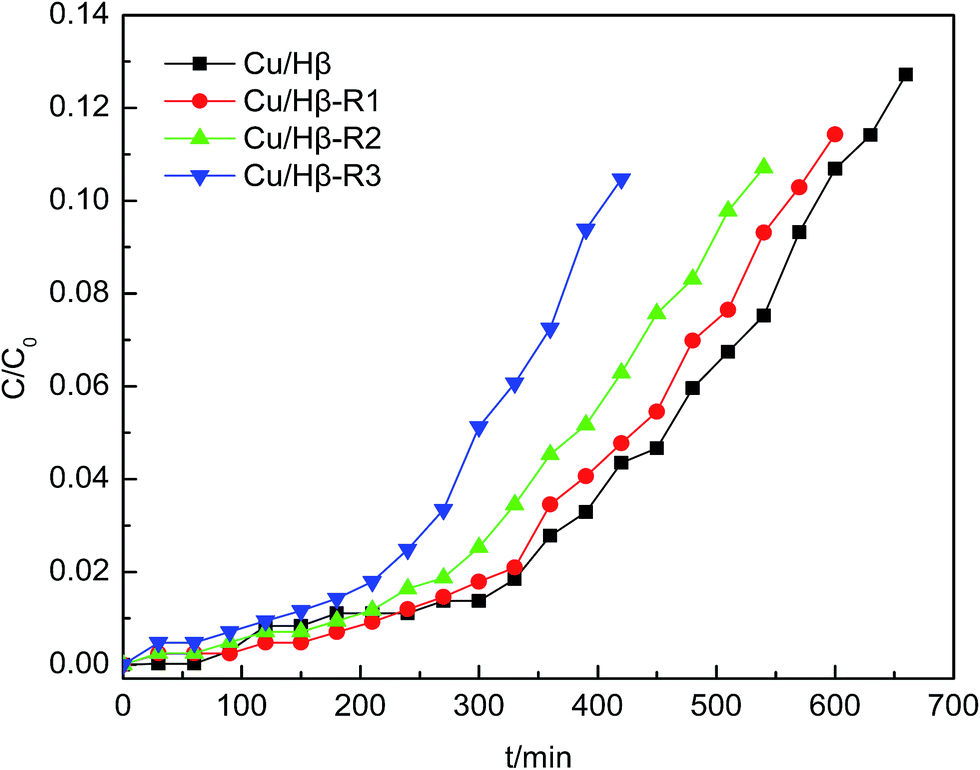 | ||
| Fig. 12 The AsH3 breakthrough curves obtained for the fresh and regenerated Cu/Hβ adsorbent samples. | ||
3.4 Identification of the AsH3 adsorption mechanism
Considering all the characterization results, the Hβ zeolite is a highly efficient adsorption material. The addition of copper to the zeolite and the formation of a CuO active phase upon calcination at high temperatures allowed the removal of AsH3 in an efficient manner.Based on the XRD, XPS, and infrared spectroscopy analysis results, a reaction model for AsH3 adsorption over the copper-exchanged zeolite adsorbent was proposed. The reaction involves (1) the reaction of adsorbed AsH3 and CuO, and the generation of Cu+, As, and oxygen vacancies; (2) O2 activation on the oxygen vacancies and formation of surface activated oxygen or lattice oxygen; (3) the reaction of As and surface activated oxygen or lattice oxygen and the formation of As2O5; and (4) the newly generated Cu+ and oxygen vacancies involved in the successive cycles.
Considering the abovementioned discussion, the AsH3 adsorption process can be divided into the following steps:
| AsH3 + CuO → As + Cu2O + H2O | (1) |
| As + O2 → As2O5 | (2) |
| Cu2O + O2 → CuO | (3) |
A possible total chemical reaction formula on the zeolite surface was proposed as follows:
| 2AsH3 + 4O2 → As2O5 + 3H2O | (4) |
4. Conclusions
The Hβ zeolite loaded with metal salts has been prepared using an impregnation method and tested for AsH3 removal. When compared with other adsorbents, the Cu/Hβ sample exhibited a significant improvement for AsH3 adsorption with a breakthrough time of 390 min. In this study, we found that the best breakthrough capacity was 43.7 mg AsH3/g Cu/Hβ adsorbent at 60 °C with 1.0% oxygen content on Cu/Hβ, which was prepared via calcination at 400 °C using an impregnation concentration of Cu(NO3)2 of 0.2 mol L−1.The Cu(NO3)2 impregnation likely results in the formation of surface functional groups, which significantly contribute to the pronounced increase in the AsH3 adsorption capacity. The XRD and BET results revealed that a crystalline phase of CuO was formed on the zeolite surface and affected the specific surface area and pore structure. In addition, the XPS results showed that the products of AsH3 adsorption were As2O5 species, which were accumulated on the zeolite surface and had a negative effect on the adsorption activity. It is feasible that the spent Cu/Hβ can be regenerated via thermal desorption, and the adsorbents can be recycled at least two times with a small amount of capacity loss.
Conflicts of interest
There are no conflicts to declare.Acknowledgements
This work was supported by the National Key R&D Program of China (2017YFC0210500), National Natural Science Foundation of China (No. 51368026 and 51568027), and Candidates of the Young and Middle Aged Academic Leaders of Yunnan Province (2015HB012).References
- T. A. Ivandini, D. Yamada, T. Watanabe, H. Matsuura, N. Nakano, A. Fujishima and Y. Einaga, Development of ampere metric arsine gas sensor using gold-modified diamond electrodes, J. Electroanal. Chem., 2010, 645, 58–63 CrossRef CAS.
- J. R. Bunt and F. B. Waanders, Trace element behavior in the Sasol–Lurgi MK IV FBDB gasifier. Part 1 – the volatile elements: Hg, As, Se, Cd and Pb, Fuel, 2008, 87, 2374–2387 CrossRef CAS.
- M. Díaz-Somoano and M. R. Martínez-Tarazona, Trace element evaporation during coal gasification based on a thermodynamic equilibrium calculation approach, Fuel, 2003, 82, 137–145 CrossRef.
- S. Q. Liu, Y. T. Wang, Y. Li and J. Oakey, Thermodynamic equilibrium study of trace element transformation during underground coal gasification, Fuel Process. Technol., 2006, 87, 209–215 CrossRef CAS.
- J. P. Trembly, R. S. Gemmen and D. J. Bayless, The effect of coal syngas containing AsH3 on the performance of SOFCs: investigations into the effect of operational temperature, current density and AsH3 concentration, J. Power Sources, 2007, 171, 818–825 CrossRef CAS.
- Z. H. Wang, M. Jiang, P. Ning and G. Xie, Thermodynamic modeling and gaseous pollution prediction of the yellow phosphorus production, Ind. Eng. Chem. Res., 2011, 50, 12194–12202 CrossRef CAS.
- M. Goldman and J. C. Dacre, Lewisite: Its Chemistry, Toxicology, and Biological Effects, Springer, New York, 1989 Search PubMed.
- S. M. Cohen, L. L. Arnold, M. Eldan, A. S. Lewis and B. D. Back, Methylated arsenicals: the implications of metabolism and carcinogenicity studies in rodents to human risk assessment, Crit. Rev. Toxicol., 2006, 36, 99–133 CrossRef CAS PubMed.
- J. K. Suh, N. Kang and J. B. Lee, Direct determination of arsine in gases by inductively coupled plasma-dynamic reaction cell-mass spectrometry, Talanta, 2009, 78, 321–325 CrossRef CAS PubMed.
- R. Quinn, T. A. Dahl, B. W. Diamond and B. A. Toseland, Removal of arsine from synthesis gas using a copper on carbon adsorbent, Ind. Eng. Chem. Res., 2006, 45, 6272–6278 CrossRef CAS.
- R. Quinn and B. A. Toseland, Liquid-phase guard bed for removal of synthesis gas contaminants, Ind. Eng. Chem. Res., 2008, 47, 7027–7030 CrossRef CAS.
- E. C. Rupp, E. J. Granite and D. C. Stanko, Laboratory scale studies of Pd/γ-Al2O3 adsorbents for the removal of trace contaminants from coal-derived fuel gas at elevated temperatures, Fuel, 2013, 108, 131–136 CrossRef CAS.
- C. X. Han, X. Y. Han, Y. Li, S. X. Liu and B. G. Zhang, Removal of arsine in PH3 by Fe-based alloy, Chin. J. Environ. Eng., 2010, 4, 1601–1604 CAS.
- C. J. Howard, R. A. Dagle, V. M. Lebarbier, J. E. Rainbolt, L. Y. Li and D. L. King, Progress toward biomass and coal-derived syngas warm cleanup: proof-of-concept process demonstration of multicontaminant removal for biomass application, Ind. Eng. Chem. Res., 2013, 52, 8125–8138 CrossRef CAS.
- M. Seredych, M. Merwe and T. J. Bandosz, Effects of surface chemistry on the reactive adsorption of hydrogen cyanide on activated carbons, Carbon, 2009, 47, 2456–2465 CrossRef CAS.
- R. N. Nickolov and D. R. Mehandjiev, Comparative study on removal efficiency of impregnated carbons for hydrogen cyanide vapors in air depending on their phase composition and porous textures, J. Colloid Interface Sci., 2004, 273, 87–94 CrossRef CAS PubMed.
- P. A. Barnes, M. J. Chinn, E. A. Dawson and P. R. Norman, Preparation, characterisation and application of metal-doped carbons for hydrogen cyanide removal, Adsorpt. Sci. Technol., 2002, 20, 817–833 CrossRef CAS.
- P. W. Ye, Z. Q. Luan, K. Li, L. Q. Yu and J. C. Zhang, The use of a combination of activated carbon and nickel microfibers in the removal of hydrogen cyanide from air, Carbon, 2009, 47, 1799–1805 CrossRef CAS.
- S. Poulston, E. J. Granite, H. W. Pennline, H. Hamilton and A. W. J. Smith, Palladium based adsorbents for high temperature arsine removal from fuel gas, Fuel, 2011, 90, 3118–3121 CrossRef CAS.
- M. Jiang, Y. W. Bai, P. Ning, X. F. Huang, H. P. Liu and J. Q. Fu, Adsorption removal of arsine by modified activated carbon, Adsorption, 2015, 21, 135–141 CrossRef CAS.
- M. J. Hudson, J. P. Knowles, P. J. F. Harris, D. B. Jackson, M. J. Chinn and J. L. Ward, The trapping and decomposition of toxic gases such as hydrogen cyanide using modified mesoporous silicates, Microporous Mesoporous Mater., 2004, 75, 121–128 CrossRef CAS.
- W. C. Li, H. Bai, J. N. Hu, S. N. Li and C. Chen, Metal loaded zeolite adsorbents for phosphine removal, Ind. Eng. Chem. Res., 2008, 47, 1501–1505 CrossRef CAS.
- X. Q. Wang, P. Ning, Y. Shi and M. Jiang, Adsorption of low concentration phosphine in yellow phosphorus off-gas by impregnated activated carbon, J. Hazard. Mater., 2009, 171, 588–593 CrossRef CAS PubMed.
- F. C. Wu, R. L. Tseng and C. C. Hu, Comparisons of pore properties and adsorption performance of KOH-activated and steam-activated carbons, Microporous Mesoporous Mater., 2005, 80, 95–106 CrossRef CAS.
- P. Ning, K. Li, H. H. Yi, X. L. Tang, J. H. Peng and D. He, Simultaneous catalytic hydrolysis of carbonyl sulfide and carbon disulfide over modified microwave coal-based active carbon catalysts at low temperature, J. Phys. Chem. C, 2012, 116, 17055–17062 CAS.
- K. S. W. Sing, D. H. Everett, R. A. W. Haul, L. Moscow, R. A. Pierotti, J. Rouquerol and T. Siemieniewska, Reporting physisorption data for gas/solid systems with special reference to the determination of surface area and porosity, Pure Appl. Chem., 1985, 57, 603–619 CrossRef CAS.
- K. Borgohain, J. B. Singh, M. V. R. Rao, T. Shripathi and S. Mahamuni, Quantum Size Effects in CuO Nanoparticles, Phys. Rev. B, 2000, 61, 11093–11096 CrossRef CAS.
- Z. H. Yu, L. Zhou, Y. F. Huang, Z. G. Song and W. W. Qiu, Effects of a manganese oxide-modified biochar composite on adsorption of arsenic in red soil, J. Environ. Manage., 2015, 163, 155–162 CrossRef CAS PubMed.
- U. Zielke, K. Huttinger and W. Hoffman, Surface-oxidized carbon fibers: I. Surface structure and chemistry, Carbon, 1996, 34, 983–988 CrossRef CAS.
- P. M. Alvarez, J. F. Garcia-Araya, F. J. Beltran, F. J. Masa and F. Medina, Ozonation of activated carbons: effect on the adsorption of selected phenolic compounds from aqueous solutions, J. Colloid Interface Sci., 2005, 283, 503–512 CrossRef CAS PubMed.
- P. Fanning and M. Vannice, A drifts study of the formation of surface groups on carbon by oxidation, Carbon, 1993, 31, 721–730 CrossRef CAS.
- G. Z. Qu, N. Lu, J. Li, Y. Wu, G. F. Li and D. Li, Simultaneous pentachlorophenol decomposition and granular activated carbon regeneration assisted by dielectric barrier discharge plasma, J. Hazard. Mater., 2009, 172, 472–478 CrossRef CAS PubMed.
- S. Z. Zhao, H. H. Yi, X. L. Tang, D. J. Kang, H. Y. Wang, K. Li and K. J. Duan, Characterization of Zn–Ni–Fe hydrotalcite-derived oxides and their application in the hydrolysis of carbonyl sulfide, Appl. Clay Sci., 2012, 56, 84–89 CrossRef CAS.
- O. Shenderova, A. M. Panich, S. Moseenkov, S. C. Hens, V. Kuznetsov and H. M. Vieth, Hydroxylated detonation nanodiamond: FTIR, XPS, and NMR studies, J. Phys. Chem. C, 2011, 115, 19005–19011 CAS.
- E. Eren and B. Afsin, An investigation of Cu(II) adsorption by raw and acid-activated bentonite: a combined potentiometric, thermodynamic, XRD, IR, DTA study, J. Hazard. Mater., 2008, 151, 682–691 CrossRef CAS PubMed.
- Q. Zhao, S. L. Tian, L. X. Yan, Q. L. Zhang and P. Ning, Novel HCN sorbents based on layered double hydroxides: sorption mechanism and performance, J. Hazard. Mater., 2015, 285, 250–258 CrossRef CAS PubMed.
- M. R. Karagas, A. Gossai, B. Pierce and H. Ahsan, Drinking Water Arsenic Contamination, Skin Lesions, and Malignancies: A Systematic Review of the Global Evidence, Curr. Environ. Health Rep., 2015, 2(1), 52–68 CrossRef CAS PubMed.
| This journal is © The Royal Society of Chemistry 2017 |