
 Open Access Article
 This Open Access Article is licensed under a
 Creative Commons Attribution 3.0 Unported Licence
A one-pot hydrothermal synthesis of graphene/CdS:Mn photocatalyst for photoelectrochemical sensing of glutathione†
Huili Ye,
Hao Wang,
Faqiong Zhao and
Baizhao Zeng *
*
Key Laboratory of Analytical Chemistry for Biology and Medicine (Ministry of Education), College of Chemistry and Molecular Sciences, Wuhan University, Wuhan 430072, Hubei Province, P. R. China. E-mail: bzzeng@whu.edu.cn; Fax: +86-27-68754067; Tel: +86-27-68752701
First published on 26th September 2017
Abstract
A stable graphene (GR)/CdS:Mn photocatalyst was synthesized through a simple and straightforward one-pot hydrothermal method, and it exhibited enhanced photoelectrochemical (PEC) response to glutathione. The catalyst was characterized by X-ray diffraction, X-ray photoelectron spectroscopy, Raman spectroscopy and UV-vis diffuse reflectance spectroscopy. It showed efficient separation of photogenerated charge carriers and low photo-corrosion. The doped Mn2+ effectively improved the band structure of CdS. Meanwhile, the introduced GR greatly enhanced and facilitated visible light absorption as well as electron transport. The GR/CdS:Mn based PEC sensor displayed more sensitive photocurrent response to glutathione than the pure CdS, CdS:Mn and GR/CdS based sensors. Furthermore, the response of the sensor was rapid and stable. The details of the additions and specific effects of each component were discussed. Under the optimized conditions, it presented wide detection range of 0.01 μM to 100 μM, low detection limit, as well as good reproducibility. The sensor could be applied to the determination of glutathione in tomato and ketchup samples.
1. Introduction
Glutathione (GSH), an abundant non-protein and low-molecular-weight mercapto compound, plays many significant roles in biological processes, including elimination of free radicals, maintenance of cellular homeostasis, radiation protection, detoxification and antioxidation.1 Its concentration level is closely associated with some diseases, such as diabetes, rheumatoid disease, HIV, Alzheimer's syndrome and cancers.2 Hence, the evaluation of GSH level is of vital significance. Hitherto, spectral,3 chromatographic,4 and electrochemical5,6 techniques have been proposed for its quantification. Nevertheless, the spectral and chromatographic methods are complicated due to pre-treatment procedures, while electrochemical detection suffers from the interference of some easily oxidative substances or a relatively high oxidation potential.7–9Photoelectrochemical (PEC) sensing is a novel and promising analytical technique, it has attracted considerable attention.10 Owing to the complete separation of excitation source (light) and detection signal (current), PEC sensor has low background noise and high sensitivity in comparison with conventional pristine optical and electrochemical methods.11 It can detect some hard-oxidation analytes at low applied potential, even at 0 V. Furthermore, simple analysis device, high-speed response and relatively low-cost also make PEC sensor a competitive tool.12 The property of PEC sensor depends on the properties of photoactive materials. So far, most PEC sensors are based on nano-semiconductor materials, such as TiO2,13 ZnO,14 CdS15,16 and their derivatives.17 Among them, CdS is a popular visible-light sensitive material, it demonstrates unique photoelectrochemical properties and has good application potential.18,19
Unfortunately, CdS displays poor stability and sensitivity due to its photo-corrosion. To overcome the shortcomings, it is essential to promote the separation or inhibit the recombination of photoexcited electron–hole pairs. For CdS, two strategies have been tried. One is to introduce electron acceptor and transport matrix, such as graphene (GR),20 which could enhance light absorption and facilitate charge transport and separation. What's more, GR serves as a supporting material for CdS dispersion, simultaneously preventing its aggregation. Another is to introduce transition metal ions as they might improve the electronic and physical properties and band structure of CdS, inhibiting its light corrosion.17,21 The doped metal ions also can promote the charge separation.22,23 So far, Mn2+ is used most frequently for such purpose.
However, such modified CdS materials are mainly applied in photodegradation,24 solar cell,25 and hydrogen production,26 only a few reports concern PEC sensors. In addition, most strategies for preparing CdS semiconductors adopt a two-step chemical method,18 otherwise in need of organic solvents, such as ethylene glycol24 and DMSO.25 What's more, in the systems of Mn-doped CdS quantum dot sensitized solar cells reported by P. K. Santra et al.19 and a ternary complex of CdS, graphene and Mn fabricated by Shen's group,27 the researchers seldom explore the roles of doped Mn and other components. Therefore, the states of the dopants such as the valance and present form of Mn element and specific effects of each components need to be further discussed.
In this work, we have prepared a GR/CdS:Mn nanohybrid photocatalyst via a simple one-step hydrothermal method (Scheme 1). Water as a solvent is not only inexpensive and environmentally friendly,28 but also responsible for the hydrothermal reduction of graphitic oxide. CdS serves as the basic photoactive material, while the doped Mn element improves its band structure. Meanwhile, the GR helps to enhance the light absorption and electron transition rate. Owing to the exposed sulfhydryl group, GSH can be adsorbed on the surface of GR/CdS:Mn composite through S–Cd bond, and it can be oxidized by photogenerated hole to glutathione disulfide (GSSG). At the same time, photogenerated electron migrates to GR through the mid-gap of Mn, and finally transports to the ITO electrode, resulting in sustained and stable anodic photocurrent. The GR/CdS:Mn composite shows efficient separation of photogenerated charge carriers and low photo-corrosion, the resulting PEC sensor displays much higher photocurrent response to GSH than that of pure CdS, CdS:Mn and GR/CdS based sensors.
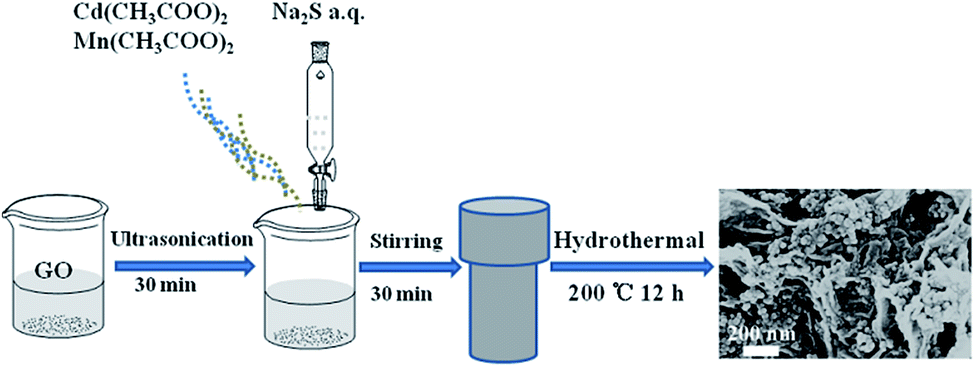 | ||
| Scheme 1 Schematic diagram of the preparation of the composites. | ||
2. Experimental
2.1. Reagents and apparatus
Graphitic oxide (GO, purity: 99%) was purchased from Nanjing XF NANO Materials Tech Co., Ltd. (Nanjing, China). Cd(CH3COO)2·2H2O, Na2S·9H2O, Mn(CH3COO)2·4H2O, Na2SO4, K2SO4, CaCl2, Mg(NO3)2·6H2O, FeCl3·6H2O, dopamine (DA), lactic acid (LA), uric acid (UA), ascorbic acid (AA), bovine serum albumin (BSA), glucose and glycine (Gly) were obtained from Sinopharm Chemical Regent Co., Ltd. (Shanghai, China). CuSO4·5H2O, GSH and GSSG were acquired from Aladdin Chemistry Co., Ltd. (Shanghai, China). All the chemicals were used without further purification. All the aqueous solutions were prepared with ultrapure water (18.25 MΩ). ITO substrates were from Zhuhai Kaivo Electronic Components Co., Ltd. (China).The samples were characterized and analyzed by field emission scanning electron microscopy (FESEM, Zeiss, Germany) with an accelerating voltage of 20 kV, X-ray diffraction data (XRD, Bruck D8 diffractometer, Germany) using Cu Kα radiation (40 kV, 40 mA) with a Ni filter, X-ray photo-electron spectroscopy (XPS, Thermal Fisher ESCALAB 250Xi, USA) with Al Kα X-ray radiation excitation, energy-dispersive X-ray spectroscopy (EDS, Hitachi X-650 SEM, Japan), UV-vis diffuse reflectance spectra (DRS, Shimadzu UV-3600, Japan), Fourier transform infrared spectroscopy (FT-IR, Thermal Fisher, Is10, USA), and Confocal Raman Microspectroscopy (Raman, Renishaw, RM-1000, Britain) with laser of Ar+ at excitation wavelength of 514.5 nm. The photoelectrochemical experiments were performed on a CHI 830D electrochemical workstation (CH Instrument Company, Shanghai, China). The visible light source was a 500 W Xe lamp (SOFN instrument Co., Ltd. China). Filters of different wavelengths were from THORLABS (USA). All experiments were conducted at room temperature except mentioned otherwhere.
2.2. Synthesis of GR/CdS:Mn nanocomposites
The hydrothermal synthesis of GR/CdS:Mn hybrid was referred to the reported method with minor modifications.27 First of all, a certain amount of GO was dispersed in 20 mL ultrapure water, 0.7995 g Cd(CH3COO)2·2H2O and 0.1020 g Mn(CH3COO)2·4H2O were dissolved in 20 mL water. Then they were mixed under stirring. After that, 20 mL Na2S solution (3 mmol) was added dropwise to the mixture. The obtained mixture was transferred into a 100 mL Teflon-lined autoclave and heated at 200 °C for 12 h. After cooled to room temperature, the precipitation was filtrated and washed with water for several times, and then freeze-dried to obtain GR/CdS:Mn. The mass percentage of GO (i.e. 0.23 wt%, 1.40 wt%, 3.50 wt%, 7.00 wt%, wt% meant the mass ratio of GO in the composite) and molar percentage of Mn (i.e. 3 mol%, 6 mol%, 10 mol%, 15 mol%, 20 mol%, mol% was the molar ratio of Mn to Cd) were altered to prepare different GR/CdS:Mn composites. For controlling experiments, GR, CdS, CdS:Mn and GR/CdS were synthesized. The as-prepared composites were dispersed in water to prepare 1 mg mL−1 suspensions for ITO modifying.2.3. Pretreatment of real samples
The samples were bought from a local supermarket and the pretreatment procedure was similar to the previous reports.29,30 The tomato and ketchup sample (10 g) were chopped and mashed, afterwards, they were ultrasonically extracted with 20 mL 0.10 M Na2SO4 for 2 h and then filtrated to get the extraction. The extraction procedure was repeated twice. The filtrate was transferred to a 50 mL volumetric flask and diluted to the scale with water.2.4. Preparation of PEC sensors
The ITO glasses (1 cm × 2 cm) were cleaned with NaOH (1 M) (in ethanol–water, v/v: 1![[thin space (1/6-em)]](https://www.rsc.org/images/entities/char_2009.gif) :1) solution, washed with acetone, ultrapure water and ethanol, and dried in a oven at 60 °C. The sensors were fabricated according to our previous report.31 The area of ITO glass was controlled at 0.0706 cm2 using 3 M tape (Fig. S1a†). Then 15 μL of GR/CdS:Mn composite dispersion was coated on the ITO glass (Fig. S1b†), and dried at 60 °C, followed by assembling to electrode clamp to obtain ITO/GR/CdS:Mn working electrode (Fig. S1c†).
:1) solution, washed with acetone, ultrapure water and ethanol, and dried in a oven at 60 °C. The sensors were fabricated according to our previous report.31 The area of ITO glass was controlled at 0.0706 cm2 using 3 M tape (Fig. S1a†). Then 15 μL of GR/CdS:Mn composite dispersion was coated on the ITO glass (Fig. S1b†), and dried at 60 °C, followed by assembling to electrode clamp to obtain ITO/GR/CdS:Mn working electrode (Fig. S1c†).
2.5. Measurement of PEC current
The PEC experiments were performed on a homebuilt photoelectrochemical system. A Xe lamp equipped with a monochromator was used as the visible light irradiation source. The photocurrent was recorded by a CHI 830D electrochemical workstation, with a conventional three-electrode system including a modified ITO electrode as the working electrode (WE), a Pt wire as the auxiliary electrode (AE) and a saturated calomel electrode (SCE) as the reference electrode (RE). The supporting electrolyte was 0.10 M Na2SO4 aqueous solution. The distance between light source and the electrode was fixed at 10 cm. Before PEC experiments all the solutions were adequately deaerated by purging high pure nitrogen for 15 min.3. Results and discussion
3.1. Characterization of GR/CdS:Mn
Fig. 1A–C shows the typical FESEM images and photos of the samples. As for yellow CdS (Fig. 1A), the particles are uniform and the sizes are about 30–40 nm. After doping Mn2+ ions, its colour becomes a little darker and the structure becomes looser (Fig. 1B). As GR forms a 3D network structure, the loaded CdS:Mn nanoparticles are well dispersed on GR sheets with high coverage rate and show brown colour (Fig. 1C). As SEM-EDS of the GR/CdS:Mn composite shown in Fig. 1D, Mn element can be detected which indicates the successful introduction. From the EDS-mapping of the composite (Fig. 1E–G), low abundance of Mn can be found compared with Cd and S. Considering the trace amount of O from EDS, all Mn can't be MnO, and the homogenous distribution of Mn in the composite opposes to discrete collections of MnO and proves the possible existence of MnS.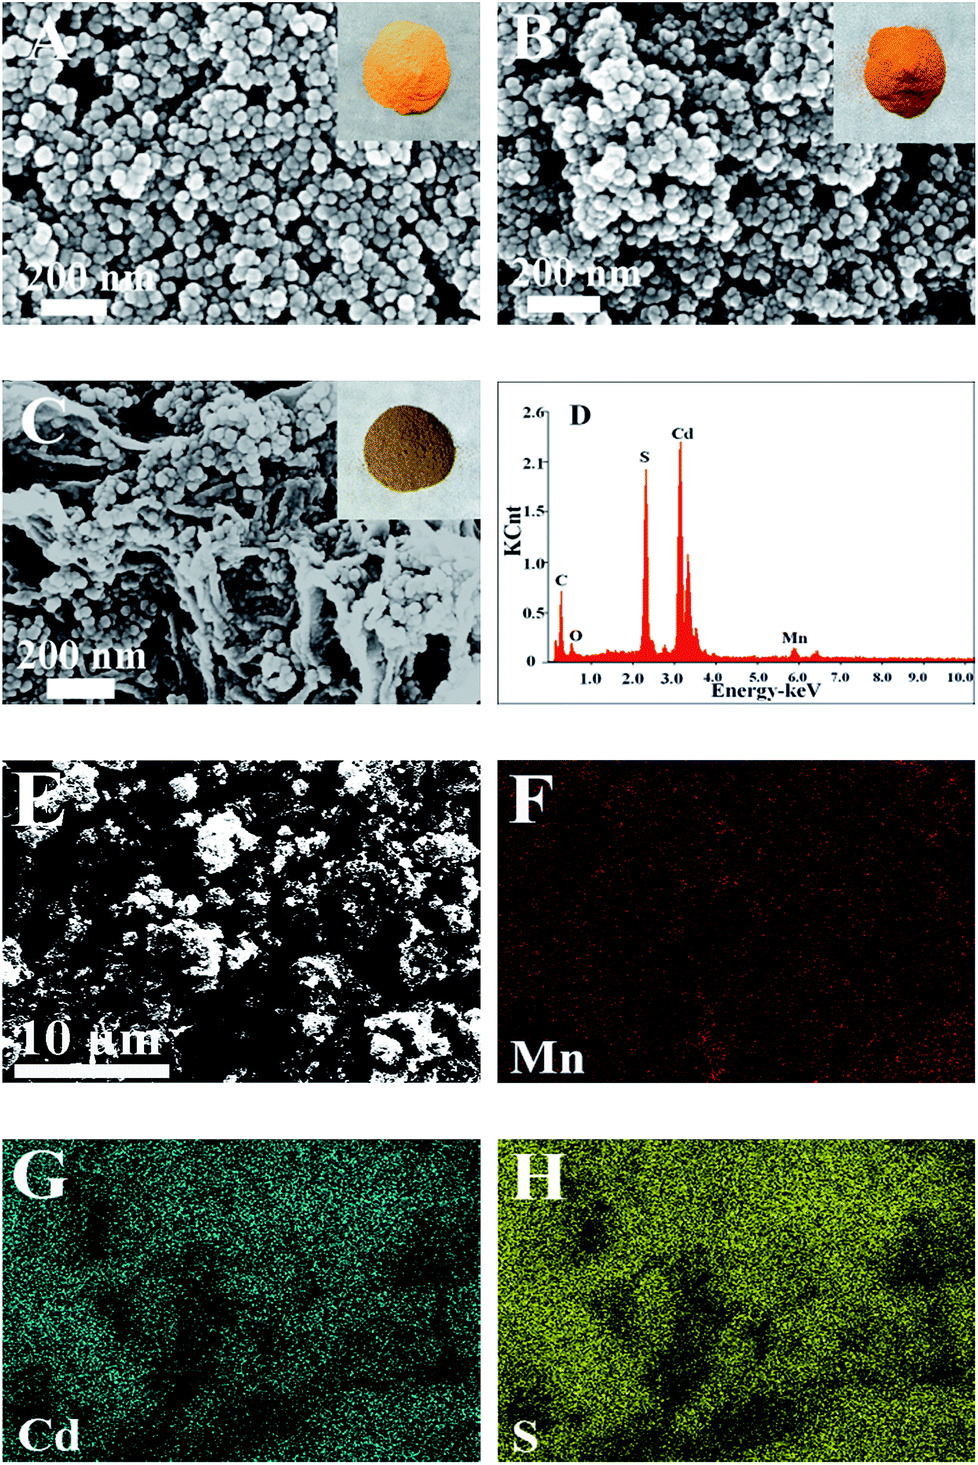 | ||
| Fig. 1 The SEM images and photos (insert) of (A) CdS, (B) CdS:Mn, and (C) GR/CdS:Mn composite; (D) EDS patterns of GR/CdS:Mn composite; SEM (E) elemental mapping of the composite, Mn (F), Cd (G) and S (H). | ||
The XRD pattern of pristine GO (Fig. 2A) presents a sharp peak at 10.4°, corresponding to the (001) reflection of GO.32 For GR the strong diffraction peak of GO disappears and a broad weak peak at 25° is observed, indicating the reduction of GO.18 There are three main peaks at 26.9°, 44.2° and 52.2° for the CdS crystal, which are related to the (111), (220) and (311) cubic crystal plane (JCPDS no. 65-2887).33 After doping Mn2+, the XRD pattern of CdS:Mn displays little difference, and some peaks decline slightly, demonstrating that no extra impurity crystals form besides some lattice defects. Similar results are obtained for the GR/CdS:Mn. However, no peak of GR is observed, probably because of its relatively low diffraction and the masking effect of CdS peaks.34
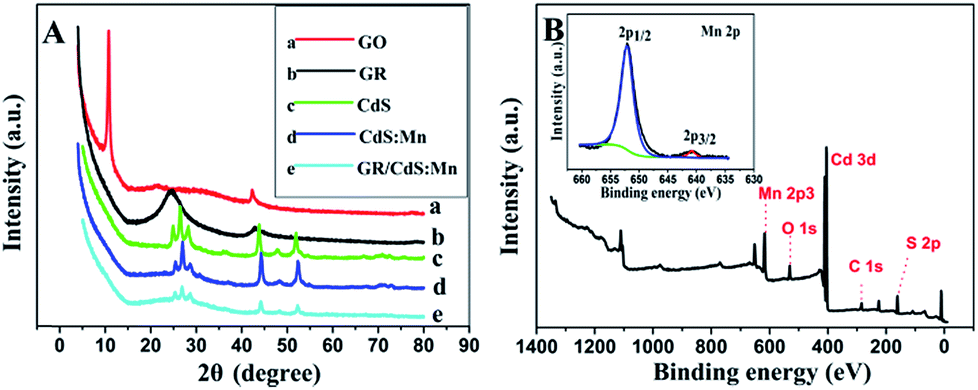 | ||
| Fig. 2 (A) XRD patterns of GO (a), GR (b), CdS (c), CdS:Mn (d), GR/CdS:Mn (e); (B) XPS spectra of the GR/CdS:Mn composite and high-resolution XPS spectra of Mn 2p (insert). | ||
XPS analysis is further used to confirm the formation of GR/CdS:Mn composite and the reduction of GO to GR. As can be seen in Fig. 2B and S2,† the binding energies of Cd 3d5/2 and Cd 3d3/2 are 404.8 and 411.5 eV respectively, while the binding energies of S 2p3/2 and 2p1/2 are 161.3 and 162.4 eV respectively, indicating the successful generation of CdS.35,36 The binding energies of Mn 2p3/2 and 2p1/2 (insert of Fig. 2B) locate at 640.8 eV and 652.1 eV, respectively. It proves the doping of Mn2+.37,38 In addition, the high-resolution XPS spectra of C (Fig. S2C and D†) shows that the C element presents as sp2 carbon because of the decrease of oxygen-containing groups such as C–O, C![[double bond, length as m-dash]](https://www.rsc.org/images/entities/char_e001.gif) O and C–OH in comparison with the original GO. It indicates that GO has been reduced to GR during the hydrothermal treatment.
O and C–OH in comparison with the original GO. It indicates that GO has been reduced to GR during the hydrothermal treatment.
The similar results can be obtained from the FTIR spectra of pristine GO, GR and GR/CdS:Mn. As can be seen in Fig. S3B,† for GO, the strong band around 3420 cm−1 can be assigned to the stretching vibration of –OH groups. The typical characteristic peaks of other oxygen-containing groups of GO (curve a) locate at 1723 cm−1, 1622 cm−1, 1224 cm−1, 1050 cm−1, belonging to the CO vibration of –COOH at the edge of GO sheets, the absorption of –OH bending vibration and C–O–C epoxy skeleton ring vibration, C–OH and C–O vibration of the alkoxy group. For GR and GR/CdS:Mn, the representative absorption bands of GO, including hydroxyl, carboxyl and epoxide groups, decrease greatly or almost completely disappear after hydrothermal treatment, indicating the successful reduction of GO. The band of 1568 cm−1 can be ascribed to the skeletal vibration of CC in GR sheets, affirming the recovery of the SP2 hybrid carbon skeleton. The band at 1209 cm−1 results from the C–O bond of ester, which illustrates the small amount of lactone groups forming in the hydrothermal process.39,40
Fig. 3A shows the Raman spectra of CdS, CdS:Mn and GR/CdS:Mn. The features at about 300 and 600 cm−1 correspond to the 1 longitudinal optical (1LO) and second-order LO phonon (2LO) scattering peaks of CdS, respectively.41 The intensity of the LO phonon is greatly enhanced in the CdS:Mn. In addition, the 1LO phonon peak of the Mn-doped CdS composite shifts slightly from 290 cm−1 to 305 cm−1. The blue shift can be attributed to the strain effect induced by the extrinsic defects in the interstitial sites (Mn dopants).42
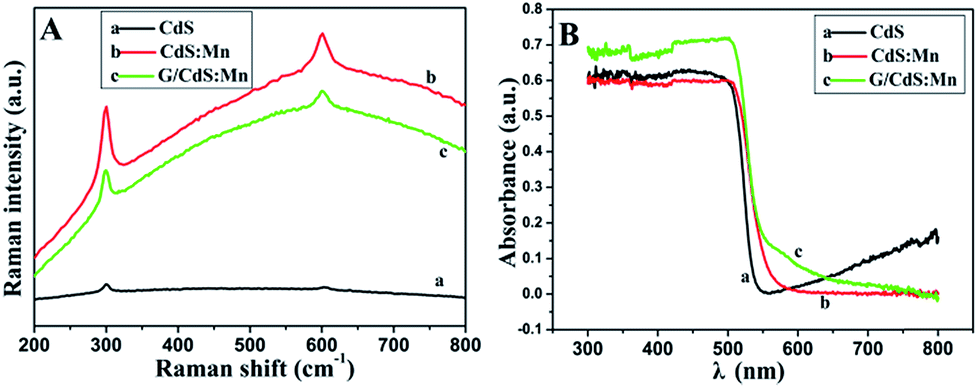 | ||
| Fig. 3 (A) Raman spectra and (B) UV-vis diffuse reflectance spectra (DRS) of CdS (a), CdS:Mn (b) and GR/CdS:Mn (c). | ||
The UV-vis diffuse reflectance spectra (DRS) of CdS, CdS:Mn and GR/CdS:Mn are shown in Fig. 3B. The band gap energy of CdS, which shows light absorption below 550 nm, can be calculated as 2.26 eV according to the following equation:43
| Eg = 1240/λ |
3.2. PEC properties of ITO/GR/CdS:Mn
To investigate the PEC properties of GR/CdS:Mn composite, the photocurrent density of the modified ITO electrodes has been measured. Fig. 4A illustrates the photocurrent response of CdS, CdS:Mn, GR/CdS and GR/CdS:Mn modified electrodes to 1 μM GSH in 0.10 M Na2SO4 aqueous solution at 0 V (vs. SCE). The photocurrent density of ITO/GR/CdS:Mn (d1) in the blank solution is higher than that of ITO/CdS (a1), ITO/CdS:Mn (b1) and ITO/GR/CdS (c1), due to the improved electron transport rate and reduced recombination of photogenerated charges. However, after adding GSH, its photocurrent response is also much higher than the former three electrodes. Here, the photocurrent response of ITO/GR/CdS:Mn (ΔI, defined as the difference of photocurrent density with and without GSH) is 4.30 μA cm−2, while those of CdS, ITO/CdS:Mn and ITO/GR/CdS are 0.88 μA cm−2, 2.42 μA cm−2 and 2.65 μA cm−2, respectively. In a word, the GR/CdS:Mn composite shows efficient separation of photogenerated charge carriers and low photo-corrosion, which displays more favourable and sensitive response to GSH. It is clear that both GR and Mn can improve the PEC activity of CdS. When they co-exist, their synergistic effect occurs and ensures a lager photocurrent enhancement.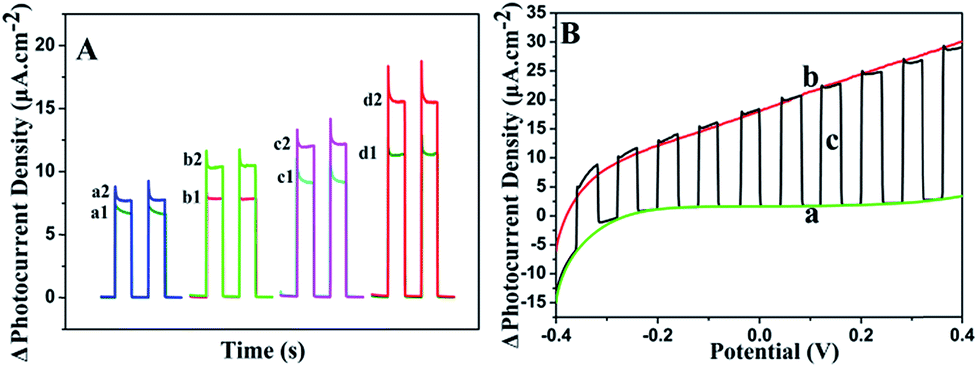 | ||
| Fig. 4 (A) Photocurrent response of ITO/CdS (a), ITO/CdS:Mn (b), ITO/GR/CdS (c) and ITO/GR/CdS:Mn (d) in the dark (1) and under illumination (2); (B) LSV of ITO/GR/CdS:Mn sensor in 1 μM GSH under dark condition (a), light irradiation (b) and light “on/off” condition (c). Applied potential: 0 V (vs. SCE); irradiation wavelength: 470 nm. | ||
The applied potential is of significant importance to the photocurrent response. Linear sweep voltammetry (LSV) method has been conducted to investigate its influence. As shown in Fig. 4B, without illumination (a), the photocurrent density of ITO/GR/CdS:Mn in Na2SO4 electrolyte is low. Under irradiation (b), it achieves a relatively high photocurrent density. The LSV corresponding to irradiation on/off presents a comparable and instantaneous photocurrent response due to PEC effect (c). It can be seen that the anodic photocurrent increases as the applied potential rises. This is because a positive potential can provide a driving force for electron transfer and facilitate the oxidization of GSH by hole. In contrast, a negative potential can inhibit the electron transfer of anode photocurrent, resulting in reduction of photocurrent.44,45 Nevertheless, when the potential is too high, the electrochemical oxidization of GSH occurs, producing an interference current. In addition, lower applied potential is beneficial to the elimination of interference from other reductive species. Thus, 0 V (vs. SCE) is adopted for the PEC measurement in this case.
The cyclic voltammograms (CV) of ITO/GR/CdS:Mn in the absence and presence of GSH with visible-light irradiation of 470 nm are recorded (Fig. S4A†). GSH does not cause current peak under this conditions so that the direct detection of electrochemical oxidation signal is hard to achieve. The slow electron-transfer rate in the oxidation of GSH lead to a high overpotential.46 To further understand this point, amperometric curves are also recorded. As shown in Fig. S4B,† in the dark condition, no current responses for the successive addition of GSH can be observed at 0 V. It indicates that the EC oxidation of GSH cannot occur at such low applied potential. However, in the light condition the current response signal is quite sensitive. This indicates that the current signal detected at 0 V results from PEC, not from the electrochemical oxidation of GSH.
3.3. Optimization of experimental conditions
The irradiation wavelength is one of the most important factors influencing the PEC properties. As illustrated in Fig. 5A, the photocurrent density increment (ΔI) decreases as the exciting wavelength increases from 430 nm to 580 nm. At 470 nm, the ΔI is 77.5% of that at 430 nm. Afterward, ΔI sharply decreases with further increase of irradiation wavelength. In general, light of long wavelength is beneficial for the detection of biological samples as it has lower energy and weaker damage.47 Therefore, 470 nm is chosen for PEC sensing of GSH.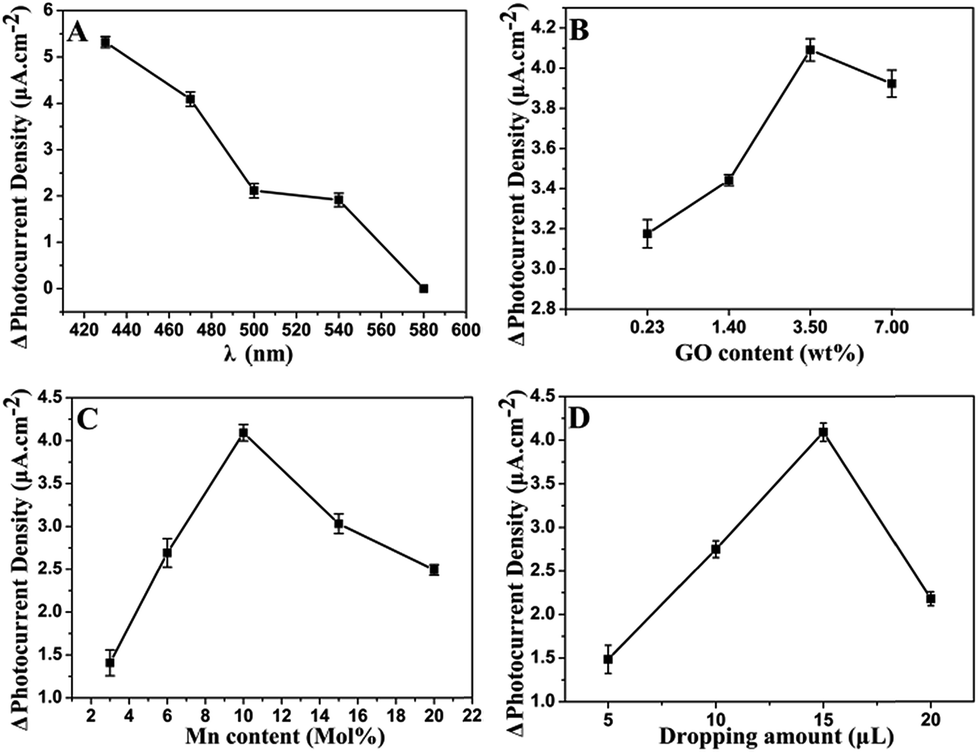 | ||
| Fig. 5 Effects of (A) excitation wavelength, (B) content of GR, (C) content of doped Mn, and (D) dropping amount of GR/CdS:Mn on the increment of photocurrent density in 0.10 M Na2SO4 containing 1 μM GSH. | ||
GR plays a significant role in the separation of photogenerated charges and in the enhancement of photocurrent density. In order to achieve an optimal photoactivity enhancement for GR-semiconductor composites, the weight addition ratio of GR in the semiconductor matrix is generally no more than 5 wt%,48 although the greater addition ratio of GR is able to inhibit the recombination of electron–hole pairs photogenerated from the semiconductor. As shown in Fig. 5B, the ΔI increases with the amount of introduced GO increasing from 0.23 wt% to 3.5 wt% during the synthesis of the hybrid. This is related to the fast electron transfer of GR. However, the ΔI decreases when the amount of GO is increased further (e.g. to 7 wt%). It should be ascribed to the light absorption of black GR, which affects the light absorption of the photoactive material to some extent. The photos of GR/CdS:Mn composite with different GO contents can be seen in Fig. S5.† The color of the composite becomes darker as GO content increases. Here, the best content of GO is 3.5 wt% in the synthesis solution.
Fig. 5C shows the influence of Mn2+ content on photocurrent density. The doped Mn2+ in the CdS semiconductor can cause some lattice defects and further improve its band structure. Generally, lattice defects can form capture centres for the photogenerated electron–hole pairs, inhibiting the recombination of charge carriers. However, if lattice defects are too much, photocatalysis will be depressed. Herein, 10 mol% (in the synthesis solution) Mn2+ is adopted in the preparation of composite.
Besides, the influence of modifying amount of GR/CdS:Mn composite has been investigated and 15 μL of GR/CdS:Mn suspension (1 mg mL−1) is selected as the optimized coating amount for preparing electrode (Fig. 5D).
3.4. PEC detection of GSH
The developed ITO/GR/CdS:Mn photoelectrochemical sensor is applied to GSH determination. The PEC measurement is carried out in 0.10 M Na2SO4 electrolyte under the irradiation of 470 nm light at 0 V (vs. SCE). Fig. 6 illustrates the photocurrent response of GSH. It can be found that the photocurrent density is proportional to the logarithm of the concentration of GSH over a wide range from 0.01 μM to 100 μM (Fig. 6A and B). It is wider than that of the reported electrochemical sensors based on ordered mesoporous carbon49 and Cu(OH)2–carbon ionic liquid,6 and that of PEC sensors based on flower-like Cu2O/ZnO,50 IrO2–hemin–TiO2 (ref. 46) and porous TiO2–Pt.51 The linear regression equation can be expressed as ΔI/μA cm−2 = 27.1 + 1.96logc/μM (R2 = 0.9995). The detection limit is 0.01 μM (based 3S/N), which is lower than that of electrochemical methods concerning Hg/Pd,52 electrochemiluminescence of CdTe QD–GO53 and PEC sensors based on Au NPs@ZnO14 and FeTPPS–TiO2.47 The detailed comparisons are shown in Table S1.† As can be seen, the ITO/GR/CdS:Mn sensor presents good performance in monitoring GSH.
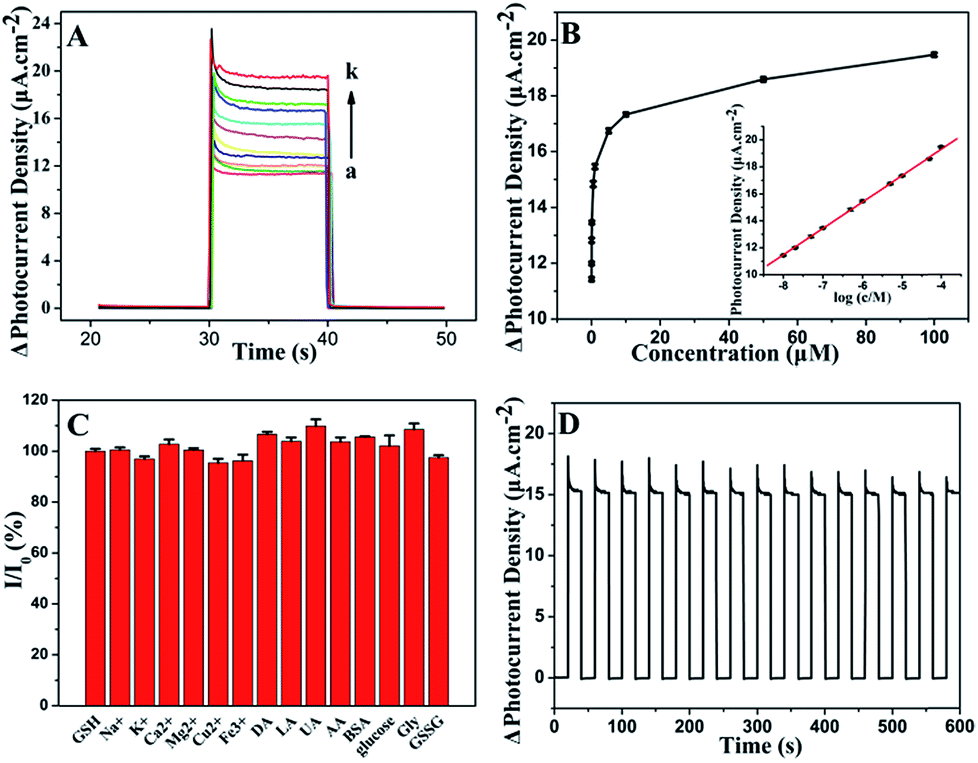 | ||
| Fig. 6 (A) Photocurrent response of ITO/GR/CdS:Mn to GSH in 0.10 M Na2SO4 solution. GSH concentration: 0, 0.01, 0.02, 0.05, 0.1, 0.5, 1, 5, 10, 50, 100 μM (from a to k); (B) plot of photocurrent density vs. concentration. Inset: linear calibration curve; (C) influence of 50 μM Na+, K+, Ca2+, Mg2+, Cu2+, Fe3+, and 10 μM DA, LA, AA, UA, BSA, glucose, Gly, GSSG on the response of 5 μM GSH; (D) time-dependent photocurrent response of ITO/GR/CdS:Mn in 0.10 M Na2SO4 solution with light on/off. | ||
3.5. Selectivity, stability and reproducibility
The selectivity of the ITO/GR/CdS:Mn sensor is evaluated by measuring the photocurrent response of various potential interferents and other similar hole scavengers (Fig. 6C). As can be seen, the studied mental ions (i.e. 50 μM Na+, K+, Ca2+, Mg2+, Cu2+, Fe3+), common chemicals and biological molecules (i.e. 10 μM DA, LA, AA, UA, BSA, glucose, Gly, GSSG) shows much smaller or negligible signals, which indicates that those co-existents have little influence on the detection of GSH. A reasonable explanation for the good selectivity is the possibility of GSH adhering to the particles surface. Fig. 6D shows the time-dependent photocurrent response of the ITO/GR/CdS:Mn at repeated on/off cycles for 600 s under visible illumination. The stable photocurrent density indicates the inhibition of the photo-corrosion of CdS and the light stability of the hybrid. Here, the relative standard deviation (RSD) of the photocurrent density for 5 μM GSH is 2.3% for five successive measurements (Fig. S6†), and the RSD for 5 different ITO/GR/CdS:Mn is 5.4%, reflecting its good reproducibility. What's more, the sensor remains 91% of the initial photocurrent response after storing for 12 days at room temperature, indicating the good structural stability of the fabricated photo-anode material.3.6. Application
To demonstrate the application feasibility of the as-prepared ITO/GR/CdS:Mn PEC sensor, the determination of GSH in tomato and ketchup has been conducted and the results are listed in Table 1. Their contents are determined by this analytical method and ca. 5.93 mg kg−1 and 0.97 mg kg−1 for tomato and ketchup, respectively. The detected content of tomato is close to the report30 and the result of ketchup agrees with the declared content. The recoveries for spiked GSH are 91.2% to 105%, which is acceptable. This indicates that the PEC sensor can be used for the detection of GSH in real samples.| Samples | Add (μM) | Found (μM) | Recovery (%) | RSD (%) (n = 3) |
|---|---|---|---|---|
| Tomato | 0 | 3.86 | — | 2.5 |
| 5.00 | 8.57 | 94.2 | 5.3 | |
| 10.00 | 14.36 | 105 | 6.6 | |
| 20.00 | 24.46 | 103 | 4.6 | |
| Ketchup | 0 | 0.63 | — | 4.6 |
| 5.00 | 5.19 | 91.2 | 1.7 | |
| 10.00 | 10.49 | 98.4 | 3.4 | |
| 20.00 | 19.99 | 96.8 | 5.0 |
4. Conclusions
In summary, a GR/CdS:Mn composite has been synthesized and characterized. The detail states of the additives and their specific effects have been discussed. The GR/CdS:Mn composite demonstrates good PEC properties and low photo-corrosion and the resulting PEC sensor displays sensitive and selective response to GSH under visible illumination at 0 V. This is related to the doped Mn2+ and the introduced GR, which effectively improve the separation of photo-induced charges. Under the optimized conditions, the ITO/GR/CdS:Mn sensor presents wide detection range of 0.01 μM to 100 μM, a low detection limit of 0.01 μM, as well as good reproducibility. It can be used for the detection of GSH in real samples.Conflicts of interest
There are no conflicts to declare.Acknowledgements
The work was financially supported by the National Natural Science Foundation of China (Grant No. 21675117). The authors appreciate the Analytical and Testing Center of WHU for the help in material characterization.References
- A. Meister and M. E. Anderson, Annu. Rev. Biochem., 1983, 52, 711–760 CrossRef CAS PubMed
.
- P. S. Samiec, C. Drews Botsch, E. W. Flagg, J. C. Kurtz, P. Sternberg Jr, R. L. Reed and D. P. Jones, Free Radical Biol. Med., 1998, 24, 699–704 CrossRef CAS PubMed
- R. Deng, X. Xie, M. Vendrell, Y. T. Chang and X. Liu, J. Am. Chem. Soc., 2011, 133, 20168–20171 CrossRef CAS PubMed
- J. T. Michaelsen, S. Dehnert, D. Giustarini, B. Beckmann and D. Tsikas, J. Chromatogr. B: Anal. Technol. Biomed. Life Sci., 2009, 877, 3405–3417 CrossRef CAS PubMed
- M. H. Pournaghi Azar and F. Ahour, J. Electroanal. Chem., 2008, 622, 22–28 CrossRef CAS
- A. Safavi, N. Maleki, E. Farjami and F. A. Mahyari, Anal. Chem., 2009, 81, 7538–7543 CrossRef CAS PubMed
- S. M. Senthil Kumar and K. Chandrasekara Pillai, Electrochim. Acta, 2009, 54, 7374–7381 CrossRef CAS
- J. C. Harfield, C. Batchelor McAuley and R. G. Compton, Analyst, 2012, 137, 2285–2296 RSC
- E. Katelhon and R. G. Compton, Analyst, 2014, 139, 2411–2415 RSC
- W. W. Zhao, X. D. Yu, J. J. Xu and H. Y. Chen, Nanoscale, 2016, 8, 17407–17414 RSC
- W. W. Zhao, J. J. Xu and H. Y. Chen, Chem. Soc. Rev., 2015, 44, 729–741 RSC
- W. W. Zhao, J. J. Xu and H. Y. Chen, Chem. Rev., 2014, 114, 7421–7441 CrossRef CAS PubMed
- H. Li, J. Li, Q. Xu and X. Hu, Anal. Chem., 2011, 83, 9681–9686 CrossRef CAS PubMed
- Z. Kang, X. Yan, Y. Wang, Y. Zhao, Z. Bai, Y. Liu, K. Zhao, S. Cao and Y. Zhang, Nano Res., 2016, 9, 344–352 CrossRef CAS
- G. L. Wang, K. L. Liu, Y. M. Dong, X. M. Wu, Z. J. Li and C. Zhang, Biosens. Bioelectron., 2014, 62, 66–72 CrossRef CAS PubMed
- F. Jafari, A. Salimi and A. Navaee, Electroanalysis, 2014, 26, 1782–1793 CrossRef CAS
- X. Li, J. Yu and M. Jaroniec, Chem. Soc. Rev., 2016, 45, 2603–2636 RSC
- Q. Shen, L. Han, G. Fan, J. R. Zhang, L. Jiang and J. J. Zhu, Anal. Chem., 2015, 87, 4949–4956 CrossRef CAS PubMed
- P. K. Santra and P. V. Kamat, J. Am. Chem. Soc., 2012, 134, 2508–2511 CrossRef CAS PubMed
- W. Tu, Y. Zhou and Z. Zou, Adv. Funct. Mater., 2013, 23, 4996–5008 CrossRef CAS
- A. Nag, S. Chakraborty and D. D. Sarma, J. Am. Chem. Soc., 2008, 130, 10605–10611 CrossRef CAS PubMed
- S. Zhou, Y. Kong, Q. Shen, X. Ren, J. R. Zhang and J. J. Zhu, Anal. Chem., 2014, 86, 11680–11689 CrossRef CAS PubMed
- P. Wu, J. B. Pan, X. L. Li, X. Hou, J. J. Xu and H. Y. Chen, Chem.–Eur. J., 2015, 21, 5129–5135 CrossRef CAS PubMed
- Z. Gao, N. Liu, D. Wu, W. Tao, F. Xu and K. Jiang, Appl. Surf. Sci., 2012, 258, 2473–2478 CrossRef CAS
- A. Cao, Z. Liu, S. Chu, M. Wu, Z. Ye, Z. Cai, Y. Chang, S. Wang, Q. Gong and Y. Liu, Adv. Mater., 2010, 22, 103–106 CrossRef CAS PubMed
- S. Oros Ruiz, A. Hernández Gordillo, C. García Mendoza, A. A. Rodríguez Rodríguez and R. Gómez, J. Chem. Technol. Biotechnol., 2016, 91, 2205–2210 CrossRef CAS
- Q. Shen, X. Shi, M. Fan, L. Han, L. Wang and Q. Fan, J. Electroanal. Chem., 2015, 759(Part 1), 61–66 CrossRef CAS
- N. Zhang, M. Q. Yang, Z. R. Tang and Y. J. Xu, J. Catal., 2013, 303, 60–69 CrossRef CAS
- L. B. Abdulra'uf, M. K. Chai and G. H. Tan, J. AOAC Int., 2012, 95, 1272–1290 CrossRef
- N. Yan, Z. Zhu, N. Ding, L. Zhou, Y. Dong and X. Chen, J. Chromatogr. A, 2009, 1216, 8665–8670 CrossRef CAS PubMed
- H. Wang, H. Ye, B. Zhang, F. Zhao and B. Zeng, J. Mater. Chem. A, 2017, 5, 10599–10608 CAS
- T. Nakajima, A. Mabuchi and R. Hagiwara, Carbon, 1988, 26, 357–361 CrossRef CAS
- X. Zhao, S. Zhou, Q. Shen, L. P. Jiang and J. J. Zhu, Analyst, 2012, 137, 3697–3703 RSC
- Q. Li, B. Guo, J. Yu, J. Ran, B. Zhang, H. Yan and J. R. Gong, J. Am. Chem. Soc., 2011, 133, 10878–10884 CrossRef CAS PubMed
- S. Kolhe, S. K. Kuljarni, A. S. Nigavekar and S. K. Sharma, Sol. Energy Mater., 1984, 10, 47–54 CrossRef CAS
- J. Yu, Y. Yu, P. Zhou, W. Xiao and B. Cheng, Appl. Catal., B, 2014, 156, 184–191 CrossRef
- H. Franzen and C. Sterner, J. Solid State Chem., 1978, 25, 227–230 CrossRef CAS
- H. van der Heide and C. F. van Bruggen, Mater. Res. Bull., 1982, 17, 1517–1521 CrossRef CAS
- H. L. Guo, X. F. Wang, Q. Y. Qian, F. B. Wang and X. H. Xia, ACS Nano, 2009, 3, 2653–2659 CrossRef CAS PubMed
- Y. Si and E. T. Samulski, Nano Lett., 2008, 8, 1679–1682 CrossRef CAS PubMed
- B. E. Boone and C. Shannon, J. Phys. Chem., 1996, 100, 9480–9484 CrossRef CAS
- P. Q. Zhao, L. Z. Liu, H. T. Xue, X. L. Wu, J. C. Shen and P. K. Chu, Appl. Phys. Lett., 2013, 102, 061910 CrossRef
- Y. Chen, J. Fang, S. Lu, W. Xu, Z. Liu, X. Xu and Z. Fang, J. Chem. Technol. Biotechnol., 2015, 90, 947–954 CrossRef CAS
- C. M. McShane and K. S. Choi, J. Am. Chem. Soc., 2009, 131, 2561–2569 CrossRef CAS PubMed
- Y. An, L. Tang, X. Jiang, H. Chen, M. Yang, L. Jin, S. Zhang, C. Wang and W. Zhang, Chem.–Eur. J., 2010, 16, 14439–14446 CrossRef CAS PubMed
- J. Tang, B. Kong, Y. Wang, M. Xu, Y. Wang, H. Wu and G. Zheng, Nano Lett., 2013, 13, 5350–5354 CrossRef CAS PubMed
- W. Tu, Y. Dong, J. Lei and H. Ju, Anal. Chem., 2010, 82, 8711–8716 CrossRef CAS PubMed
- N. Zhang, M. Q. Yang, Z. R. Tang and Y. J. Xu, ACS Nano, 2014, 8, 623–633 CrossRef CAS PubMed
- J. C. Ndamanisha, J. Bai, B. Qi and L. Guo, Anal. Biochem., 2009, 386, 79–84 CrossRef CAS PubMed
- J. Li, H. Li, Y. Xue, H. Fang and W. Wang, Sens. Actuators, B, 2014, 191, 619–624 CrossRef CAS
- G. Chen, J. Wang, C. Wu, C. Z. Li, H. Jiang and X. Wang, Langmuir, 2012, 28, 12393–12399 CrossRef CAS PubMed
- C. Antwi, A. S. Johnson, A. Selimovic and R. S. Martin, Anal. Methods, 2011, 3, 1072–1078 RSC
- Y. Wang, J. Lu, L. Tang, H. Chang and J. Li, Anal. Chem., 2009, 81, 9710–9715 CrossRef CAS PubMed
Footnote |
| † Electronic supplementary information (ESI) available. See DOI: 10.1039/c7ra09075g |
| This journal is © The Royal Society of Chemistry 2017 |