
 Open Access Article
 This Open Access Article is licensed under a Creative Commons Attribution-Non Commercial 3.0 Unported Licence
Synthesis and characterization of cobalt hydroxide carbonate nanostructures
Xuehao Lina,
Hui Li a,
Farayi Musharavatib,
Erfan Zalnezhad*a,
Sungchul Bae*c,
Bum-Yean Chod and
Oscar K. S. Huie
a,
Farayi Musharavatib,
Erfan Zalnezhad*a,
Sungchul Bae*c,
Bum-Yean Chod and
Oscar K. S. Huie
aDepartment of Mechanical Convergence Engineering, Hanyang University, 222 Wangsimni-ro, Seongdong-gu, Seoul, 133-791, Korea. E-mail: e.zalnezhad@gmail.com
bMechanical and Industrial Engineering Department, College of Engineering, Qatar University, 2713 Doha, Qatar
cDepartment of Architectural Engineering, Hanyang University, Seoul, 04763, Korea
dDepartment of Architectural Engineering, University of Seoul, Seoul, Korea
eSchool of Mathematics, University of East Anglia, Norwich, UK
First published on 4th October 2017
Abstract
Battery-type electrodes of three-dimensional (3D) hierarchical cobalt hydroxide carbonate arrays on Ni foam were fabricated using a hydrothermal method for use in supercapacitors. X-ray diffraction analysis, scanning electron microscopy, and transmission electron microscopy were used to characterize their structures and morphologies. The cobalt hydroxide carbonate synthesized with 10 h reaction time showed the highest specific capacitance (1381 F g−1 at a current density of 2 A g−1) and excellent cycling stability (92% capacitance retention after 5000 cycles). Moreover, its capacitance increased by 33% at 2 A g−1 and by 10% at 20 A g−1 after 5000 charge–discharge cycles. This cobalt hydroxide carbonate composite is a promising candidate for electrochemical energy-related applications.
1. Introduction
To address the diminishing supply of fossil fuels and their environmental impacts, intensive research has been carried out by the global scientific community toward the development of conversion devices and alternative energy storage technologies with high power, high energy density, high charge–discharge cycling ability, and long lifetime.1 Supercapacitors possess long cycle life, rapid charging and discharging rates, and high power density and can bridge the energy/power gap between fuel cells/batteries (which have high energy storage) and traditional dielectric capacitors (which have high power output). To a great extent, the performance and storage capability of supercapacitors are determined by the nature of the electrode material. Generally, supercapacitors are grouped into two types according to energy storage mechanism: faradic supercapacitors (FSs) and electrical double-layer supercapacitors (EDLSs).2,3 Carbon materials such as reduced graphene oxide, carbon nanotubes, carbon nanofibers, and activated carbon are being considered as potential electrode materials for EDLSs due to their low cost, abundance, high specific surface area, non-toxicity, high chemical stability, good electronic conductivity, and wide operating temperature range.4,5 Nevertheless, their energy density and low specific capacitance narrow their large-scale applicability. Compared to such EDLC carbon-based materials, pseudocapacitive materials like polyaniline (PANI), and conducting polymers such as polypyrrole (PPY) and transition metal oxides (MnO2, RuO2, NiO, Co3O4), have shown excellent specific capacitance.6,7 Due to its good electrical conductivity and multiple redox states, hydrous ruthenium dioxide (RuO2) has been assumed to be the most promising electrode material among the transition metal oxides.8 However, the toxicity and high cost of this noble metal are considerable obstacles for real applications.2,9,10 Hence, more work has been dedicated to other environmentally friendly and cheap inexpensive electrode materials. Cobalt hydroxide and its derivatives have attracted much attention as possible FS electrode materials because of their good electrochemical stability and high theoretical capacitance.11 Nonetheless, based on the literature, the theoretical value of Co(OH)2 is much higher than its specific capacity. Therefore, remarkable efforts have been concentrated on developing the electrochemical performance of Co(OH)2 by combining carbon materials and controlling morphology.12In this study, a one-step approach was applied to grow cobalt hydroxide carbonate directly on Ni foam (Co(OH)2(CO3)0.5/NF) using a hydrothermal technique conducted at 95 °C, with various synthesis times of 6, 10, and 14 h. The electrochemical capacitive performance of the cobalt hydroxide carbonates formed after the various reaction times was examined using electrochemical impedance spectroscopy (EIS), galvanostatic charge–discharge (GCD) measurements, and cyclic voltammetry (CV).
2. Experimental details
All chemicals were of analytical grade and were used as received. Co(No3)2·6H2O, urea, and HCl were purchased from Samchun (Korea). Nickel foam was purchased from Yierda (China).2.1 Synthesis
Prior to the hydrothermal process, nickel foam was sonicated in 1 M HCl solution for 20 min in order to remove any existing NiO film on the surface of the foam. This was followed by rinsing with absolute ethanol and distilled water several times. Finally, the Ni foam was desiccated overnight in an air oven at 60 °C.To synthesize cobalt hydroxide carbonate, urea (1.32 g) and Co(No3)2·6H2O (1.2 g) were added to 45 mL of deionized water and stirred for 20 min. The mixture was then transferred to a 100 mL Teflon-lined stainless steel autoclave holding 4 pieces of nickel foam (1 cm2) and then held at 95 °C for the growth time of 6, 10, or 14 h; the resulting products are abbreviated CCH-6, CCH-10, and CCH-14, respectively. Once the autoclave cooled to ambient temperature, the pale pink product was rinsed with distilled water several times and dried overnight in an oven at 60 °C. Normally, urea will decompose into carbon oxide and ammonia when the temperature rises to 80 °C. Therefore, the formation of cobalt hydroxide carbonate included hydrolysis precipitation, whereby the urea continuously provided both hydroxyl and carbonate anions to generate cobalt hydroxide carbonate on the nickel foam.
The decomposition of urea can be expressed as follows:
| H2NCONH2 + H2O → 2NH3 + CO2 |
| CO2 + H2O → CO32− + 2H+ |
| NH3 + H2O → NH4+ + OH− |
The formation of cobalt hydroxide carbonate can be expressed as follows:
| 2Co2+ + 2OH− + CO32− ↔ Co2(OH)2CO3 |
2.2 Electrochemical characterization
A conventional three-electrode electrochemical cell in an electrochemical workstation (sp2, Zive) was applied to characterize the electrochemical properties of the electrode. Cycle stability measurements were conducted at 40 A g−1 for 5000 cycles. CV experiments were executed in the range of −0.1 to 0.6 V (vs. SCE) at various scan rates. The potential of 0.5 V (vs. SCE) at different current densities was adjusted for measuring the GCD curves. EIS measurements were performed over the frequency range of 100 kHz to 0.01 Hz at the open circuit potential with a 5 mV AC perturbation. The cobalt hydroxide carbonate served as the working electrode. A HgO electrode filled with 6 M KOH and a platinum electrode were respectively used as the reference and counter electrodes. A 6 M aqueous solution of KOH was used as the electrolyte.2.3 Characterizations
The structural and morphological properties of the specimens were characterized using field emission scanning electron microscopy (FESEM, LEO-1550) with an applied voltage of 5 kV. X-ray diffraction (XRD, Bruker D8 Advance X-ray) analysis of the specimens was carried out under Cu Kα radiation (λ = 0.15406 nm) at 40 kV and 30 mA. The scanning speed was 5° min−1 with 0.02° steps.3. Results and discussion
For fabrication of the electrode, the conventional hydrothermal method was used; this process includes transportation of metal ions to the nickel foam surface, adsorption and enrichment of ions, and nucleation and growth of cobalt hydroxide carbonate crystals.13 Through the hydrothermal process, the metal ions reacted with CO32− and OH− (decomposed from urea) to create cobalt hydroxide carbonate particles that grew directly on the nickel foam surface.14 The successful preparation of Co(OH)2(CO3)0.5 on nickel foam was confirmed using XRD. To exclude strong XRD peak signals of the Ni foam substrate, the cobalt hydroxide carbonate powder alone was subjected to XRD. Fig. 1 shows the XRD patterns of CCH-6 and CCH-10. However, XRD patterns of the samples showed an additional peak, attributed to a Co(OH)2 phase formed from OH− and Co2+ during the hydrothermal reaction.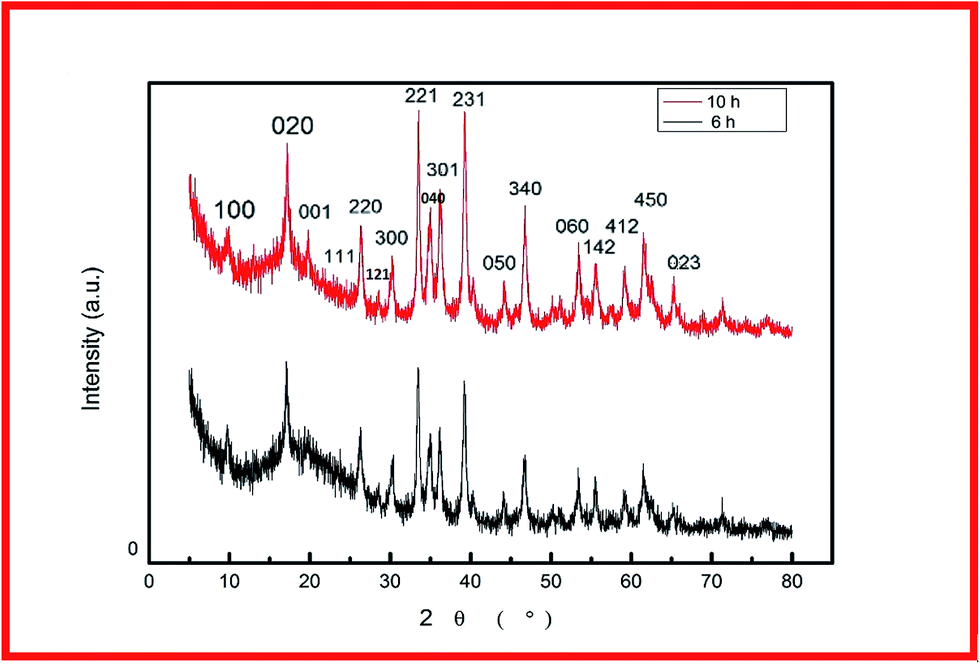 | ||
| Fig. 1 XRD patterns of CCH-6 and CCH-10. | ||
The morphology of a supercapacitor electrode material significantly influences its capacitance and cycling stability.15 The porous 3D network structure of nickel foam provides much area that form the unique structure and ion channel.16 Fig. 2a–c shows the morphology of CCH-6, clearly illustrating that the active material formed atop the substrate was comprised mainly of nanowires. The Co(OH)2(CO3)0.5 was uniformly arranged on the surface of the nickel foam, which is good for delivering electrons during the charging and discharging processes.17 Abundant open space and a rich electroactive surface can be generated by the dense nanowires. The presence of nanowires perpendicular to the surface and that are directly appended to the current collector avoids the need for binders and considerably decreases the “dead volume” in the electrode.18 The free space between nanowires is favorable for electrolyte diffusion into the electrode, reducing the hydroxide ion diffusion length. For the reaction time of 10 h, the nanowires tended to form acicular bundles several microns in size that were uniformly distributed over the sample (see Fig. 2d–f). Such acicular bundles offer many active points for redox reactions of the active material and enhance the surface contact between the electrolyte and the active material to improve the cycling stability and specific capacitance. After 14 h of hydrothermal reaction, the nanowires agglomerated into leaf-like structures, vastly decreasing the total surface area of the electrode material and thereby reducing its capacitance.
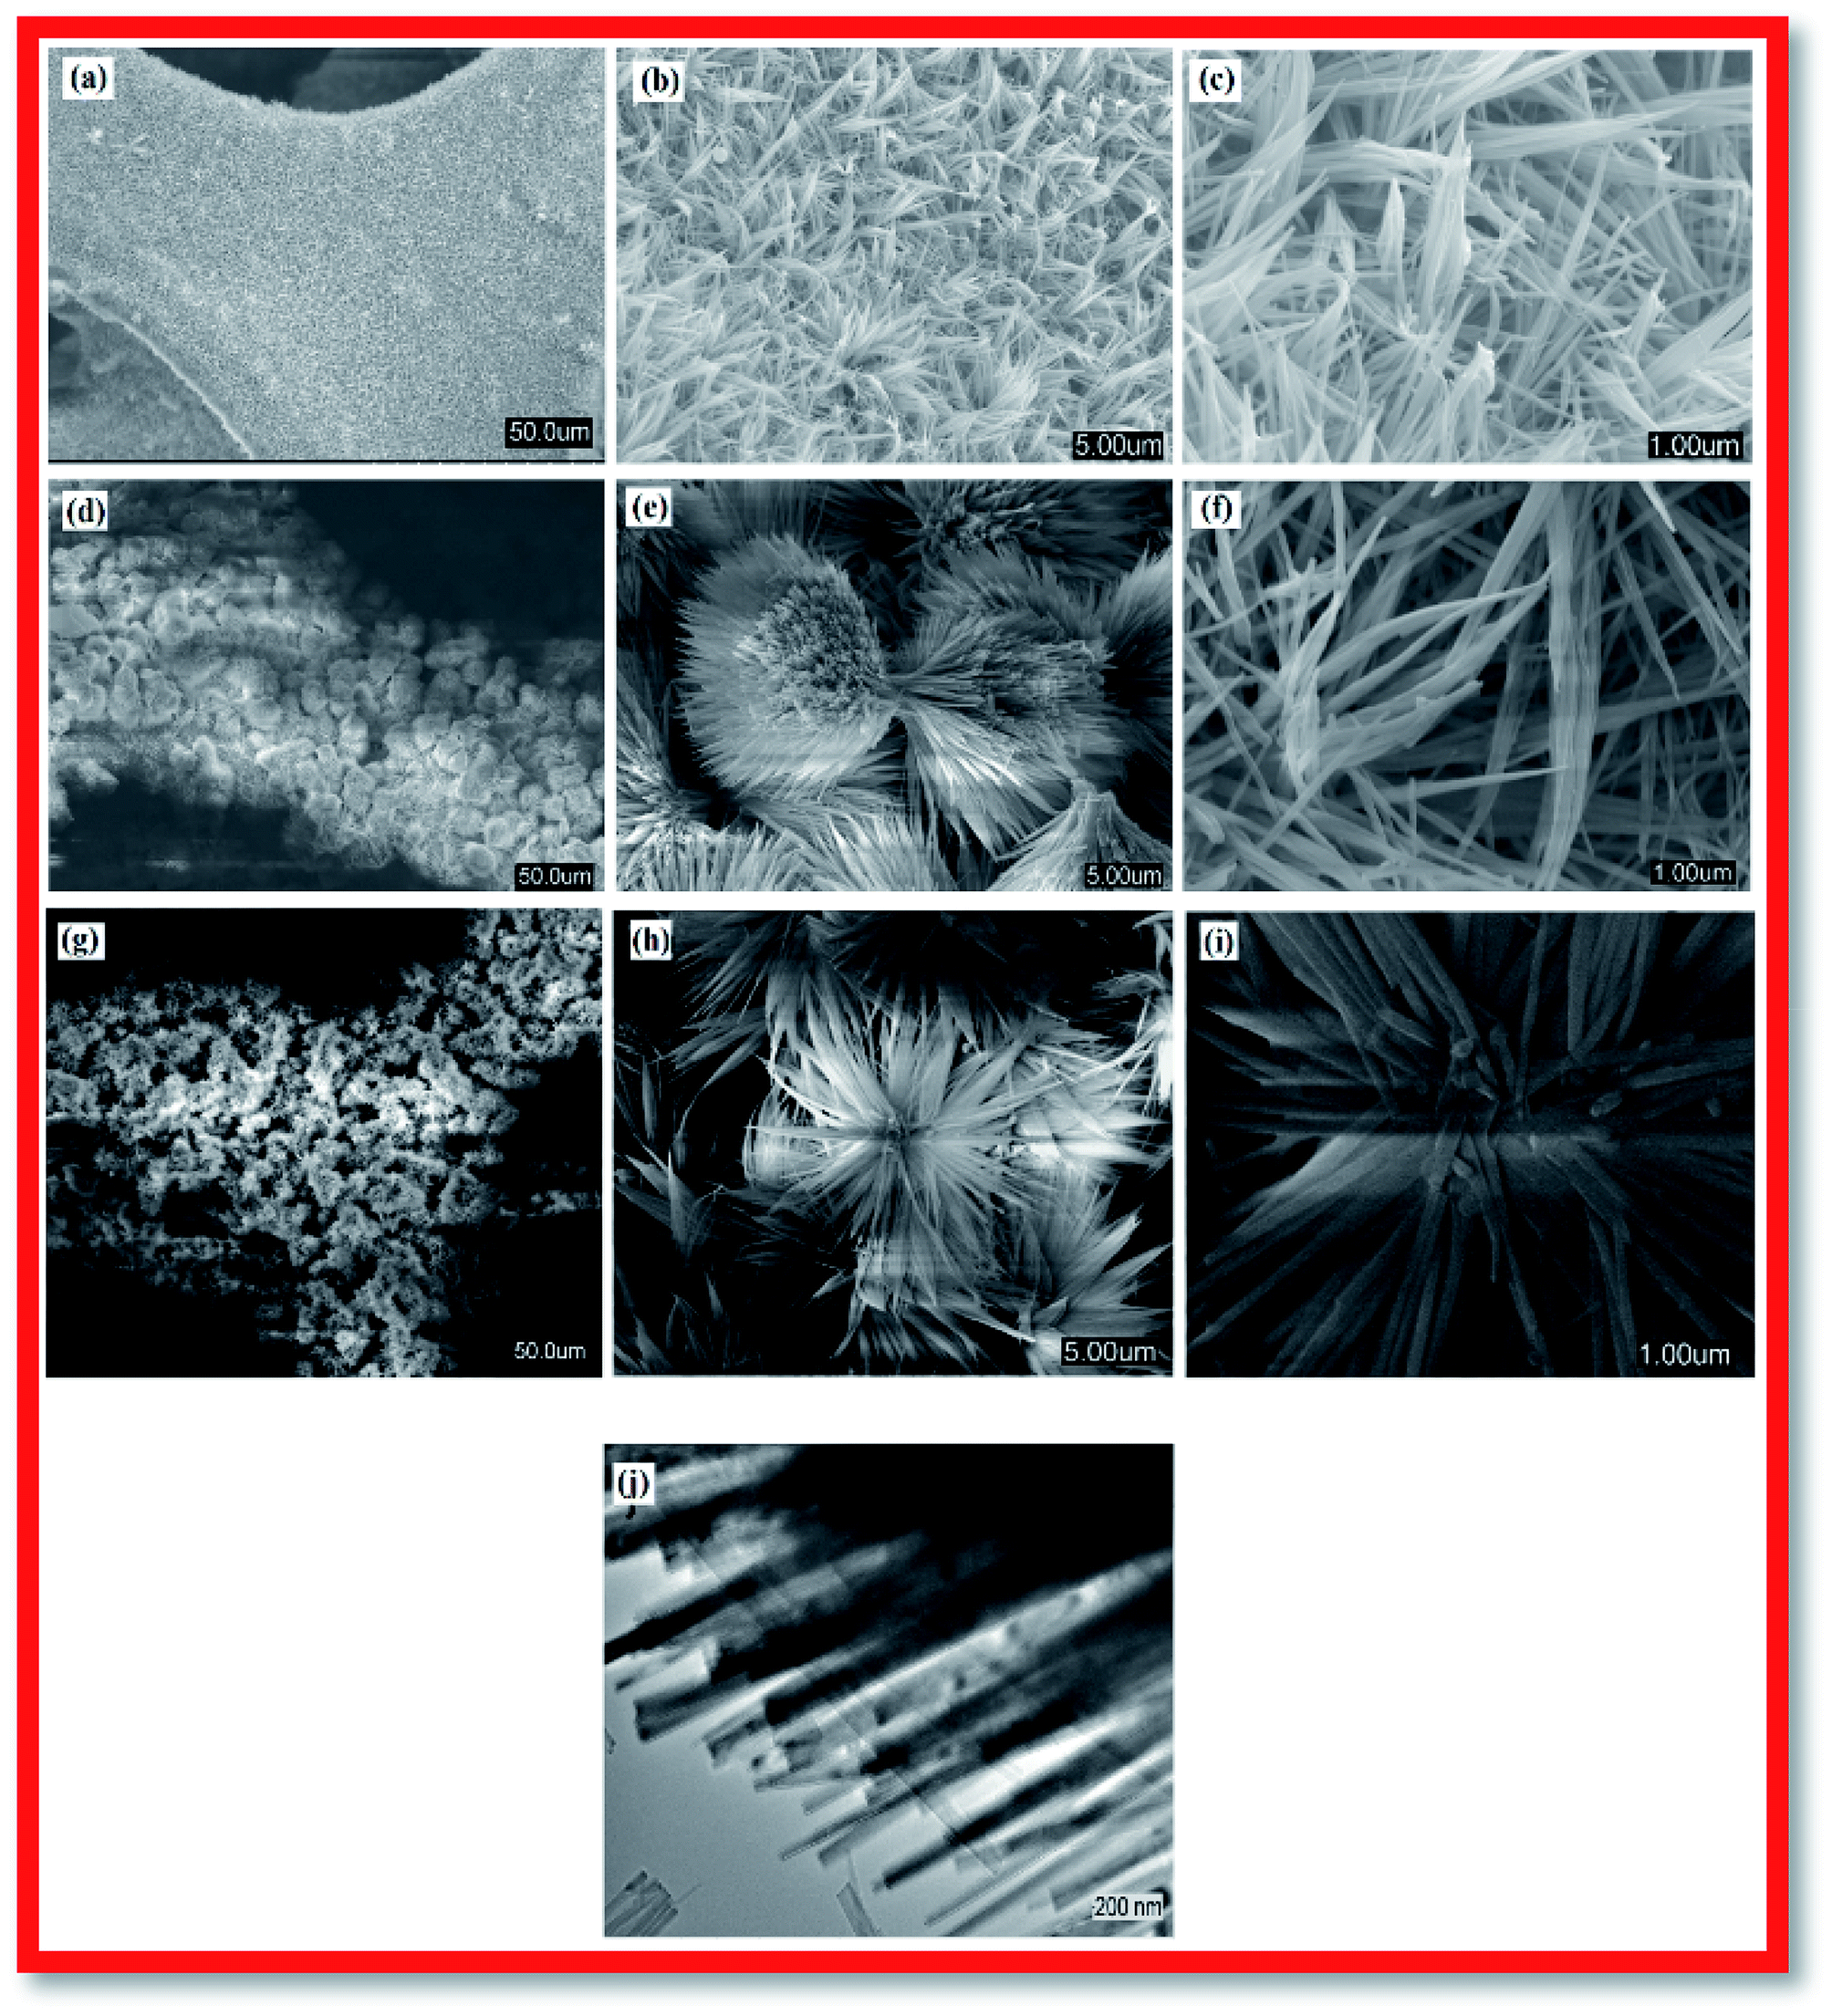 | ||
| Fig. 2 SEM images of (a–c) CCH-6, (d–f) CCH-10, and (g–i) CCH-14; (j) TEM image of CCH-10. | ||
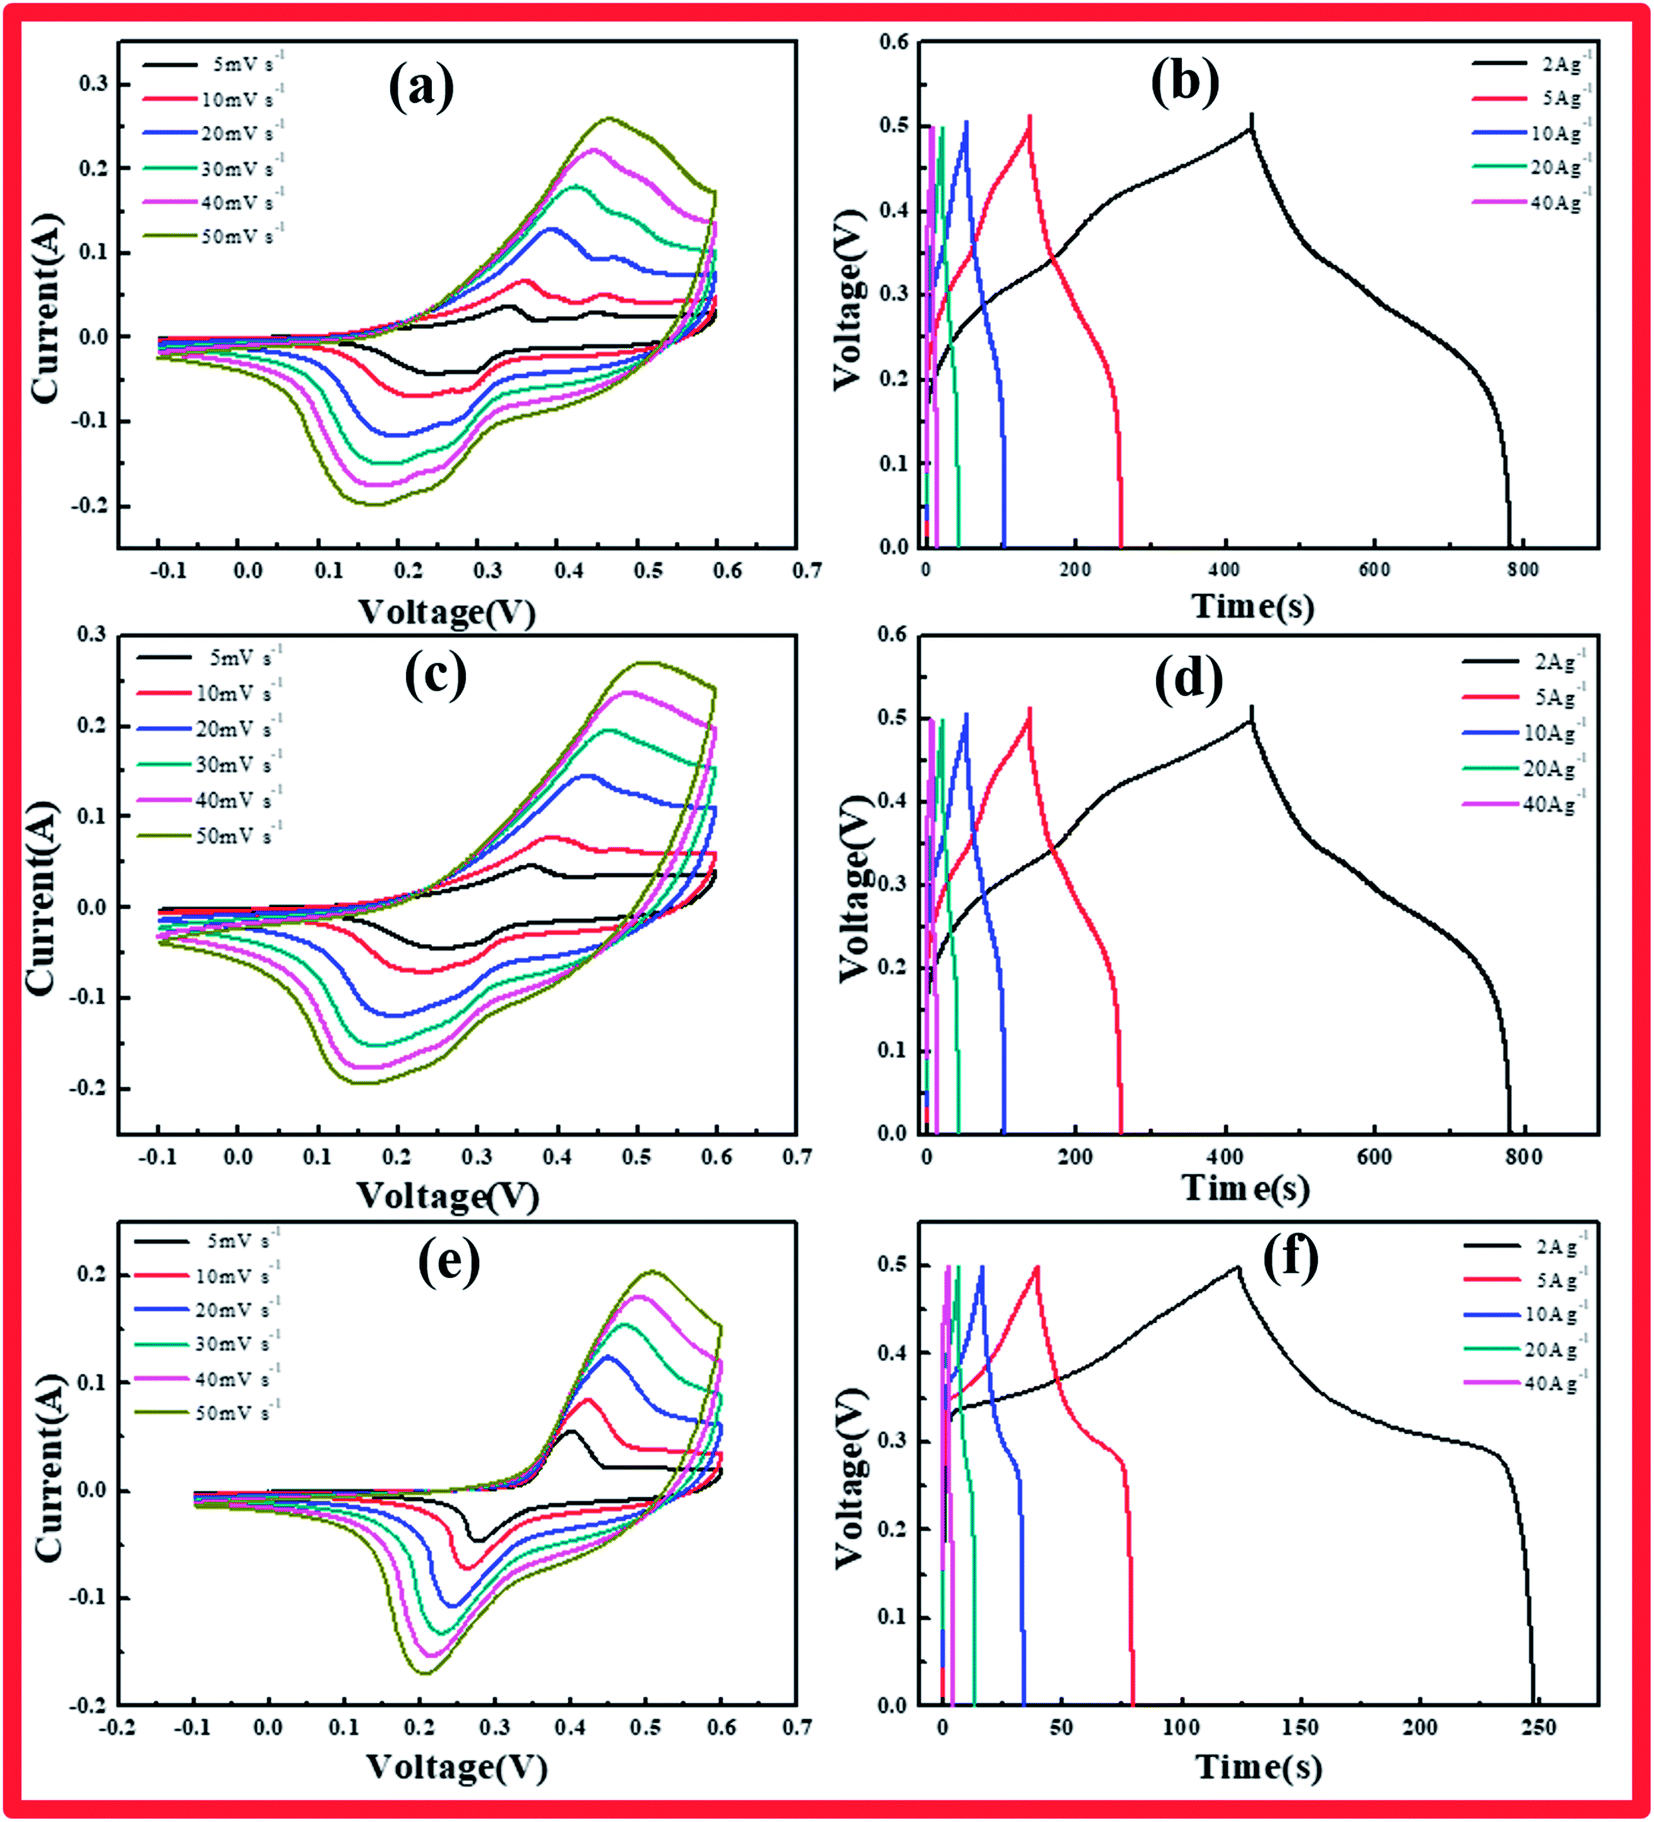 | ||
| Fig. 3 (a, c, e) CV curves collected at scan rates from 5 to 50 mV s−1 in 6 M KOH electrolyte, and (b, d, f) CD curves of cobalt hydroxide carbonate collected under various current densities from 2 to 40 A g−1 for cobalt hydroxide carbonate samples prepared using various reaction times: (a, b) CCH-6, (c, d) CCH-10, (e, f) CCH-14. | ||
The specimens were characterized by CV, GCD, and EIS to explore the electrochemical properties of the cobalt hydroxide carbonates prepared using various reaction times. Fig. 3a–f presents the CV and CD curves of cobalt hydroxide carbonate. CV analysis of these materials as electrodes was carried out at various scan rates from 5 to 50 mV s−1 in 6 M KOH solution over the range of −0.1 to 0.6 V (vs. HgO). A pair of redox peaks was clearly evident in each CV trace, representing the typical faradaic behavior of battery-type electrodes.19 The peaks arise from the faradaic redox process of Co2+/Co3+ based on the following reactions:
| Co(OH)2 + OH− → CoOOH + H2O + e− |
| CoOOH + OH− → CoO2 + H2O + e− |
The cathodic and anodic peaks in the CV curves shifted toward negative and positive potential, respectively, with increasing scan rate, continuously increasing the potential difference between the reduction and oxidation peaks, indicating the redox couple's quasi-reversible feature. This phenomenon arose from the increasing polarization of the electrode and ohmic resistance during the redox reaction at higher scan rates when the electrolyte ions diffused in the porous electrode.20
The Co(OH)2(CO3)0.5/NF electrode charge–discharge curves were collected under various current densities. The shapes of these curves showed mostly pseudocapacitance behavior, in agreement with the CV results. CCH-14 showed a standard battery-type curve due to its unique structure, which supplied broad channels for ion diffusion, unlike CCH-6 and CCH-10. The specific capacitance of each Co(OH)2(CO3)0.5/NF sample was calculated from these curves according to the following equation:
| C = (I/Δt)/(m/Δv) |
The specific capacitances of CCH-10 were calculated to be 1381, 1226, 1006, 827, and 525 F g−1 at scan rates of 2, 5, 10, 20, and 40 A g−1, respectively. For CCH-6, the specific capacitances were much higher: 1548, 1324, 1129, 951, and 583 F g−1 at scan rates of 2, 5, 10, 20, and 40 A g−1, respectively. CCH-6 better capacitance because of its structure of vertically oriented nanowires distributed on the nickel foam surface, which provided many more active sites to react with the electrolyte during the initial charge–discharge cycle. In this structure, almost all of the electrode's active surface area is in good contact with the electrolyte ions, allowing full reaction at low current densities, which leads to high capacitance. The capacitance drop observed with increasing scan rate might have arisen from a pore diffusion limitation.21
EIS analysis was conducted to examine the electrodes' fundamental behavior (Fig. 4). This analysis was performed over the frequency range of 100 kHz to 0.01 Hz. The curves of the three samples each showed a depressed arc in the high frequency region and an inclined line in the low frequency region.21,22 The curve intercept at the real axis (Z′) is equal to the internal resistance (Rs) in the high frequency region, which represents the sum of the contact resistance, the electrolyte, and the ohmic resistance of the active materials at the interface between the active materials and the current collector. These EIS results indicate that the three samples had nearly the same internal resistance. In the middle frequency region, a semicircular feature in each curve (corresponding to the charge transfer resistance Rct) represents the charge transfer process at the interface between the working electrode and the electrolyte. The charge transfer resistance is related to the electrode's electroactive surface area electroactive area leading to lower charge transfer resistance. The EIS results suggest that the specimen structure of the nanowire form yielded better charge transfer between the electrolyte and electrode. The structure of acicular bundles exhibited relatively high charge transfer resistance because the bundles hindered charge transfer. The Warburg impedance (W) was obtained from the curve slope of the low frequency region; W is determined by the diffusion of electrolyte in the porous electrode and the diffusion of protons in the materials.23
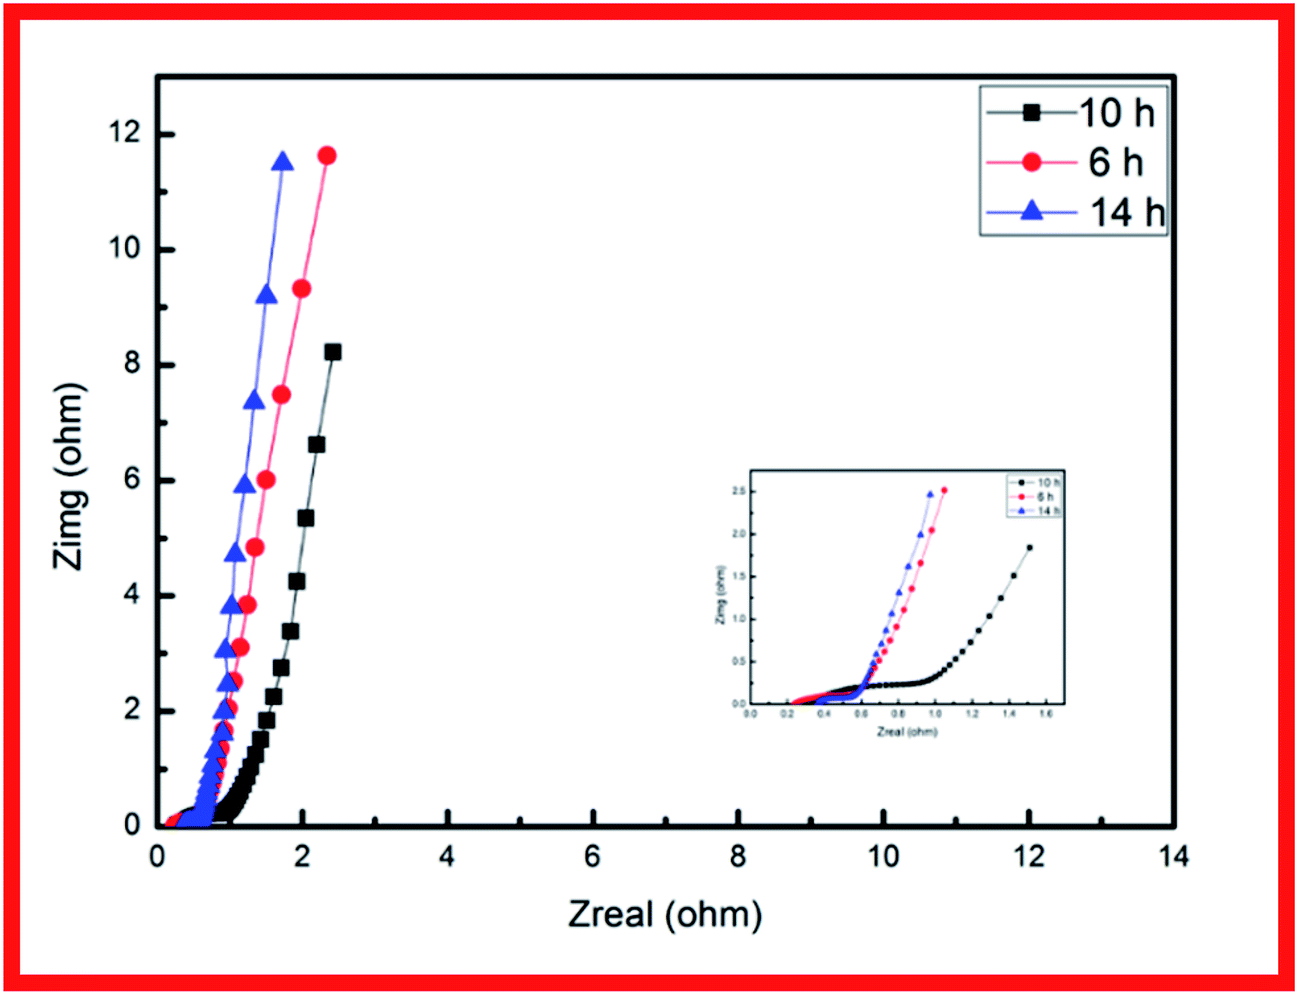 | ||
| Fig. 4 Nyquist impedance plots of CCH-6, CCH-10, and CCH-14. | ||
High cycle stability of electrodes is an important factor in their application in energy storage devices.24 Accordingly, the electrode materials were tested for 5000 charge/discharge cycles at a current density of 40 A g−1 (Fig. 5a) CCH-5(a). For the cobalt hydroxide carbonate with 10 showed capacitance retention of 92.5% after 5000 charge/discharge cycles. Interestingly, the capacitance of this electrode at low current density increased fast after the 5000-cycle test (1877 F g−1 at 2 A g−1, 1465 F g−1 at 5 A g−1, 1183 F g−1 at 10 A g−1 and 880 F g−1 at 20 A g−1). Compared with CCH-10, the CCH-6 electrode exhibited poorer stability. Its specific capacity decreased from an initial value of 583 F g−1 to 238 F g−1 during the 5000-cycle test (Fig. 5b). The CCH-14 electrode had both poor capacitance and poor cycle stability. The specific capacitance increase observed for CCH-10 might have been caused by the intrinsic property of cobalt carbonate hydroxide, which is that the cobalt carbonate can partly dissolve in water depending on its structure and the temperature. The robustness of the CCH-10 electrode will decrease during the charging and discharging process. Some of the aggregation partly dissolved in the water, allowing easy access of diffused ions to the structure and reaction with the active material.25 Fig. 5c shows CV curves of CCH-10 acquired before and after the 5000-cycle test, displaying its greater capacitance after the test. This might have been caused by the increase in surface area available to react with the electrolyte when the aggregation partly dissolved in the water.
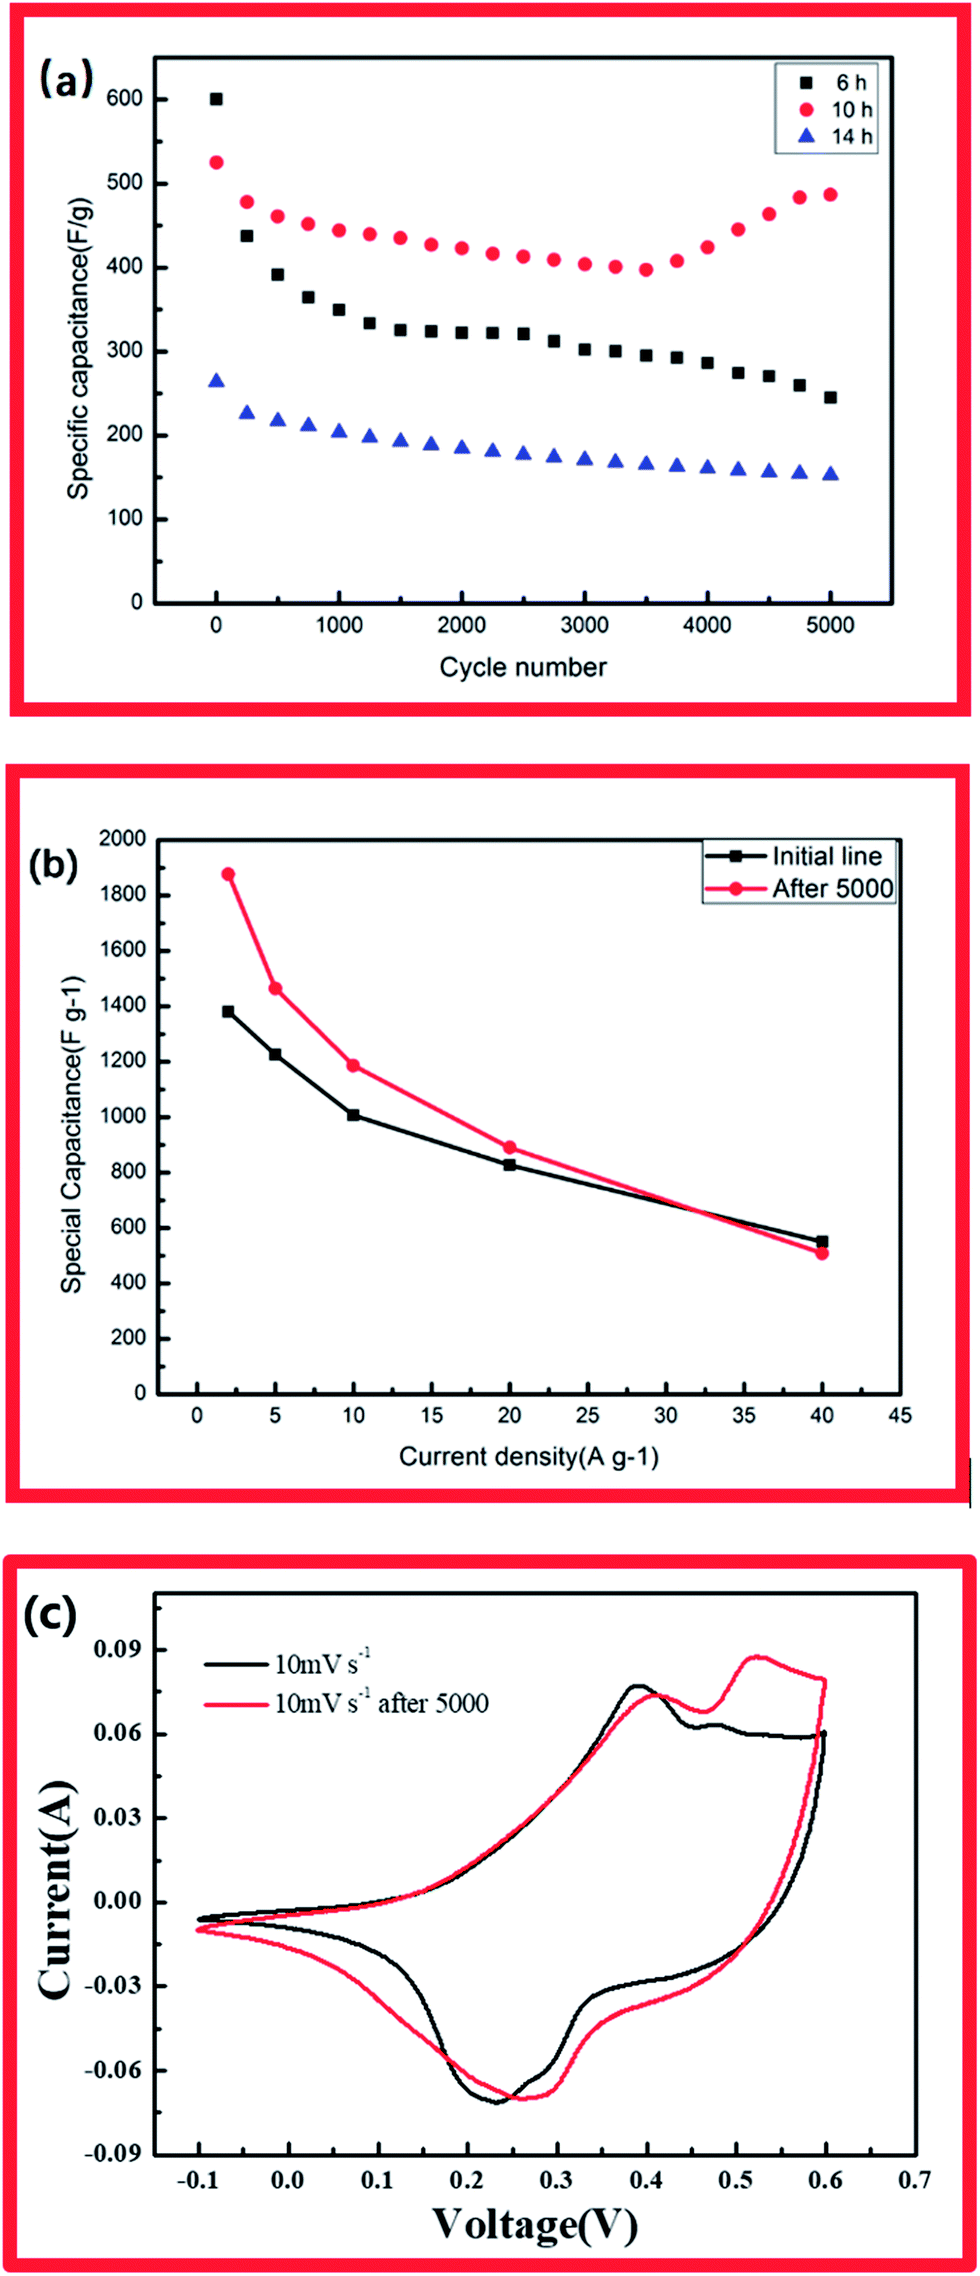 | ||
| Fig. 5 (a) Cycling stabilities of CCH-6, CCH-10, and CCH-14. (b) Specific capacitance of CCH-10 before and after a 5000-cycle test. (c) CV curves of CCH-10 acquired before and after a 5000-cycle test. | ||
4. Conclusions
In the present work Co(OH)2(CO3)0.5 arrays were directly grown on nickel foam by a simple hydrothermal method. The effect of reaction time on the supercapacitive performance of the resulting material was investigated. The morphology of the product could be controlled by tuning the growth time. CCH-6 and CCH-14 exhibited poor cycle stability, whereas CCH-10 had a unique high-surface-area structure of acicular bundles that allowed it to achieve higher capacitance (1381 F g−1 at 2 A g−1) and better stability (92% retention after 5000-cycle test at 40 A g−1). The CCH-10 electrode achieved better capacitance at low current density after a 5000-cycle test (1877 F g−1 at 2 A g−1, 1465 F g−1 at 5 A g−1, 1183 F g−1 at 10 A g−1 and 880 F g−1 at 20 A g−1). These performance metrics suggest great potential applicability of the CCH-10 material in supercapacitors.Conflicts of interest
There are no conflicts to declare.Acknowledgements
This work was performed at the Thin Film Coating Laboratory, Engineering Center, Hanyang University. The work was supported financially by Hanyang University, Young Faculty Forum and by a grant (16TBIP-C111710-01) from the Technology Innovation Program funded by the Ministry of Land, Infrastructure and Transport of the Korean Government.References
- J. Yang, T. Lan, J. Liu, Y. Song and M. Wei, Electrochim. Acta, 2013, 105, 489–495 CrossRef CAS.
- T. M. Masikhwa, J. K. Dangbegnon, A. Bello, M. J. Madito, D. Momodu, F. Barzegar and N. Manyala, J. Phys. Chem. Solids, 2016, 94, 17–24 CrossRef CAS.
- L. L. Zhang and X. Zhao, Chem. Soc. Rev., 2009, 38, 2520–2531 RSC.
- Z.-S. Wu, W. Ren, D.-W. Wang, F. Li, B. Liu and H.-M. Cheng, ACS Nano, 2010, 4, 5835–5842 CrossRef CAS PubMed.
- W. Gu and G. Yushin, WIREs Energy Environ., 2014, 3, 424–473 CrossRef CAS.
- C. Guan, X. Qian, X. Wang, Y. Cao, Q. Zhang, A. Li and J. Wang, Nanotechnology, 2015, 26, 094001 CrossRef CAS PubMed.
- M.-J. Deng, C.-Z. Song, C.-C. Wang, Y.-C. Tseng, J.-M. Chen and K.-T. Lu, ACS Appl. Mater. Interfaces, 2015, 7, 9147–9156 CAS.
- Y. Wang, J. Guo, T. Wang, J. Shao, D. Wang and Y.-W. Yang, Nanomaterials, 2015, 5, 1667–1689 CrossRef CAS PubMed.
- J. D. Tshifhiwa, M. Masikhwa, A. Bello, M. J. Madito, F. Damilola Momodu and N. Manyala, J. Phys. Chem. Solids, 2016, 94, 17–24 CrossRef.
- C. Yuan, L. Yang, L. Hou, L. Shen, X. Zhang and X. W. D. Lou, Energy Environ. Sci., 2012, 5, 7883–7887 CAS.
- P. Simon and Y. Gogotsi, Nat. Mater., 2008, 7, 845–854 CrossRef CAS PubMed.
- G. Yu, X. Xie, L. Pan, Z. Bao and Y. Cui, Nano Energy, 2013, 2, 213–234 CrossRef CAS.
- Y. Ruan, C. Wang and J. Jiang, J. Mater. Chem. A, 2016, 4, 14509–14538 CAS.
- S. Liu, K. San Hui, K. N. Hui, J. M. Yun and K. H. Kim, J. Mater. Chem. A, 2016, 4, 8061–8071 CAS.
- C. Xing, F. Musharavati, H. Li, E. Zalezhad, O. K. Hui, S. Bae and B.-Y. Cho, RSC Adv., 2017, 7, 38945–38950 RSC.
- W.-Y. Ko, Y.-F. Chen, K.-M. Lu and K.-J. Lin, Sci. Rep., 2016, 6, 18887 CrossRef CAS PubMed.
- M. Li, S. Xu, C. Cherry, Y. Zhu, R. Huang, R. Qi, P. Yang, L. Wang and P. K. Chu, Electrochim. Acta, 2014, 149, 18–27 CrossRef CAS.
- D. Guo, L. Lai, A. Cao, H. Liu, S. Dou and J. Ma, RSC Adv., 2015, 5, 55856–55869 RSC.
- R. Wang and X. Yan, Sci. Rep., 2014, 4, 3712 CrossRef PubMed.
- Q. X. Xia, K. San Hui, K. N. Hui, S. D. Kim, J. H. Lim, S. Y. Choi, L. J. Zhang, R. S. Mane, J. M. Yun and K. H. Kim, J. Mater. Chem. A, 2015, 3, 22102–22117 CAS.
- L. Zhang, K. Hui, K. Hui, X. Chen, R. Chen and H. Lee, Int. J. Hydrogen Energy, 2016, 41, 9443–9453 CrossRef CAS.
- L. Zhang, K. N. Hui, K. San Hui and H. Lee, J. Power Sources, 2016, 318, 76–85 CrossRef CAS.
- C. Guan, J. Liu, C. Cheng, H. Li, X. Li, W. Zhou, H. Zhang and H. J. Fan, Energy Environ. Sci., 2011, 4, 4496–4499 CAS.
- H. Chen, T. N. Cong, W. Yang, C. Tan, Y. Li and Y. Ding, Prog. Nat. Sci., 2009, 19, 291–312 CrossRef CAS.
- Z. Yu, L. Tetard, L. Zhai and J. Thomas, Energy Environ. Sci., 2015, 8, 702–730 CAS.
| This journal is © The Royal Society of Chemistry 2017 |