 Open Access Article
Creative Commons Attribution 3.0 Unported Licence
A novel dual-emission QDs/PCDs assembled composite nanoparticle for high sensitive visual detection of Hg2+†
Jian Cuia,
Tianjiao Liua,
Dapeng Lianga,
Jiale Liub,
Kai Zhang b,
Bai Yang
 b and
Yang Ning
 *ab
*ab
aKey Lab of Groundwater Resources and Environment Ministry of Education, College of Environment and Resources, Jilin University, 2699 Qianjin Avenue, Changchun, 130012, P. R. China. E-mail: ningyang@jlu.edu.cn
bState Key Laboratory of Supramolecular Structure and Materials, College of Chemistry, Jilin University, Changchun, 130012, P. R. China
First published on 23rd October 2017
Abstract
Traditional fluorescent probe detection is an established technique for enhancing or quenching luminescence intensity; however, a color changeable fluorescent material is still a challenge in many target detection fields. Herein, a dual-emission quantum dots (QDs)/polymer carbon dots (PCDs) assembled composite nanoparticle was prepared via a simple self-assembly method. By choosing the QDs and PCDs source, the luminescence color of the composite nanoparticles can be controlled all over the visible light spectrum. The composite material possesses high sensitivity and selectivity with Hg2+; with increasing concentration of Hg2+, the luminescence color of the composite material changes from pink to violet, and at last blue. The detection limit of Hg2+ was 10 nM by luminescence spectrum, and 100 nM by visual observation, so it may be utilized for visual detection in environmental science and biology.
Introduction
Composite nanomaterials are very promising materials in photocatalytic,1,2 bio-imaging,3,4 environmental detecting,5 therapy,6 and other fields due to their excellent optical, electrical, magnetic, and thermal properties.7 With the development of this field, controllable structure, sensitive responsiveness, and low toxicity have become the main focus of many researchers.8 The controllable structure may adjust the physical and chemical properties of materials according to different applications, and sensitive responsiveness could exhibit exciting functions of the material. Further, low toxicity will enable the application fields of these materials to be widened.Semiconductor nanocrystals are one kind of classic fluorescent quantum dots (QDs) which have been researched in recent decades among many areas including chemistry,9 biology,10 medicine,11 pharmacology,6 and videography12 because of its fascinating optical properties. Usually, luminescence of semiconductor nanocrystals can be altered among the whole visible light spectrum according to the quantum size effect. However, the inherent deleterious crisis from the heavy metal ions of QDs makes people hesitate with applications of these semiconductor nanocrystals.4,13–15 Meanwhile, carbon dots (CDs), especially polymer carbon dots (PCDs) which are considered as a promising material, have been developed rapidly in the last few years.2,16 Because the main constituent of PCDs is carbon, which possesses very low toxicity,17 they are considered as an environmentally friendly nanomaterial. Therefore, many researches on the synthesis and application of PCDs have been explored such as water ion detection,18 trace elements analysis,19 an organic small molecular probe,20 photo catalyst,21 and the environmental energy field.22 The adjustment of PCDs comes from its excitation-dependent property; thus, tunable luminescence of PCDs with high fluorescent intensity in a wider visible region is still a challenge.
Here, we fabricated a dual-emission QDs/PCDs assembled composite nanoparticle by a simple self-assembly process. Luminescence of the dual-emission composite nanoparticle could be adjusted in a wider range to control the fluorescent QDs and the ratio between the QDs and the PCDs. Owing to a decrease of the heavy metal content in the composite material and the inter binding of the nanoparticles, toxicity from the QDs in the composite material would be reduced greatly. We also found that this dual-emission composite nanomaterial possessed an excellent property of Hg2+ ion detection; the detection limit of Hg2+ was 10 nM by luminescence spectrum, and 100 nM by visual observation.23 Because the PCDs were rich in amino groups and carboxyl groups, they could be modified easily and be used in further applications such as special recognition, biological probes, tissue imaging, etc.
Experimental section
Materials
Tellurium powder (99.8%), poly(maleic anhydride-alt-1-octadecene) (PMAO) powder, chloromethylstyrene N,N-dimethyloctadecylamine, and 4-vinylbenzyl chloride were purchased from Aldrich, USA. Sodium borohydride (NaBH4, 99%) and cadmium chloride (CdCl2·2.5H2O, 99%) were purchased from Sinopharm Chemical Reagent Co., Ltd., China, N,N-dimethyloctadecylamine and mercaptopropionic acid (MPA) were purchased from Acros, USA. Ethylenediamine (EDA) was purchased from Aladdin Company, China. Acetone, chloroform, and ethanol were all AR grade from Beijing Chemical Works, China. All materials were used as received.Characterization
High-resolution transmission electron microscope photos (HRTEM) were recorded on a JEM-2100F and an FEI Tecnai F20. The composite samples' corresponding TEM-EDX elemental mapping data were measured using energy-dispersive X-ray. The FT-IR spectra were recorded in the range of 4000–450 cm−1 using a Bruker Vector 22 spectrophotometer. Laser confocal scanning microscope (LCSM) images were obtained on a FV 1000 from OLYMPUS. Ultraviolet photoelectron spectrometer (UPS) data was measured using PREVAC UPS equipment. Fluorescence lifetime (FLT) was performed on Edinburgh FLS980 equipment, with a 100 Hz xenon lamp as light source. UV spectra were recorded with an ultraviolet and visible spectrophotometer (UV), Lambda_800 America and a fluorescence emission spectrum (FL) was recorded using SHIMADZU 5301PC equipment, with a 150 W xenon lamp and emission located in the 330–420 nm range. All photos were collected using a digital camera, and the fluorescent photos were collected using an ultraviolet laser (365 nm excitation).Synthesis of PCDs
The amphiphilic PCDs were synthesized by a hydrothermal method. An aqueous solution with 500 μL EDA and 150 mg PMAO in a polytetrafluorethylene (PTFE) reaction container was heated at 200 °C for 6 hours in a muffle furnace. After cooling to room temperature, the product was dialyzed with deionized water in a dialysis bag (Mw = 8000). A tiny amount of yellow solid was removed by a filter. The as prepared solution was stored for following experiments.Preparation of hydrophobic cadmium telluride (CdTe) QDs
The surfactant octadecyl-p-vinyl-benzyldimethylammonium chloride (OVDAC) and the CdTe QDs were synthesized according to our previous paper.24 The original concentration of Cd2+ was 10−3 M, and the molar ratio of Cd2+/MPA/HTe− was fixed at 1![[thin space (1/6-em)]](https://www.rsc.org/images/entities/char_2009.gif) :
:![[thin space (1/6-em)]](https://www.rsc.org/images/entities/char_2009.gif) 2.4
2.4![[thin space (1/6-em)]](https://www.rsc.org/images/entities/char_2009.gif) :
:![[thin space (1/6-em)]](https://www.rsc.org/images/entities/char_2009.gif) 0.2. To alter the surface polarity of the NPs, 30 mL CdTe aqueous solution and 6 mL OVDAC chloroform solution (5 mg mL−1) were mixed under vigorous stirring for 15 min, then the CdTe QDs product was transferred to the chloroform phase.
0.2. To alter the surface polarity of the NPs, 30 mL CdTe aqueous solution and 6 mL OVDAC chloroform solution (5 mg mL−1) were mixed under vigorous stirring for 15 min, then the CdTe QDs product was transferred to the chloroform phase.
Fabrication of dual-emission QDs/PCDs assembled composite nanoparticles
A 20 mL aqueous solution with 1.5 mL PCDs aqueous solution and 500 μL CdTe QDs chloroform solution was kept ultrasonicating for 15 min. When the cloudy solution turned to clear again, the dual-emission QDs/PCDs assembled composite nanoparticles were obtained.Detection of Hg2+
Typically, 2 mL of dual-emission composite nanoparticle aqueous solution prepared above was added into a cuvette. Certain amounts of Hg2+ and deionized water were added into the cuvette to make the total volume be 10 mL, and the final concentrations of Hg2+ were 1, 5, 10, 20, 50, 100, 200, 300, 400, and 500 nM. The fluorescence spectra of the dual-emission probe under a single wavelength excitation at 360 nm were recorded by a fluorescence spectrophotometer. All sensitivity and selectivity measurements were conducted in triplicate. The visible ion response was observed under a 365 nm UV lamp. To test for selectivity of Hg2+ among other metal ions, different kinds of metal ions including K+, Pb2+, Co2+, Ce3+, Sr2+, Al3+, and Cr3+ were added to the mixture solution in the same way to make their concentrations be 500 nM.Results & discussion
The structure and assembly process of dual-emission assembled composite nanoparticles are illustrated in Fig. 1. A two-step assembly method was applied to obtain the dual-emission assembled composite nanoparticles. First, PCDs with alkyl chains on the surface and CdTe QDs modified with hydrophobic surfactant were prepared separately. The PCDs were synthesized by a hydrothermal condensation reaction between PMAO and EDA which were rich with maleic units and amine units. The PMAO is a kind of alternating copolymer, and it has both the hydrophilic group-maleic anhydride and hydrophobic group – long carbon chain. The alkyl chains from 1-octadecene in PMAO were kept during the hydrothermal reaction, so amphiphilic PCDs were obtained. Since there were many negative charges on the surface of CdTe QDs, the aqueous CdTe QDs could be assembled easily with positively charged OVDAC by electrostatic interaction. The CdTe QDs modified with hydrophobic surfactant were transferred into the chloroform phase. Then the dual-emission assembled composite nanoparticles were obtained by assembly of amphiphilic PCDs and hydrophobic CdTe QDs under ultrasonic conditions because of the hydrophobic–hydrophobic interaction. During this process, two different luminescent properties of the PCDs and QDs were kept well in the composite nanoparticles.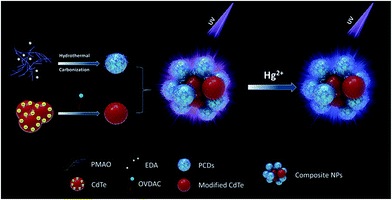 | ||
| Fig. 1 Schematic illustration of the formation of dual-emission fluorescent composite nanoparticles and the detection of Hg2+. | ||
The structure of PCDs was investigated by FT-IR spectroscopy (Fig. 3a). The sharp peaks of PCDs at 2923 cm−1 and 2852 cm−1 were similar to PMAO, which were attributed to the stretching vibrations of –CH3 and CH2. This meant the long alkyl chains from the PMAO were kept during the formation of PCDs under the hydrothermal condition, and it could combine with the CdTe QDs by hydrophobic–hydrophobic interaction. Compared with PMAO, there were three more obvious peaks at 1411 cm−1, 1570 cm−1, and 3396 cm−1 in the PCDs. The peaks at 1411 cm−1 and 1570 cm−1 were attributed to the N–H stretching vibration, and the peak at 3396 cm−1 was because of the stretching vibration of –NH2 groups and –OH groups. The FT-IR studies confirmed that the PCDs were composed of PMAO and EDA according to the hydrothermal reaction, and the important functional groups were kept separately. The fluorescence spectra are shown in Fig. 2b. The PCDs possessed an excitation-dependent property the same as many kinds of CDs in the literature25,26 and the optimal emission peak of the PCDs was at 433 nm (ex = 365), which was bright blue under UV light. The morphology of PCDs was observed by TEM as shown in Fig. 2c. The PCDs were nearly spherical and well-dispersed without any aggregation. Their size distribution (Fig. 2c insert) indicated that their average size was about 2.8 nm according to the statistics. Their interplanar distances were 0.21 nm and 0.32 nm which is consistent with the (100) and (002) crystallographic facets of graphite carbon.27
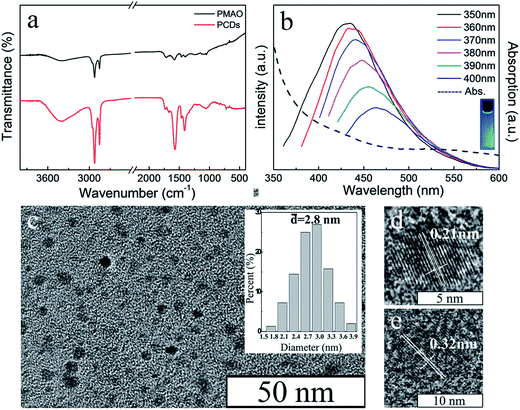 | ||
| Fig. 2 (a) FT-IR spectra of PMAO and PCDs. (b) Photoluminescence and absorption spectrum of PCDs. (c) TEM image and the size distribution (insert) of PCDs. (d) (e) HRTEM images of PCDs. | ||
In order to obtain a varied dual-emission assembled composite material, red emission CdTe QDs were chosen for this preparation. The CdTe QDs aqueous dispersion was synthesized according to our previous paper.24 The absorption and fluorescence spectra of CdTe QDs (Fig. 3a) showed that there was an obvious absorption in the range of 610 nm, and the emission wavelength of the CdTe QDs was about 640 nm. As shown in the TEM image (Fig. 3b), the sizes of the QDs were uniform, and their average diameter was about 3.2 nm. Their interplanar distances were 0.23 nm which is consistent with the (220) crystallographic facet of cubic CdTe.28
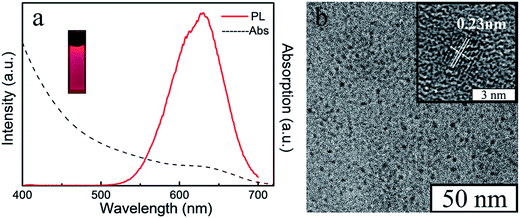 | ||
| Fig. 3 The UV absorption and photoluminescence spectrum (a), the fluorescent photo under the UV light (insert), the TEM image (b) and the HRTEM image (insert) of aqueous CdTe QDs. | ||
Then, the hydrophilic QDs were transferred to chloroform with OVDAC, which is a surfactant with alkyl chains. A red transparent chloroform dispersion was gained meaning the CdTe QDs were modified successfully by hydrophobic chains without any aggregation.
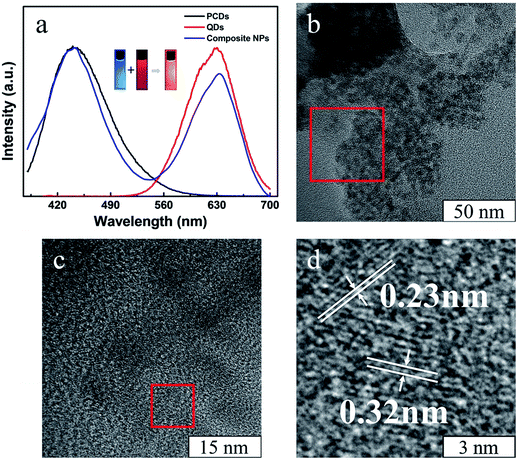
After the self-assembly process, dual-emission composite nanoparticles were obtained. In the fluorescence spectra (Fig. 4a), two kinds of luminescence from PCDs and QDs had been kept well in the dual-emission composite nanoparticles, and the composite light is about orange which was dependent on the ratio between the amounts of the two nanoparticles. The TEM and HRTEM images show that the composite nanoparticles are composed of two kinds of nanoparticles; two kinds of interplanar distances could be observed which correspond to the PCDs and QDs.
In order to prove that two kinds of nanoparticles were indeed assembled in one composite nanoparticle, element mapping TEM images were taken to confirm distribution of the particles. In Fig. S1,† the element mappings of C, Cd, and Te were taken in the same area. Although the density of the elements was very low, it still could be found that elements Cd and Te were in about the same area, which was inside the composite nanoparticle. At the edge of the composite nanoparticles, there should be some CDs, so that CdTe QDs with alkyl chains could be stable in the aqueous solution. Carbon mapping could not be observed clearly because a thin carbon film was on the copper grid which was used for TEM measurements and thus caused a lot of interference. Moreover, a confocal laser scanning microscope was used to investigate the fluorescent property of a single composite nanoparticle (Fig. S2†). Although the luminescence of smaller composite nanoparticles was not bright enough to be recorded, the confocal laser scanning microscope image still showed that the larger nanoparticles exhibited different fluorescent colors under different emission conditions which were accordant with the fluorescent spectra.
The fluorescent spectra of the composite nanoparticles were somewhat different from the spectra of single nanoparticles under the same concentration and measurement conditions in Fig. 4a. There was a slight red shift of the fluorescence peak of the QDs during formation of the composite nanoparticles. This may be due to aggregation of the CdTe QDs. Moreover, the composite nanoparticles assembled by CdTe QDs and the PMAO were prepared for comparison (Fig. S3†). Under the same conditions, the fluorescence intensity of the CdTe in the dual-emission composite nanoparticles was much higher than in the CdTe/PMAO composite nanoparticles; it was considered that the obviously fluorescence intensity change would be due to fluorescence resonance energy transfer (FRET) from the PCDs. In the HRTEM of the composite nanoparticles (Fig. 4d), the distance between the PCDs and the QDs was far less than 10 nm, and the emission wavelength range of PCDs about 433 nm was just in the absorption wavelength range of QDs. So, the composite nanoparticles possessed basic conditions for the FRET. Then, the fluorescence lifetime of the PCDs (Fig. 5a) was used to investigate the luminescent process of the composite nanoparticles. Compared with single PCDs, the fluorescence lifetime of PCDs in the composite nanoparticles reduced from 5.1 nm to 4.8 nm; this meant part of the energy would transfer from PCDs to the QDs. The ultraviolet photoelectron spectrometer data (Fig. 5b) indicated that the band gap of the PCDs was about 3.4 eV; this was much wider than 1.88 eV which was the band gap of the QDs.29 So, the energy from PCDs was enough to excite the QDs. Therefore, the luminescence addition of QDs was due to the FRET from PCDs.30
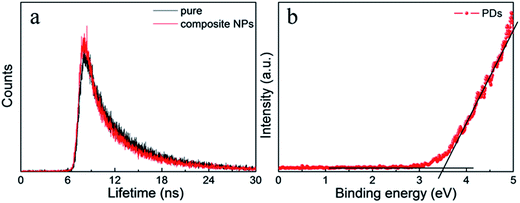 | ||
| Fig. 5 (a) The fluorescence lifetime decay curve at 433 nm of PCDs and the PCDs in the composite nanoparticles. (b) UPS curve of the PCDs. | ||
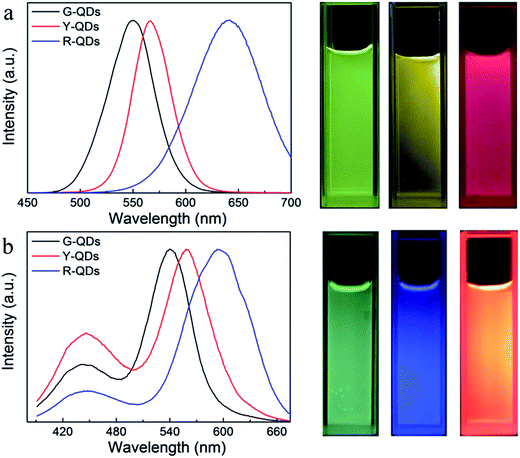
More colorful composite materials could be fabricated by different kinds of CdTe QDs and varying the ratio between the PCDs and QDs. As shown in the fluorescence spectra (Fig. 6a), the green, yellow, and red luminescent CdTe QDs, in which emission wavelength were 549 nm, 565 nm, and 640 nm respectively, were used to prepare the composite nanoparticles. And three corresponding different color composite nanoparticles were obtained (Fig. 6b).
Specific detection for heavy metal Hg2+
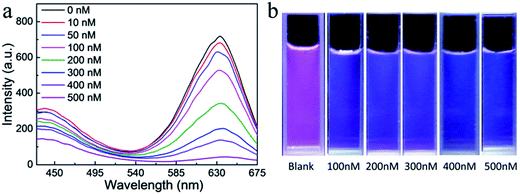
Both PCDs and QDs have been already successfully applied in ion detection by fluorescence intensity change. However, a fluorescence color changing detection system would be more sensitive in ion detection, especially for visual observation. The dual-emission assembled composite nanoparticles were excellent probes for detecting Hg2+. In fluorescence emission spectra (Fig. 7a), the fluorescence intensity of QDs and PCDs decreased with different ratios by adding different amounts of Hg2+. Because the composite color fluorescence of the dual-emission assembled composite nanoparticles were composed of blue from PCDs and red from QDs, therefore, the composite fluorescence would exhibit an observable color change from pink to cyan and finally to blue with different concentrations of Hg2+ (Fig. 7b). The detection limit for Hg2+ was 10 nM by fluorescence spectrum, and 100 nM by visual observation.A sensitive detection for the dual-emission composite nanoparticles was composed of two mechanisms of the PCDs and CdTe QDs. For the PCDs, due to abundant carboxyl groups on the surface of PCDs, it was easy for them to combine with the positive charged Hg2+ ions, so quenching occurred. For the QDs, the binding constant between Hg2+ and Te was larger than the constant between Cd2+ and the Te, so Hg2+ would replace Cd2+ on the surface of the QDs connecting with Te, which lead to quenching. With increasing the amounts of Hg2+, CdHgTe QDs would be formed, and a red shift would be observed in the fluorescent spectra.31 Because of the quenching of PCDs, the reduction of the FRET of the PCDs would lead to the weakness of QDs fluorescent intensity. Finally, the fluorescence intensity of PCDs and QDs reduced in the presence of Hg2+, and the reduction of QDs were more obvious. According to the FRET, the altering of the red emission intensity with Hg2+ in the dual-emission composite nanoparticles system was rather greater than in the single QDs system, so the detection of Hg2+ by dual-emission composite nanoparticles was more sensitive, and it could be used for visual detection under a low concentration of Hg2+. A comparison of the responses between the single PCDs or CdTe QDs and the composite nanoparticles had been studied as shown in Fig. S4.† The detection fluorescence intensity alteration of composite nanoparticles was much greater than with single nanoparticles. This indicated that the composite structure was established, and the FRET existed in the dual-emission assembled composite nanoparticles system. This special fluorescence property made the composite nanoparticles an ideal material for visual detection of Hg2+ ions. The response of the dual-emission fluorescent composite nanoparticles for Hg2+ detecting was very rapid. Under different concentration conditions, the fluorescence intensities of the composite nanoparticles could reach steady state within five minutes, thence it would have more advantages in practical applications.
To evaluate detection selectivity of the dual-emission fluorescent composite nanoparticles, different kinds of ions were used to investigate the fluorescent spectra (Fig. 8a) at a concentration of 500 nM. The fluorescence intensities of the composite nanoparticles with different ions had changed more or less. So, the fluorescence alteration intensity ratio (ΔI633/ΔI433) was used to study the composite luminescence of assembly nanoparticles. With different metal ions including Hg2+, Co2+, K+, Cr3+, Pb2+, Al3+, Sr2+, and Ce3+, only the fluorescence alteration intensity ratio of Hg2+ was very high. This meant the composite luminescence of assembly nanoparticles would change obviously only in the presence of Hg2+ (Fig. 8b). This high detection selectivity means the dual-emission composite nanoparticles could be used in some complex samples.
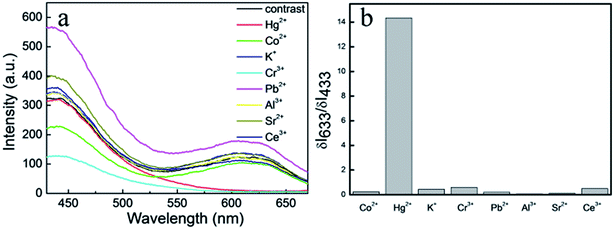 | ||
| Fig. 8 (a) Photoluminescence spectrum of composite NPs with different metal ions where the concentration was 500 nM. (b) The ΔI633/ΔI433 values of different ions. | ||
Conclusions
Dual-emission QDs/PCDs composite nanoparticles were prepared by a simple self-assembly method according to a hydrophobic–hydrophobic interaction. The dual-emission QDs/PCDs composite nanoparticles kept two different kinds of luminescence from PCDs and CdTe QDs. The luminescence color of the composite nanoparticles could be adjusted easily from blue to red simply by changing the CdTe QDs and the ratio between the amounts of PCDs and QDs. The composite nanoparticles possess high sensitivity and selectivity in detecting Hg2+; the detection limit of Hg2+ was 10 nM by luminescence spectrum, and 100 nM by visual observation. Because of the FRET in the composite nanoparticles, the luminescence color could be changed during the detecting of Hg2+; thus, it might be applied in some visible detecting areas.Conflicts of interest
The authors declare no competing financial interest.Acknowledgements
This work was supported by the NSFC (21404047), NSFC (51433003).References
- X. J. Cui, Y. H. Li, S. Bachmann, M. Scalone, A. E. Surkus, K. Junge, C. Topf and M. Beller, J. Am. Chem. Soc., 2015, 137, 10652–10658 CrossRef CAS PubMed.
- S. J. Zhu, Q. N. Meng, L. Wang, J. H. Zhang, Y. B. Song, H. Jin, K. Zhang, H. C. Sun, H. Y. Wang and B. Yang, Angew. Chem., Int. Ed., 2013, 52, 3953–3957 CrossRef CAS PubMed.
- H. J. Wang, C. H. Dong, P. Q. Zhao, S. Wang, Z. Y. Liu and J. Chang, Int. J. Pharm., 2014, 466, 307–313 CrossRef CAS PubMed.
- Y. F. Zhou, Q. Wang, B. Song, S. C. Wu, Y. Y. Su, H. M. Zhang and Y. He, Biomaterials, 2015, 72, 38–48 CrossRef CAS PubMed.
- D. Saika, P. Dutta, N. Sen Sarma and N. C. Adhikary, Sens. Actuators, B, 2016, 230, 149–156 CrossRef.
- W. Wu, J. Shen, P. Banerjee and S. Q. Zhou, Biomaterials, 2010, 31, 8371–8381 CrossRef CAS PubMed.
- R. G. Chaudhuri and S. Paria, Chem. Rev., 2012, 112, 2373–2433 CrossRef PubMed.
- C. S. Wu, M. K. K. Oo and X. D. Fan, ACS Nano, 2010, 4, 5897–5904 CrossRef CAS PubMed.
- Y. Ning, H. Zhang, J. S. Han, C. H. Yang, Y. Liu, D. Zhou and B. Yang, J. Mater. Chem., 2011, 21, 6837–6843 RSC.
- Y. Fu, C. Q. Ding, A. W. Zhu, Z. F. Deng, Y. Tian and M. Jin, Anal. Chem., 2013, 85, 11936–11943 CrossRef CAS PubMed.
- H. Y. Chen, B. W. Li, M. Zhang, K. Sun, Y. R. Wang, K. R. Peng, M. D. Ao, Y. R. Guo and Y. Q. Gu, Nanoscale, 2014, 6, 12580–12590 RSC.
- X. L. Dai, Z. X. Zhang, Y. Z. Jin, Y. Niu, H. J. Cao, X. Y. Liang, L. W. Chen, J. P. Wang and X. G. Peng, Nature, 2014, 515, 96–99 CrossRef CAS PubMed.
- X. H. Li, X. R. Yang, L. H. Yuwen, W. J. Yang, L. X. Weng, Z. G. Teng and L. H. Wang, Biomaterials, 2016, 96, 24–32 CrossRef CAS PubMed.
- Y. Y. Su, Y. He, H. T. Lu, L. M. Sai, Q. N. Li, W. X. Li, L. H. Wang, P. P. Shen, Q. Huang and C. H. Fan, Biomaterials, 2009, 30, 19–25 CrossRef CAS PubMed.
- D. K. Tiwari, T. Jin and J. Behari, Int. J. Nanomed., 2011, 6, 463–475 CAS.
- S. N. Baker and G. A. Baker, Angew. Chem., Int. Ed., 2010, 49, 6726–6744 CrossRef CAS PubMed.
- A. D. Zhao, Z. W. Chen, C. Q. Zhao, N. Gao, J. S. Ren and X. G. Qu, Carbon, 2015, 85, 309–327 CrossRef CAS.
- W. B. Lu, X. Y. Qin, S. Liu, G. H. Chang, Y. W. Zhang, Y. L. Luo, A. M. Asiri, A. O. Al-Youbi and X. P. Sun, Anal. Chem., 2012, 84, 5351–5357 CrossRef CAS PubMed.
- Y. Zhang, P. P. Cui, F. Zhang, X. T. Feng, Y. L. Wang, Y. Z. Yang and X. G. Liu, Talanta, 2016, 152, 288–300 CrossRef CAS PubMed.
- Y. H. Wang, C. Zhang, X. C. Chen, B. Yang, L. Yang, C. L. Jiang and Z. P. Zhang, Nanoscale, 2016, 8, 5977–5984 RSC.
- H. J. Yu, R. Shi, Y. F. Zhao, G. I. N. Waterhouse, L. Z. Wu, C. H. Tung and T. R. Zhang, Adv. Mater., 2016, 28, 9454–9477 CrossRef CAS PubMed.
- X. Y. Zhang, Y. Zhang, Y. Wang, S. Kalytchuk, S. V. Kershaw, Y. H. Wang, P. Wang, T. Q. Zhang, Y. Zhao, H. Z. Zhang, T. Cui, Y. D. Wang, J. Zhao, W. W. Yu and A. L. Rogach, ACS Nano, 2013, 7, 11234–11241 CrossRef CAS PubMed.
- J. P. Wang, L. Yang, B. H. Liu, H. H. Jiang, R. Y. Liu, J. W. Yang, G. M. Han, Q. S. Mei and Z. P. Zhang, Anal. Chem., 2014, 86, 3338–3345 CrossRef CAS PubMed.
- H. Zhang, Z. C. Cui, Y. Wang, K. Zhang, X. L. Ji, C. L. Lu, B. Yang and M. Y. Gao, Adv. Mater., 2003, 15, 777–780 CrossRef CAS.
- H. Ding, S. B. Yu, J. S. Wei and H. M. Xiong, ACS Nano, 2016, 10, 484–491 CrossRef CAS PubMed.
- L. L. Pan, S. Sun, A. D. Zhang, K. Jiang, L. Zhang, C. Q. Dong, Q. Huang, A. G. Wu and H. W. Lin, Adv. Mater., 2015, 27, 7782–7787 CrossRef CAS PubMed.
- H. Yu, R. Shi, Y. Zhao, G. I. N. Waterhouse, L. Wu, C. Tung and T. Zhang, Adv. Mater., 2016, 28, 9454–9477 CrossRef CAS PubMed.
- D. Yao, Y. Liu, W. Zhao, H. Wei, X. Luo, Z. Wu, C. Dong, H. Zhang and B. Yang, Nanoscale, 2013, 5, 9593 RSC.
- Q. S. Zeng, Z. L. Chen, Y. Zhao, X. H. Du, F. Y. Liu, G. Jin, F. X. Dong, H. Zhang and B. Yang, ACS Appl. Mater. Interfaces, 2015, 7, 23223–23230 CAS.
- Y. B. Lou, Y. X. Zhao, J. X. Chen and J. J. Zhu, J. Mater. Chem. C, 2014, 2, 595–613 RSC.
- H. Z. Sun, H. Zhang, J. Ju, J. H. Zhang, G. Qian, C. L. Wang, B. Yang and Z. Y. Wang, Chem. Mater., 2008, 20, 6764–6769 CrossRef CAS.
Footnote |
| † Electronic supplementary information (ESI) available. See DOI: 10.1039/c7ra09011k |
| This journal is © The Royal Society of Chemistry 2017 |

