 Open Access Article
Creative Commons Attribution 3.0 Unported Licence
Graphene decorated MoS2 for eosin Y-sensitized hydrogen evolution from water under visible light
Xing Liu†
 *ab,
Lanhua Zhao†c,
Hua Laib,
Yanyan Weib,
Guihua Yangb,
Shuangfeng Yin
 *a and
Zhengji Yib
aCollege of Chemistry and Chemical Engineering, Hunan University, Changsha, 410082, People's Republic of China. E-mail: sf_yin@hnu.edu.cn
bKey Laboratory of Functional Organometallic Materials of College of Hunan Province, College of Chemistry and Material Science, Hengyang Normal University, Hengyang, 421008, People's Republic of China. E-mail: liuxing1127@sina.com
cInstitue of Pathogenic Biolog, Hunan Provincical Key Laboratory for Special Pathogens Prevention and Control, University of South China, Hengyang, 421001, People's Republic of China
First published on 3rd October 2017
Abstract
Some two-dimensional nanomaterials, such as graphene and molybdenum disulfide, are presently being intensively investigated due to their excellent and unique performances. In the field of photocatalysis, MoS2 is considered as a promising alternative to noble metal Pt for the hydrogen evolution reaction (HER). However, its poor electrical conductivity restricts its catalytic activity in the HER. In this work, MoS2 was modified with graphene (G) by a simple hydrothermal method. The prepared G/MoS2 composite was characterized by X-ray diffraction (XRD), Fourier transform infrared spectroscopy (FTIR) and scanning electron microscopy (SEM). The results show that graphene modification does not influence the crystal phase of MoS2, but makes the latter more dispersed. The HER performance of G/MoS2 was evaluated using eosin Y (EY) as a photosensitizer, and triethanolamine (TEOA) as a sacrificial electron donor under visible-light irradiation (λ > 420 nm, 250 W high pressure Hg lamp as light source). The EY sensitized G/MoS2 composite displays enhanced hydrogen evolution in terms of not only activity but also stability. The average HER activity (9.1 μmol h−1) is three times that of EY sensitized pure MoS2 over 10 h. It is believed that the incorporation of graphene enhances the charge transfer ability and retards the self-degradation path of EY˙−, ultimately improving the HER.
1. Introduction
Photocatalytic water splitting into hydrogen, an ideal green energy carrier, by using sunlight is an attractive and sustainable solution to global energy and environmental problems.1–3 To perform the hydrogen evolution reaction, the photocatalytic system usually consists of a highly efficient photosensitizer (PS), a hydrogen evolution catalyst and a sacrificial electron donor. There have been a large number of reports on Ru complexes as PSs.4–6 Compared with transition metal complexes, organic dyes (without metals) are usually less expensive and more readily available. Xanthenes, including eosin Y(EY), rosebengal, erythrosin B, appear to be one kind of potential organic dyes that can be used as PSs for the photoreduction of water.7–13 Unfortunately, there is an instability problem of the dyes in these hydrogen production systems. This must limit the practical application of dye sensitization. The instability may be due to their own high chemical reactivity, taking EY for an instance, reductive quenching product EY˙− of excited EY (3EY*) which forms in the photocatalytic hydrogen systems, can undergo debromination reaction to decrease the sensitization activity of EY.14,15 It should be a good strategy for enhancing stability of the dye to transfer the electron of EY˙− by an excellent electron acceptor including catalyst.As catalysts, they should provide highly active sites for hydrogen formation and reduce the overpotential of hydrogen evolution significantly. Some noble metals, such as Pt, have been fully proven to be an effective cocatalyst/catalyst for this reaction.14–16 However, the scale-up application of the Pt-based catalysts is still hard at present on account of their scarceness and high-cost. Therefore, the exploration of alternatives consisting solely of earth-abundant elements as well as having highly activity is an important topic.
Molybdenum disulfide (MoS2) has been investigated in several fields including lithium ion batteries, photo-electrochemical solar cells, biosensors, super lubricants, photodetectors, catalysts, and so on, due to its unique chemical and physical properties.17–21 Recently, MoS2 has been reported to be used as a hydrogen evolution (co-)catalyst, but generally speaking, its activity is still low compared to Pt.22–27 Surface modification of MoS2 is a feasible means to improve its photoactivity.
As another typical two-dimensional nanomaterial, graphene has been attracting many interests due to its outstanding mechanical, thermal, optical, and electrical properties and wide applications.28–33 Surface modification of MoS2 with graphene (or its oxide) have been demonstrated to enhance the photo-induced charge transfer.34–41 However, very few works have paid attention to dye sensitized the MoS2/graphene composites, especially the stability issue for hydrogen evolution from water.
In this work, MoS2 was modified with graphene by a simple hydrothermal method and EY sensitized graphene/MoS2 exhibits improved not only activity but also stability of hydrogen production compared to EY sensitized MoS2 in the presence of triethanolamine (TEOA) as a sacrificial electron donor. This visible-light-driven hydrogen production system without noble metals is expected to contribute toward the development and practical application of photocatalytic technology.
2. Experimental
2.1 Preparation of graphene oxide and reduced graphene oxide
All the chemicals were of analytical grade and were used without further purification. Graphene oxide (denoted as GO) was synthesized by the modified Hummers method according to our previous work.42 In a typical process, natural graphite (1.0 g) and NaNO3 (0.50 g) were mixed with 23 mL of concentrated H2SO4 (98%) in an ice bath (≤4 °C), and the mixture was stirred for 20 min, then 6.0 g of KMnO4 was added within 60 min. The reaction system was kept at room temperature for 2 h, subsequently the suspension was rapidly heated to 95 °C and kept for 30 min, after that, the cold mixture (≤1 °C) of distilled water (100 mL) and H2O2 (10 mL) was added and the system immediately became yellow-brown, the resulting mixture was filtrated and washed with distilled water and absolute ethanol until the filtrate is neutral and no SO42− (determined with saturated BaCl2 solution) in it. The solid was dried in an oven at 80 °C and GO was obtained.GO was reduced by a chemical method with hydrazine hydrate (N2H4·H2O) as reductive agent. 0.3 g of GO powder was dissolved in 200 mL distilled water by sonication for 1 h to form GO aqueous solution, then 0.6 g of KOH and 10 mL of N2H4·H2O was added into above solution under continuous stirring, and then the reaction system kept refluxed at 98 °C for 12 h. Finally, the suspension was cooled and washed with distilled water and ethanol several times, and dried in vacuum at 60 °C. The obtained reduced graphene oxide was abbreviated as G.
2.2 Preparation of graphene decorated MoS2
The graphene decorated MoS2 nanohybrid (G/MoS2) was synthesized by a simple hydrothermal reaction. Typically, a given of as-prepared G powders were dispersed into 50 mL of H2O under sonication. After that, 5.0 mmol of sodium molybdate (Na2MoO4·2H2O) and thioacetamide (NH2CSNH2) were dissolved into the above suspensions under stirring, and then the mixture was transferred into a 100 mL Teflon-lined autoclave and heated in an oven at 180–220 °C for 16 h. The solid products were collected by filtration, washed carefully with water and ethanol for several times, and dried in a vacuum oven at 50 °C for 6 h. For comparison, the blank samples of MoS2 were prepared in the absence of G under the same experimental conditions. The G/MoS2 and MoS2 catalyst for photocatalytic hydrogen production were grinded in an agate mortar before using.2.3 Photocatalytic hydrogen generation
Photocatalytic reaction was performed in a 190 mL Pyrex cell with a side flat window. A 250 W high pressure Hg lamp was used as the light source, which was equipped with a cutoff filter (λ > 420 nm) to remove the radiation below 420 nm. The IR fraction of the beam was removed by a cool water filter to ensure illumination of visible light only. In a typical reaction, 0.10 g of G/MoS2 or MoS2 was added into 80.0 mL aqueous solution containing TEOA (9.5 × 10⁻² mol L−1) and a given concentration EY, whose pH was adjusted to 7.0 with HCl. Before photoreaction, the catalyst was dispersed in an ultrasonic bath for 5 min and high-pure N2 gas was bubbled through the reaction mixture for 30 min to remove oxygen completely. The top of the cell was sealed with a silicone rubber septum. Sampling was made intermittently through the septum during experiments. The amount of generated hydrogen was determined on a gas chromatograph (TCD, 13X molecular sieve column, N2 gas carrier).2.4 Characterization and instruments
X-ray diffraction (XRD) studies were carried out using a Bruker D8 ADVANCE polycrystalline X-ray diffractometer with nickel-filtered Cu Kα radiation as the X-ray source (λ = 0.15406 nm) at a scan rate of 0.05°. The Fourier transform infrared (FTIR) spectra were recorded in transmission mode from 400 to 4000 cm−1 at a resolution of 8 cm−1 on a Nicolet Magna 560 IR spectrometer using the KBr pellet technique. Scanning electron microscopy (SEM) images were taken on a EVO-10 (Carl Zeiss AG, Germany) working at 30 kV, the samples were mounted onto carbon adhesive pads attached to aluminum stubs. The Brunauer–Emmett–Teller (BET) specific surface areas were determined on an ASAP 2020 (Micromeritics Instruments, USA) nitrogen adsorption apparatus.3. Results and discussion
3.1 Characterization of the catalysts
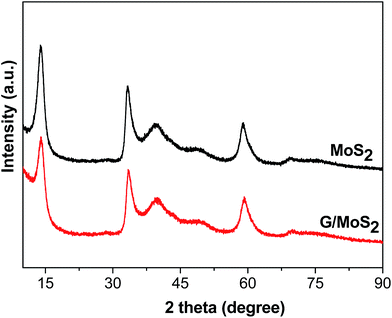
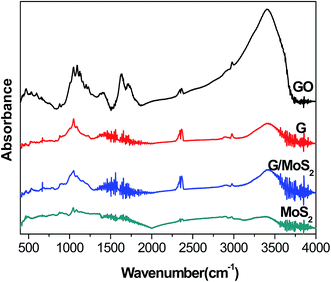
Fig. 1 shows the XRD patterns of the as-synthesized G/MoS2 and MoS2. The diffraction peaks located at 2θ = 14.0°, 33.4°, 39.8°, 49.4°, 59.3°, 69.9°, could be perfectly indexed to 2H–MoS2 (JCPDS 37-1492).43,44 No other impurities phases are detected within the instrument detection limit, which indicates a pure MoS2 hexagonal phase is formed. No characteristic diffraction peaks of graphene can be observed in G/MoS2 sample probably because the amount of graphene is low as well as its diffraction intensity is relatively low. The strongest peak at 2θ = 14.0° corresponds to (002) crystal plane of the hexagonal phase, indicating a typical lamellar structure along the c axis. The FWH values of (002) peak are 1.91°and 1.62° for G/MoS2 and MoS2, respectively. The peak intensity of G/MoS2 decreases and its FWH broadens, indicating that the MoS2 crystallite size becomes smaller after graphene modification.Fig. 2 shows FT-IR spectra of G/MoS2, MoS2, GO and G. The characteristic bands of GO are observed at 1047, 1092 cm−1 (alkoxy C–O stretching), 1200 cm−1 (phenolic C–OH stretching), 1399 cm−1 (carboxyl O–H stretching), 1625 cm−1 (C![[double bond, length as m-dash]](https://www.rsc.org/images/entities/char_e001.gif) C skeleton vibrations of graphitic domains), 1710 cm−1 (C
C skeleton vibrations of graphitic domains), 1710 cm−1 (C![[double bond, length as m-dash]](https://www.rsc.org/images/entities/char_e001.gif) O stretching vibrations of carboxyl or carbonyl groups) and 3400 cm−1(–OH bending vibration).30,45 While the intensities of these oxygen-containing functional groups decrease remarkably in G sample, suggesting that GO is nearly reduced by hydrazine. MoS2 exhibits a weak “S–Mo–S” absorption band (stretching vibrations) at 460 cm−1 approximately.40,46 The above bands of G and MoS2 can be observed in G/MoS2 sample. The vibration band around 2350 cm−1 characterizes CO2 (C
O stretching vibrations of carboxyl or carbonyl groups) and 3400 cm−1(–OH bending vibration).30,45 While the intensities of these oxygen-containing functional groups decrease remarkably in G sample, suggesting that GO is nearly reduced by hydrazine. MoS2 exhibits a weak “S–Mo–S” absorption band (stretching vibrations) at 460 cm−1 approximately.40,46 The above bands of G and MoS2 can be observed in G/MoS2 sample. The vibration band around 2350 cm−1 characterizes CO2 (C![[double bond, length as m-dash]](https://www.rsc.org/images/entities/char_e001.gif) O
O![[double bond, length as m-dash]](https://www.rsc.org/images/entities/char_e001.gif) C stretching) from the air due to our tests were directly conducted under the atmosphere.
C stretching) from the air due to our tests were directly conducted under the atmosphere.
As shown in Fig. 3, MoS2 is composed of sphere-like clusters and the cluster consists of many thin nanosheets, which is beneficial for the separation of photo-generated carriers. The MoS2 clusters are stacked together, implying that a significant aggregation occurs. The surface of G sheets (Fig. 3b) are very glossy and has a characteristic wrinkle, the sheets possess planar domains (sp2 π-conjugated network) and bending domains (sp3 regions, composed of lattice defects, oxygen groups and dangling bonds).31 In G/MoS2 sample (Fig. 3c), MoS2 clusters are tightly intertwined with graphene sheets, and the intimate contact makes the electronic interaction between MoS2 and graphene possible. The statistical particle size distributions of MoS2 and G/MoS2 were shown in Fig. 3d and e, the average diameter of MoS2 nanoparticles is 200 ± 50 nm, and it is 150 ± 50 nm for G/MoS2 nanoparticles. The decrease in average diameter of MoS2 reveals that they also become more dispersed, which is in agreement with the XRD results. It means that the G decoration can promote the nucleation of MoS2 but suppress the aggregation of MoS2 clusters, this is beneficial to hydrogen generation reaction.
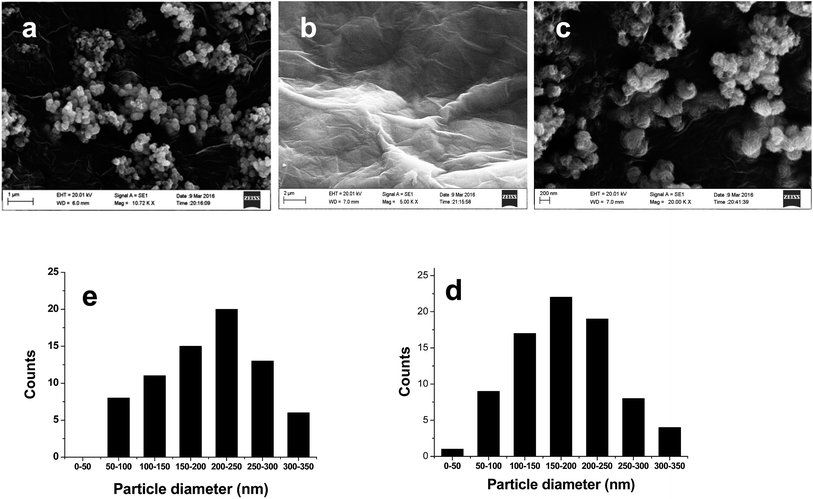 | ||
| Fig. 3 SEM images of (a) MoS2, (b) G and (c) G/MoS2, particle size distribution of (d) MoS2 and (e) G/MoS2. | ||
3.2 Dye sensitized hydrogen generation
A noble-metal-free hydrogen production system was constructed with the as-prepared G/MoS2 as a catalyst, eosin Y as a photosensitizer, and TEOA as a sacrificial electron donor. It is observed from Fig. 4 that G, EY-G (EY sensitized G) and G/MoS2 systems show negligible photocatalytic H2 evolution activity, suggesting that both MoS2 and EY are indispensable in our reaction system. And the EY-MoS2 (EY sensitized MoS2) system has a remarkable activity under the same experimental conditions. However, the amount of hydrogen generation from EY-G/MoS2 (EY sensitized G/MoS2) system within 2 h irradiation is near twice of that from EY-MoS2 system. The result indicates that the graphene modification can markedly enhance the sensitized activity for hydrogen generation. Besides, as shown in Fig. 5, the activity of EY-MoS2 system decreases to very low level after 5 h irradiation while EY-G/MoS2 system keeps almost constant activity for hydrogen generation within 10 h irradiation, suggesting that the stability of EY-G/MoS2 system is enhanced compared with EY-MoS2 system, and the average HER activity (9.1 μmol h−1) is about three times of that from EY sensitized pure MoS2 (3.1 μmol h−1) within 10 h. It can be explained as follows:44 (I) graphene could improve the transfer of the photogenerated electrons in the dye species to the edges of MoS2 and then react with adsorbed H+ ions to form H2. (II) The high concentration of electrons between the MoS2 layer and the graphene layer could greatly enhance the electronic conductivity of composites. (III) MoS2 becomes more dispersed in the presence of graphene, meaning more active sites for H2 evolution. Therefore the activities of composites are improved significantly.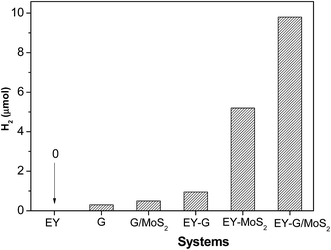 | ||
| Fig. 4 Photocatalytic H2 production of various systems. Conditions: 0.10 g catalyst, 2.0 × 10⁻³ mol L−1 TEOA, light source: 250 W high pressure Hg lamp, λ > 420 nm, irradiation time 2 h. | ||
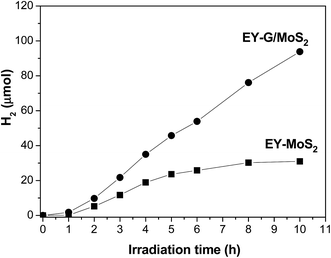 | ||
| Fig. 5 Time courses of photocatalytic H2 production of EY sensitized G/MoS2 and MoS2. The conditions as Fig. 4. | ||
The average rate of hydrogen production not high, the possible reasons include: firstly, the light source in our experiments was a 250 W high pressure Hg lamp (equipped with a cutoff filter (λ > 420 nm)), compared with xenon lamp, its light intensity was very low, so the photocatalytic activity is limited. Secondly, the overpotential for direct hydrogen evolution at MoS2 active sites is high, thus the rate is relatively slow compared to some others with noble metals which can reduces this overpotential.
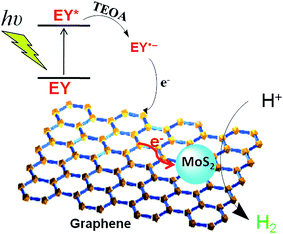
It is generally believed that, in EY sensitized hydrogen generation system, the charge transfer is mainly undertaken by 3EY*, which comes from singlet state through intersystem crossing after EY is excited by visible light irradiation. Previous works have demonstrated that 3EY* is prevailingly quenched reductively by electron donor TEOA to form radical EY˙− anion in photochemically driven electron-transfer step.15,47,48 EY˙− radicals have two dominating quenching paths: (I) injects its surplus electron into photocatalyst to reduce H+(H2O). (II) self-degradation, that is, C–Br bonds of EY˙− usually cleave very fast, leading to its photobleaching and the loss of photoactivity.15,49 Obviously, self-degradation path of EY˙− is detrimental to our targeted HER. The higher electrical conductivity of photocatalyst (electron acceptor) is, the stronger its electron transfer ability will be. The electron transfer from EY˙− to photocatalyst should take place highly effectively because the introduction of graphene indeed enhances the electrical conductivity of the G/MoS2 composite. This electron transfer from EY˙− can compete favorably with its debromination. So, in other words, debromination of EY˙− is inhibited to some extent. EY˙− radicals injects its surplus electron into G/MoS2 and transforms itself into original EY. As a result, the sensitization activity and stability of G/MoS2 improved. Based on the above discussions, a probable mechanism of the photosensitized hydrogen production is proposed as shown in Fig. 6.
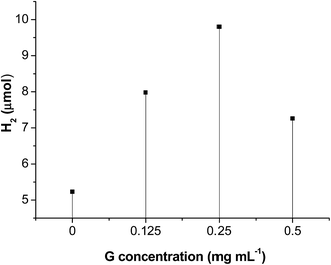
Some related reaction conditions were investigated. Fig. 7 described the effect of initial G concentration on hydrogen evolution. When G concentration increased from 0 to 0.25 mg mL−1, a positive impact on hydrogen evolution was observed. This may be ascribed to the increase of G promoting electron transfer as well as dispersion of MoS2. When GO concentration further increased to 0.50 mg mL−1, there was a negative impact on hydrogen evolution, because the introduction of a large percentage of black graphene leads to shielding of the MoS2 active sites, called a “shielding effect”. Therefore, a GO concentration of 0.25 g L−1 was found to be optimal. When G concentrations are 0, 0.125, 0.25, 0.50 mg mL−1, the BET specific surface areas of the prepared G/MoS2 samples are 19.7, 24.4, 27.1, 31.6 m2 g−1, respectively. This suggests that introduction of graphene increases the specific surface areas of G/MoS2 composites, which is in agreement with the SEM and XRD analyses. Since the heterogeneous photocatalysis is a surface-dependent reaction, a large surface area should provide more surface active sites for the adsorption of reactants, making the photocatalytic HER more efficient. Moreover, EY˙− species preferentially transfer their electrons to G and then to active sites of MoS2, leading to spatially separation of photogenerated charges, which could be understood by comparing their energy levels. Since the reductive potential of EY˙− is −0.8 V (vs. NHE) whilst the work function of G is 0.16 V and the conduction band potential of MoS2 is 0.20 V. The electron transfer from the EY˙− to G then to MoS2 is thermodynamically feasible. This enhanced electron transfer is also demonstrated by numerous reports.16,35,43,44
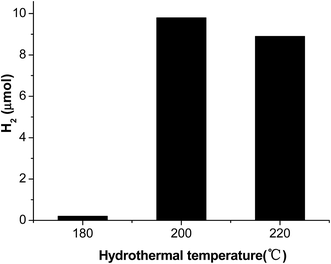
The effect of hydrothermal temperature on photocatalytic hydrogen evolution is shown in Fig. 8. When hydrothermal temperature alters from 180 to 220 °C, the MoS2 prepared at 200 °C shows the best hydrogen evolution activity. It can be easily understood that higher temperature is conductive to the crystallization of MoS2 as well as further reduction of graphene, while the average size of MoS2 nanosheets increases with increased hydrothermal temperature. As a photocatalyst, usually, MoS2 should have small size as well as high crystallinity, as a result of trade-off of the two kinds of factors, a optimal hydrothermal temperature at 200 °C occurs in our experiments.
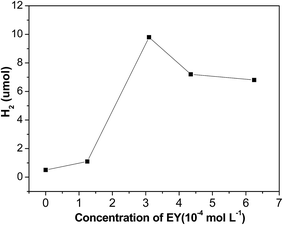
Fig. 9 shows the impact of EY concentration on hydrogen evolution. The photocatalytic activities increases first and then declines with increase of EY concentration, and reaches a maximum at 3.1 × 10⁻⁴ mol L−1. If no dye is added, only a little evolved hydrogen is observed, this demonstrates that hydrogen generation is indeed driven by dye sensitization. When concentration of EY increases from 0 to 3.1 × 10⁻⁴ mol L−1, the antenna effect of dye to absorb light is boosted, more and more radical EY˙− anion generates, thus the hydrogen evolution is enhanced. Nevertheless, when the concentration of EY is extremely high, many free dye molecules in solution absorb the input light but would not contribute to hydrogen evolution. Moreover, greater collisional deactivation of the 3EY* excited state happens due to serried dye molecules, so the activity of hydrogen evolution would not rise.
4. Conclusions
In summary, MoS2 was modified with graphene by a simple hydrothermal method, the graphene modification does not influence the crystal phase of MoS2, but makes it more dispersed. EY sensitized G/MoS2 composite displays enhanced photocatalytic hydrogen generation in terms of not only activity but also stability. It is believed that the incorporation of graphene enhances the charge transfer abilities and retards the self-degradation path of EY˙−, ultimately improving the photocatalytic H2 evolution. This kind of noble-metal-free dye-G/MoS2 system has great potential for photocatalytic H2 production under visible light irradiation.Conflicts of interest
There are no conflicts to declare.Acknowledgements
The authors are grateful for financial support of this research by the National Natural Science Foundation of China (21603065, 41773133), the Hunan Provincial Natural Science Foundation of China (2016JJ6013), the China Postdoctoral Science Foundation (2017M612547), the Scientific Research Fund of Hunan Provincial Education Department (17C1383), the Project of Science and Technology Bureau of Hengyang City (2016KJ67), the Aid Programs for Science and Technology Innovative Research Team on Functional Organometallic Compounds in Higher Educational Institutions of Hunan Province, and the Key Discipline of Material Physics and Chemistry of Hunan Province.References
- A. Kudo and Y. Miseki, Chem. Soc. Rev., 2009, 38, 253–278 RSC.
- X. Liu, J. Iocozzia, Y. Wang, X. Cui, Y. H. Chen, S. Q. Zhao, Z. Li and Z. Q. Lin, Energy Environ. Sci., 2017, 10, 402–434 CAS.
- M. D. Bhatt and J. S. Lee, RSC Adv., 2017, 7, 34875–34885 RSC.
- T. Y. Peng, K. Dai, H. B. Yi, D. N. Ke, P. Cai and L. Zan, Chem. Phys. Lett., 2008, 460, 216–219 CrossRef CAS.
- X. H. Zhang, U. Veikko, J. Mao, P. Cai and T. Y. Peng, Chem.–Eur. J., 2012, 18, 12103–12111 CrossRef CAS PubMed.
- E. Bae and W. Choi, J. Phys. Chem. B, 2006, 110, 14792–14799 CrossRef CAS PubMed.
- X. H. Zhang, T. Y. Peng and S. S. Song, J. Mater. Chem. A, 2016, 4, 2365–2402 CAS.
- J. Willkomm, K. L. Orchard, A. Reynal, E. Pastor, J. R. Durrant and E. Reisner, Chem. Soc. Rev., 2016, 45, 9–23 RSC.
- W. J. Jiao, Y. Q. Wu, G. X. Lu and H. W. Jing, RSC Adv., 2016, 6, 29538–29544 RSC.
- Z. G. Mou, Y. P. Dong, S. J. Li, Y. K. Du, X. M. Wang, P. Yang and S. D. Wang, Int. J. Hydrogen Energy, 2011, 36, 8885–8893 CrossRef CAS.
- W. Y. Zhang, Y. X. Li and S. Q. Peng, J. Mater. Chem. A, 2017, 5, 13072–13078 CAS.
- J. Y. Xu, Y. X. Li and S. Q. Peng, Int. J. Hydrogen Energy, 2015, 40, 353–362 CrossRef CAS.
- J. Y. Xu, Y. X. Li, S. Q. Peng, G. X. Lu and S. B. Li, Phys. Chem. Chem. Phys., 2013, 15, 7657–7665 RSC.
- X. Liu, Y. X. Li, S. Q. Peng and H. Lai, Acta Phys.-Chim. Sin., 2015, 31, 612–626 CAS.
- X. Liu, Y. X. Li, S. Q. Peng, G. X. Lu and S. B. Li, Int. J. Hydrogen Energy, 2013, 38, 11709–11719 CrossRef CAS.
- Z. Li, Q. S. Wang, C. Kong, Y. Q. Wu, Y. X. Li and G. X. Lu, J. Phys. Chem. C, 2015, 119, 13561–13568 CAS.
- J. Chen, S. L. Li, Q. Xu and K. Tanaka, Chem. Commun., 2002, 1722–1723 RSC.
- S. Y. Tai, C. J. Liu, S. W. Chou, F. S. S. Chien, J. Y. Lin and T. W. Lin, J. Mater. Chem., 2012, 22, 24753–24759 RSC.
- J. Xu, T. F. He, L. Q. Chai, L. Qiao, X. Q. Zhang, P. Wang and W. M. Liu, Phys. Chem. Chem. Phys., 2017, 9, 8161–8173 RSC.
- S. Mukherjee, R. Maiti, A. Midya, S. Das and S. K. Ray, ACS Photonics, 2015, 2, 760–768 CrossRef CAS.
- Q. Wang and J. H. Li, J. Phys. Chem. C, 2007, 111, 1675–1682 CAS.
- D. Merki and X. Hu, Energy Environ. Sci., 2011, 4, 3878–3888 CAS.
- B. Han and Y. H. Hu, Energy Sci. Eng., 2016, 4, 285–304 CrossRef CAS.
- T. T. Jia, M. M. J. Li, L. Ye, S. Wiseman, G. L. Liu, J. Qu, K. Nakagawa and S. C. E. Tsang, Chem. Commun., 2015, 51, 13496–13499 RSC.
- J. Choi, D. A. Reddy, N. S. Han, S. Jeong, S. Hong, D. P. Kumar, J. K. Song and T. K. Kim, Catal. Sci. Technol., 2017, 7, 641–649 CAS.
- M. C. Yin, C. J. Wu, F. F. Jia, L. J. Wang, P. F. Zheng and Y. T. Fan, RSC Adv., 2016, 6, 75618–75625 RSC.
- G. Malekshoar and A. K. Ray, Chem. Eng. Sci., 2016, 152, 35–44 CrossRef CAS.
- A. K. Geim, Science, 2009, 324, 1530–1534 CrossRef CAS PubMed.
- W. Y. Zhang, Y. X. Li, S. Q. Peng and X. Cai, Beilstein J. Nanotechnol., 2014, 5, 801–811 CrossRef PubMed.
- W. Y. Zhang, Y. X. Li and S. Q. Peng, ACS Appl. Mater. Interfaces, 2016, 8, 15187–15195 CAS.
- C. Mattevi, G. Eda, S. Agnoli, S. Miller, K. A. Mkhoyan, O. Celik, D. Mastrogiovanni, G. Granozzi, E. Garfunkel and M. Chhowalla, Adv. Funct. Mater., 2009, 19, 2577–2583 CrossRef CAS.
- X. Z. Gong, G. Z. Liu, Y. S. Li, D. Y. W. Yu and W. Y. Teoh, Chem. Mater., 2016, 28, 8082–8118 CrossRef CAS.
- B. Cecconi, N. Manfredi, T. Montini, P. Fornasiero and A. Abbotto, Eur. J. Org. Chem., 2016, 2016, 5194–5215 CrossRef CAS.
- R. K. Biroju, D. Das, R. Sharma, S. Pal, L. P. L. Mawlong, K. Bhorkar, P. K. Giri, A. K. Singh and T. N. Narayanan, ACS Energy Lett., 2017, 2, 1355–1361 CrossRef CAS.
- Y. G. Li, H. L. Wang, L. M. Xie, Y. Y. Liang, G. S. Hong and H. J. Dai, J. Am. Chem. Soc., 2011, 133, 7296–7299 CrossRef CAS PubMed.
- T. T. Jia, A. Kolpin, C. S. Ma, R. C.-T. Chan, W. M. Kwok and S. C. E. Tsang, Chem. Commun., 2014, 50, 1185–1188 RSC.
- Z. H. Deng, L. Li, W. Ding, K. Xiong and Z. D. We, Chem. Commun., 2015, 51, 1893–1896 RSC.
- X. Li, L. Zhang, X. B. Zang, X. M. Li and H. W. Zhu, ACS Appl. Mater. Interfaces, 2016, 8, 10866–10873 CAS.
- Y. X. Li, H. Wang and S. Q. Peng, J. Phys. Chem. C, 2014, 118, 19842–19848 CAS.
- K. Pramoda, U. Gupta, I. Ahmad, R. Kumar and C. N. R. Rao, J. Mater. Chem. A, 2016, 4, 8989–8994 CAS.
- L. Zhang, L. Sun, S. Liu, Y. H. Huang, K. W. Xu and F. Ma, RSC Adv., 2016, 6, 60318–60326 RSC.
- X. Liu, L. H. Zhao, H. Lai, S. Li and Z. Y. Yi, J. Chem. Technol. Biotechnol., 2017, 92, 2417–2424 CrossRef CAS.
- S. X. Min and G. X. Lu, J. Phys. Chem. C, 2012, 116, 25415–25424 CAS.
- K. Chang, Z. W. Mei, T. Wang, Q. Kang, S. X. Ouyang and J. H. Ye, ACS Nano, 2014, 8, 7078–7087 CrossRef CAS PubMed.
- Q. Li, B. D. Guo, J. G. Yu, J. R. Ran, B. H. Zhang, H. J. Yan and J. R. Gong, J. Am. Chem. Soc., 2011, 133, 10878–10884 CrossRef CAS PubMed.
- W. S. Nin, G. Z. Bian and Y. L. Fu, J. Zhejiang Univ. Technol., 2001, 3, 213–216 Search PubMed.
- X. Liu, Y. X. Li, S. Q. Peng, G. X. Lu and S. B. Li, Photochem. Photobiol. Sci., 2013, 12, 1903–1910 CAS.
- T. Lazarides, T. McCormick, P. W. Du, G. G. Luo, B. Lindley and R. Eisenberg, J. Am. Chem. Soc., 2009, 131, 9192–9194 CrossRef CAS PubMed.
- J. D. Hong, Y. B. Wang, J. S. Pan, Z. Y. Zhong and R. Xu, Nanoscale, 2011, 3, 4655–4661 RSC.
Footnote |
| † These authors contributed equally to this work. |
| This journal is © The Royal Society of Chemistry 2017 |

