
 Open Access Article
 This Open Access Article is licensed under a Creative Commons Attribution-Non Commercial 3.0 Unported Licence
Chitosan–gold nanoparticles as peroxidase mimic and their application in glucose detection in serum†
Cuifeng Jiang *,
Jing Zhu,
Zhao Li,
Juhua Luo,
Jinshan Wang and
Yu Sun
*,
Jing Zhu,
Zhao Li,
Juhua Luo,
Jinshan Wang and
Yu Sun
School of Materials Science and Engineering, Yancheng Institute of Technology, Yancheng, Jiangsu, China 224051. E-mail: cuifengj123@163.com
First published on 15th September 2017
Abstract
Artificial peroxidases have attracted considerable interest due to their significant advantages over their natural counterparts. Chitosan–gold nanoparticles (AuNPs) were discovered to function like a peroxidase in this study. The catalytic activity of AuNPs was illustrated by catalyzing the oxidation reaction of 3,3′,5,5′-tetramethylbenzidine (TMB) accompanied with a color change. The optimal catalytic activity was obtained at 50 °C and pH = 4.2. Interestingly, the peroxidase-like activity of AuNPs is higher than that of horseradish peroxidase and effective during a broad temperature range between 10–90 °C. The color change is dependent on the concentration of hydrogen peroxide, thus the determination of hydrogen peroxide was demonstrated with a limit of detection (LOD) of 0.6 μM. Furthermore, using peroxidase-like properties of the AuNPs, in combination with the highly specific reaction of glucose oxidase, selective detection of glucose was conducted with an LOD of 3 μM. In addition, the method was applied to detect glucose in 60% serum with an LOD of 12 μM. In conclusion, considering the high peroxidase-like activity, good cytocompatibility and ease of preparation, chitosan–AuNPs would have a wide range of potential applications in biocatalysis and bioassays.
1. Introduction
Recently, some inorganic nanoparticles have been discovered to show peroxidase-like activity, starting with the first report of Fe3O4 magnetic nanoparticles.1 These artificial enzymes have been extensively studied because of their advantages over naturally protein-based enzymes. Compared to the easy denaturation, high-cost and time-consuming preparation of natural enzymes, artificial nanomaterials could offer distinct advantages.2–4 Furthermore, the dual properties of enzyme and inorganic nano-material endow this kind of nanoparticles amazing characteristics. For instance, magnetic nanoparticles were found to possess intrinsic enzyme mimetic activity and a novel immunoassay was developed based on this finding.5 BSA-stabilized Au nanoclusters not only possess peroxidase-like activity, but also exhibit strong fluorescence emission. Based on these properties, a dual fluorometric and colorimetric sensor for dopamine in human serum sample and cells was constructed.6 Among known nanoparticles, Au nanoparticles are of particular interest and have been extensively exploited in sensing of metal ions, dopamine, small molecules and glucose. Until now, bare AuNPs,7 cysteamine–AuNPs,8 BSA–Au nanoclusters9 and gold nanocomposite, including Au@Pt,10 Au@Fe3O4,11 ZnFe2O4@Au,5 graphene/Au,12 Au@Ag,13–15 Cu@Au,16 Au@carbon dots17 have been found possessing intrinsic peroxidase-like activity. However, it remains a great challenge to synthesize peroxidase-like AuNPs with good cytocompatibility, stability and easy preparation.Glucose plays a crucial role in physiological processes as it is the primary source of energy for human body. However, imbalance of glucose in blood will lead to disease of diabetes. World health organization (WHO) reported more than 4.22 hundred million people suffered from diabetes until 2016. Therefore, development of sensitive and selective method to detect concentration of glucose gains great attention. Various methods for glucose detection have been reported, such as surface enhanced Raman spectra (SERS),18 fluorescence,19,20 colorimetric,21,22 dynamic light scattering23 and electrochemical method.24 Among these methods, colorimetric method is particular attractive due to its advantages like simple, fast and real-time monitoring.25 Using peroxidase-like activity of gold nanoparticles to fabricate colorimetric sensing assay for glucose are widely reported.10,13,14,26–28 However, most of these methods suffer from complex preparation, poor biocompatibility or infeasibility in real samples (e.g. serum). Therefore, it is urgent and important to develop an analysis platform for glucose based on Au nanoparticles with merits of easy preparation, good cytocompatibility and applicable in real samples.
Herein, gold nanoparticles were prepared by using HAuCl4 and chitosan, where chitosan serves as both the reducing and stabilizing agents. Chitosan–AuNPs were discovered to possess the ability to catalyze the oxidation reaction of TMB and H2O2, producing blue color product. Importantly, both the peroxidase-like activity and broad effective temperature (10–90 °C) of chitosan–AuNPs are much better than natural enzyme of horseradish peroxidase. The color change was used to detect concentration of H2O2 and glucose with help of absorption spectroscopy. The platform for detection of glucose displayed good selectivity and sensitivity with LOD of 3 μM. Furthermore, the designed assay can be used to detect glucose with LOD of 6 μM in 60% serum. Considering the cytocompatibility and peroxidase-like activity, chitosan–AuNPs are expected to display potential application in colorimetric detection of substances.
2. Experimental
2.1 Materials
Hydrogen tetrachloroaurate(III) hydrate (HAuCl4·3H2O) and TMB were obtained from Sigma-Aldrich. Chitosan (low viscosity, <200 mPa s), acetic acid, sodium acetate, NaH2PO4, Na2HPO4, H2O2 (30%), maltose, fructose, lactose, horseradish peroxidase (HRP), fetal bovine serum (FBS) were purchased from Sinopharm Chemical Reagent Co., Ltd (Shanghai, China). Glucose oxidase (GOX) was purchased from Sangon Biotech. All reagents and chemicals were at least analytical reagent grade and used as received without further treatment. Milli-Q water was used to prepare all solutions.2.2 Preparation of chitosan gold nanoparticles
All the glassware were cleaned with an aqua-regia solution (VHCl![[thin space (1/6-em)]](https://www.rsc.org/images/entities/char_2009.gif) :VHNO3 = 3:1) and rinsed with deionized water before use. Preparation of chitosan–gold nanoparticles followed a literature procedure with minor modification.29 In a typical experiment, to a flask with 10 mL of H2O, 1 mL of 2.9 mM HAuCl4 and 2 mL of chitosan (2.254 × 10⁻³ g mL−1 in diluted acetic acid) were added. Then, the mixture was heated to boil at 140 °C with vigorous stirring and color of solution turned to red after 5 min, indicating formation of AuNPs. The mixture was refluxed for another 20 min at 140 °C under vigorous stirring. The sample can be used after the solution cooled to room temperature (25 °C). The volume ratio of acetic acid to H2O is 1:9 (Vacetic acid:VH2O = 1:9) for chitosan solution. The concentration of Au element in the final product was measured to be 1.32 μg mL−1 by inductively coupled plasma-optical emission spectroscopy (ICP-OES).
:VHNO3 = 3:1) and rinsed with deionized water before use. Preparation of chitosan–gold nanoparticles followed a literature procedure with minor modification.29 In a typical experiment, to a flask with 10 mL of H2O, 1 mL of 2.9 mM HAuCl4 and 2 mL of chitosan (2.254 × 10⁻³ g mL−1 in diluted acetic acid) were added. Then, the mixture was heated to boil at 140 °C with vigorous stirring and color of solution turned to red after 5 min, indicating formation of AuNPs. The mixture was refluxed for another 20 min at 140 °C under vigorous stirring. The sample can be used after the solution cooled to room temperature (25 °C). The volume ratio of acetic acid to H2O is 1:9 (Vacetic acid:VH2O = 1:9) for chitosan solution. The concentration of Au element in the final product was measured to be 1.32 μg mL−1 by inductively coupled plasma-optical emission spectroscopy (ICP-OES).
2.3 Detection of H2O2 and glucose
(2) 300 μL of 5 mM TMB, 70 μL prepared chitosan–AuNPs and 300 μL of 0.2 M acetate buffer were added to A solution.
(3) The mixture was incubated at 50 °C for 10 min and cooled to room temperature for spectrophotometer detection, named solution B. In control experiment, maltose, fructose, lactose with concentration of 0.15 mM was used instead of glucose.
2.4 Instrumentations and characterizations
Photos of the samples were taken by using a Canon 80D digital camera. The micromorphology of as-prepared AuNPs was characterized by transmission electron microscopic (TEM) on a JEM-2011 with an accelerating voltage of 200 kV TEM. Ultraviolet-visible (UV-vis) extinction spectra were measured by using a Shimadzu UV-2600 spectrophotometer. Zeta potential were estimated on a Malvern Zetasizer NANO ZS Grain Size using diluted nanoparticles in deionized water. Fourier Transform Infrared spectra (FTIR) was performed on a NICOLET 5700 FT-IR Spectrometer by using original prepared nanoparticles solution. The concentration of Au element were determined using an inductively coupled plasma-optical emission spectroscopy (ICP-OES, Agilent 725), in which the prepared AuNPs solution were measured directly.3. Results and discussion
3.1 Peroxidase-like activity of chitosan–AuNPs
Bare AuNPs and cysteamine–AuNPs have been reported to exhibit peroxidase catalytic ability.7,8 In this paper, we demonstrate that chitosan–AuNPs exhibit peroxidase-like activity toward reaction of TMB and H2O2. Chitosan–AuNPs were prepared by using HAuCl4 and chitosan as shown in Scheme 1, where Au(III) is reduced by chitosan to produce gold nanoparticles and chitosan served as both a reducing agent and a stabilizer. Chitosan, a product derived from deacetylation of chitin, is biocompatible and nontoxic due to the high percentage of amino groups. Its presence guarantees the good stability and cytocompatibility of AuNPs. Electrostatic attractive forces between amino groups in chitosan and AuCl4− in solution provide the driving force in formation and stabilization of Au nanoparticles.29 The generation of the nanoparticles was accompanied by a series of color changes, from yellow, to colorless and red finally. The chitosan protected AuNPs from aggregation in solution and therefore AuNPs exhibited excellent stability, which can be stored in 4 °C for more than one month with good dispersion.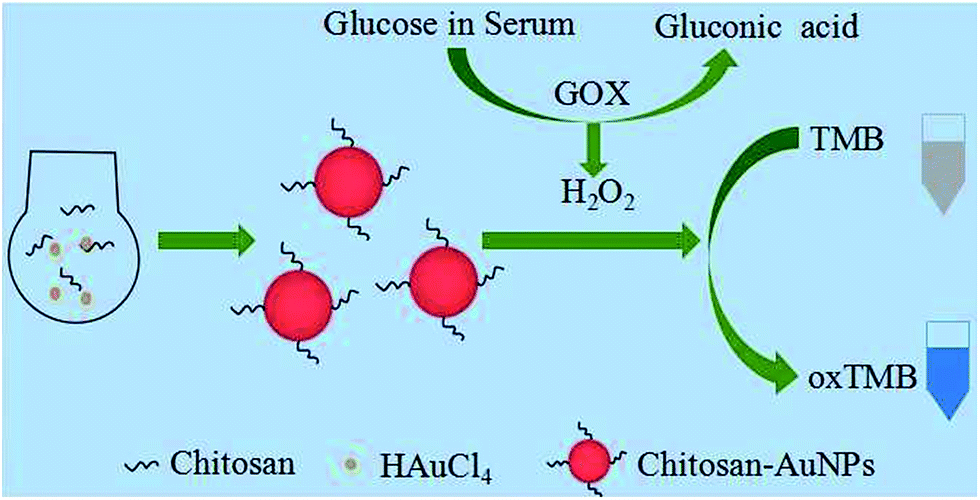 | ||
| Scheme 1 Illustration of the preparation process for chitosan–Au nanoparticles and sensing assay for glucose. | ||
The morphology and size of the prepared AuNPs were characterized by TEM. According to the images, the average diameter of prepared AuNPs is 15 nm (Fig. 1a). Then, the optical properties of AuNPs were investigated. Firstly, the UV-vis absorption spectra was obtained. As shown in Fig. 1b, AuNPs exhibited a strong localized surface plasmon resonance (SPR) peak at 528 nm. This property is almost in agreement with the previous report.29 The concentration of AuNPs was estimated to be 4.5 nM calculated following reported method c = A450/ε450 (ε450 = 2.18 × 10⁸).30 Moreover, the absorption bands from the surface functional groups of the AuNPs are obtained by Fourier transform infrared spectroscopy (FT-IR). Fig. 1c shows the IR spectra of Chitosan–AuNPs. The bands at 1650 cm−1 and 3500 cm−1 represent the presence of amino group and hydroxyl in the chitosan–AuNPs, respectively, which are important to facilitate the stability of the nanoparticles in aqueous state. These bands are assigned to presence of chitosan. Zeta potential of the solution was measured to be 27.5 mV, indicating the positively property of the solution. The charge on the particles endows them well dispersion in the medium.
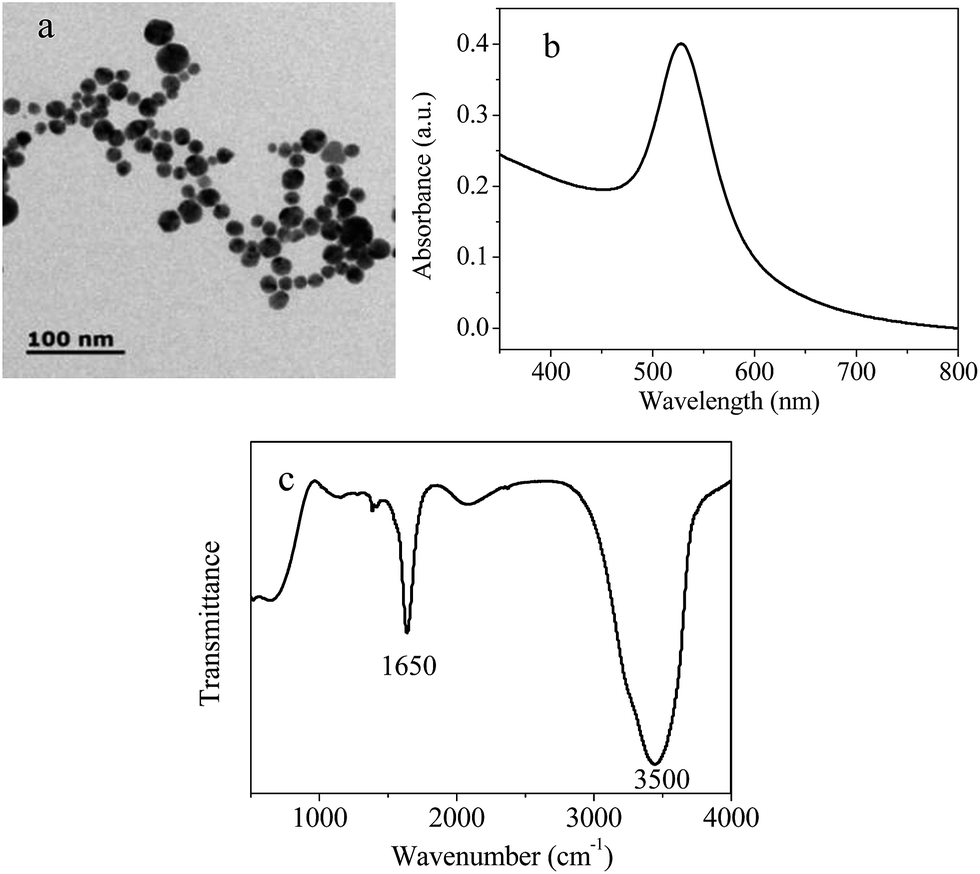 | ||
| Fig. 1 (a) TEM images (b) typical absorbance spectrum and (c) FTIR spectra of the prepared chitosan–AuNPs. | ||
The peroxidase-like behavior of the chitosan–AuNPs was estimated using TMB as a chromogenic substrate, which would display blue color when it meets peroxidase. To explore the peroxidase-like activity of synthesized AuNPs, solutions of AuNPs + TMB, AuNPs + H2O2, TMB + H2O2 and AuNPs + TMB + H2O2 were prepared and characterized. Results (Fig. 2a inset) showed that upon addition of AuNPs to TMB + H2O2, color of the solution changed from colorless to blue. That is because the chromogenic reaction was initiated by AuNPs and it couldn't be triggered without AuNPs. In addition, the alteration of the solution color was also consistent with the absorption spectra shown in Fig. 2a. Upon addition of AuNPs, an absorption peak at 652 nm appeared, which is a characteristic of the chromogenic reaction. Another property of the reaction is that H2SO4 can terminate the oxidation process and color of the solution will change to yellow. Both of the blue and yellow colors are characteristic of the peroxidase reaction. To figure out whether the chromogenic reaction happens, H2SO4 was added to AuNPs + TMB + H2O2 system. Fig. 2b shows the visual observation of the color. Clearly, after addition of H2SO4, color of the solution changed to yellow and absorbance at 652 nm disappeared accordingly. These data together confirmed that chitosan–AuNPs possess the peroxidase-like activity. Oxidase activity is another important property for enzyme, which means catalyzing the oxidation of TMB in the presence of O2 with blue color. Some nanomaterials exhibit both oxidase and peroxidase-like activity.31 Oxidase-like activity of chitosan–AuNPs was also examined. As shown in Fig. 2a, system of AuNPs + TMB exhibited light blue color with a low absorbance at 652 nm, indicating the oxidase activity of chitosan–AuNPs is not obvious.
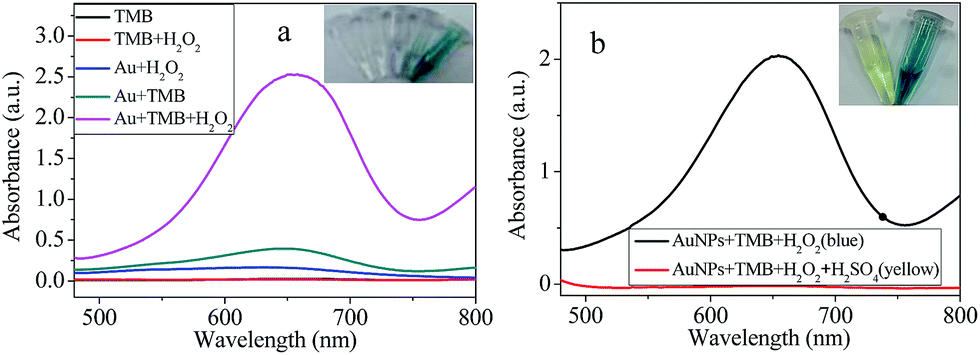 | ||
| Fig. 2 (a) UV-vis absorbance spectra of TMB, TMB + H2O2, AuNPs + H2O2, AuNPs + TMB, AuNPs + TMB + H2O2. (b) UV-vis spectra and colorimetric of AuNPs + TMB + H2O2 in the absence and presence of H2SO4. Inset: the photographs corresponding to the spectra. Experimental conditions: 300 μL AuNPs; 100 μL of 1 M H2O2; 300 μL of 12 mM TMB; 330 μL acetate buffer; 100 μL of 1 M H2SO4. | ||
In order to obtain the best catalytic effect, the influence of reaction time (during AuNPs preparation) on the peroxidase-like activity was investigated. An intermediate reaction solution (5 minutes interval) was extracted, and examined the catalytic capability. Corresponding UV-vis spectra are shown in Fig. S1.† It can be seen that 5 minutes after the reaction, a peak at 652 nm appeared, but very low. With the increase of reaction time, the peak increased correspondingly. However, the absorbance intensity decreases after 25 min. Absorbance at 652 nm indicates the degree of reaction from TMB to oxTMB, and its intensity reflects the catalytic ability. Thus, nanoparticles at 25 min show the best catalytic ability and we selected 25 min to be the best reaction time of AuNPs. The catalytic ability decreases when the reaction time is longer than 25 min. It is speculated that with time increase, AuNPs start to assemble together under high temperature and aggregation reduces the catalytic ability. This speculation can be verified from the color change of solution. When the reaction time increases from 25 min to 30 min, the color of solution changed from red to purple.
The peroxidase-like activity of AuNPs was also investigated by changing the AuNPs concentration. Results in Fig. 3 showed that color of the solution became deeper and deeper with increase AuNPs concentration. Accordingly, the absorption values at 652 nm increased with increase concentration of the AuNPs in the range of 0–0.5 nM. The relative absorption intensities at 652 nm ΔA (ΔA = A − A0, where A and A0 are absorption intensities in the presence and absence of AuNPs, respectively.) is linearly proportional to the concentration of AuNPs (Fig. 3c). The limit of detection for the AuNPs was 10 pM and the slope of the plot line is 6.54. In comparison, the LOD and slope of HRP are 35 pM and 4.91 (Fig. S2†). Slope represents change of relative absorption versus per nM enzyme or artificial enzyme. Bigger slope value indicates higher catalytic activity. This result revealed the high peroxidase-like activity of the chitosan–AuNPs. Clearly, AuNPs with high activity will have more use.
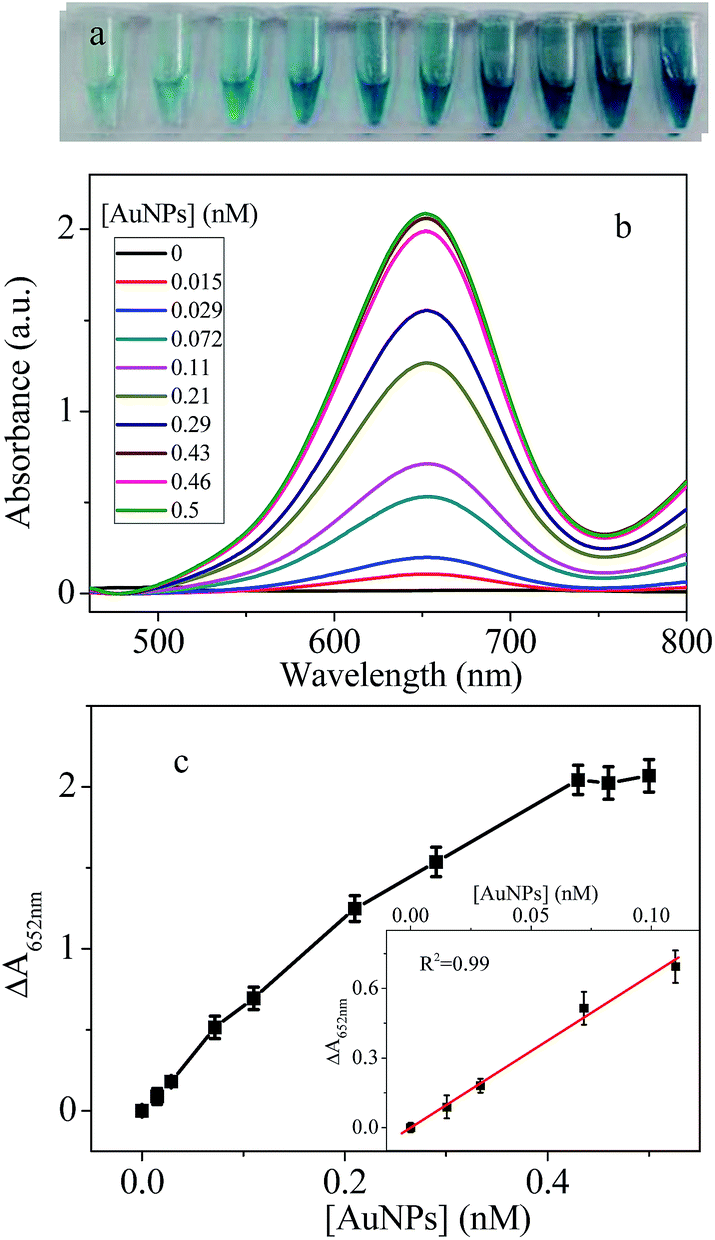 | ||
| Fig. 3 Effect of the concentration of AuNPs on the (a) colorimetric (b) absorbance spectra and (c) ΔA vs. concentration of AuNPs. Inset is the linear relationship in the low concentration. The error bars represent the standard deviation of three independent measurements. | ||
3.2 Optimization of the experiment conditions
Reaction of TMB + H2O2 is sensitive to the experiment conditions. Thus, influence of pH and temperature were investigated to find the optimal experiment parameters. Firstly, a series of acetate buffer with different pH values from 3.6 to 5.4 were prepared to explore the effect of pH on peroxidase-like activity of AuNPs. Results in Fig. S3† indicate that peroxidase activity of AuNPs is sensitive to pH and the best result was obtained under pH of 4.2 and 4.4. Therefore, unless stated specially, pH of 4.2 is used in the following experiment.As we all know, enzyme activity is usually temperature-dependent. Chitosan–AuNPs, as a kind of artificial enzyme, its activity must be related to temperature. Therefore, the effect of temperature (10–90 °C) on AuNP's activity was investigated as well. The results in Fig. S4† indicated that the absorption at 652 nm increased with the increase of temperature in the range from 10 to 50 °C, and then decreased in the range from 50 to 90 °C. AuNPs exhibited the highest peroxidase activity when the temperature is 50 °C. Therefore, 50 °C is chosen in the following experiment. This temperature is higher than bare AuNPs and cysteamine–AuNPs.7,8 The possible reason is that the external polymer chitosan can resist higher temperature compared to small molecules. Worth mentioning, the AuNPs still show peroxidase activity even the temperature is raised up to 90 °C. This is better than natural enzyme of HRP, which would lose its activity once the temperature rises over 50 °C.1
3.3 Detection of H2O2
Considering the peroxidase-like activity of chitosan–AuNPs, we propose it can be used for detection of H2O2. Thus, different concentration of H2O2 was added to AuNPs + TMB + H2O2 system. As shown in Fig. 4, in the absence of H2O2, the UV-vis absorbance peak at 652 nm was very low. When 0.001 mM H2O2 was added, the absorbance increased obviously. With increase concentration of H2O2, the absorption at 652 nm increases significantly until reached a plateau at 20 mM. The absorbance remained unchanged when the concentration was higher than 20 mM, which means the TMB has been oxidized completely. The relative absorption intensity ΔA is linearly proportional to the concentration of H2O2 with the LOD of 0.6 μM.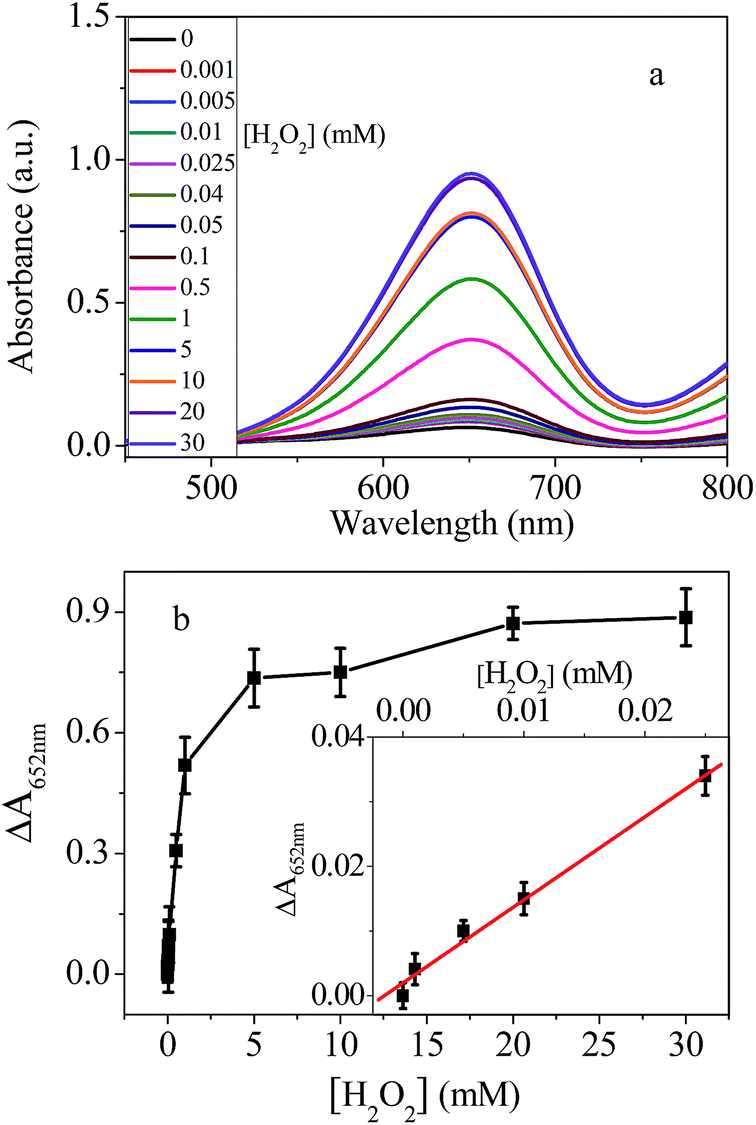 | ||
| Fig. 4 (a) Absorption spectra of the sensing platform with increasing the concentration of H2O2. (b) The linear relationship between the relative absorption intensities and the concentration of H2O2. Inset is the linear relationship in the low concentration. The error bars represent the standard deviation of three independent measurements. | ||
3.4 Detection of glucose with chitosan–AuNPs
In recent years, determination amount of glucose in buffer or real sample attracted significant interest for the fast growing number of diabetes. In principle, H2O2 generated from GOX oxidation of glucose can oxidize TMB in the presence of AuNPs as shown in Scheme 1. The color change of the chromogenic reaction can be used to indirectly measure the amount of glucose. Based on this principle, a platform for glucose content detection was designed based on peroxidase-like activity of chitosan–AuNPs. Under optimized conditions, the analytical performance of this platform for glucose detection was evaluated.The color of the solution turned blue gradually with the increased glucose (data not shown). Meanwhile, the variation of the absorbance at 652 nm with different concentrations of glucose was shown in Fig. 5a. As the concentration of the glucose increased, the absorbance signal increased correspondingly. The plot of the relative absorbance intensity versus the glucose concentration was presented in Fig. 5b. Generally, ΔA linearly correlated to glucose concentration. However, the slope is different before and after addition of 0.05 mM glucose. When the concentration of glucose is lower than 0.05 mM, the slope is bigger, indicating higher sensitivity. At low concentrations, the absorbance was still linearly proportional to the concentration of glucose, as shown in Fig. 5c. The limit of detection for glucose, calculated as three times background absorbance divided by the slope, were estimated to be 3 μM (R2 = 0.98). Experiments results based on peroxidase-like systems or other polysaccharide to-AuNPs detect H2O2 and glucose in recent years are summarized in Table 1. It can be seen clearly, our method showed better or comparable detection limits compared to others. However, the simple sample preparation makes this work more attractive.
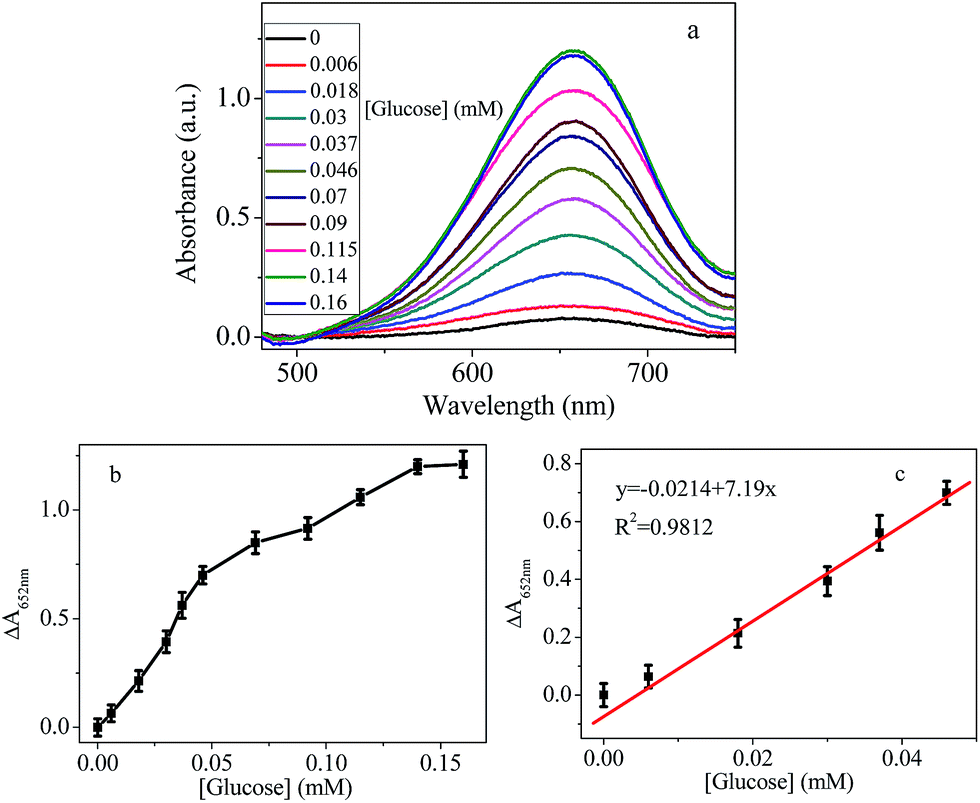 | ||
| Fig. 5 (a) Absorption spectra of the sensing platform with increasing the concentration of glucose. (b) The linear relationship between the relative absorption intensities and the concentration of glucose. Experimental conditions: 300 μL AuNPs; 100 μL of 1 M H2O2; 300 μL of 12 mM TMB; 330 μL acetate buffer. (c) Linear relationship in the low concentration. The error bars represent the standard deviation of three independent measurements. | ||
| Materials | Analyte | LOD (μM) | Linear range (mM) | Ref. |
|---|---|---|---|---|
| a This reference used electrochemical sensor. CS: chitosan; CNT: carbon nanotube. | ||||
| Porphyrin–ZnS | H2O2 | 15.8 | 0.01–0.06 | 32 |
| Glucose | 36 | 0.05–0.5 | ||
| Au@Ag NRs | H2O2 | 6 | 0.01–10 | 13 |
| Glucose | 39 | 0.05–20 | ||
| Fe3O4@C | Glucose | 2 | 0.006–0.1 | 33 |
| N-GQDs | H2O2 | 5.3 | 0.02–1.17 | 21 |
| Glucose | 16 | 0.025–0.375 | ||
| Co3O4@CeO2 | Glucose | 1.9 | 0.001–0.075 | 34 |
| Humic acid–Cu | Glucose | 0.68 | 0.001–0.1 | 35 |
| Fe3O4–Au–CSa | Glucose | 1.2 | 0.003–0.57 | 36 |
| CNT–CS–Aua | Glucose | 3 | 0.006–5 | 37 |
| Chitosan–Au | H2O2 | 0.6 | 0.001–5 | Present work |
| Glucose | 3 | 0.006–0.14 | ||
Specificity is a very important parameter to evaluate the feasibility of an analytical assay. So a highly selective response to glucose over other potentially interference is necessary. Fructose, lactose and maltose were added respectively to test the specificity recognition towards glucose. Results were presented in Fig. 6. It can be seen that the absorbance signals of fructose, lactose and maltose were much lower than that of the glucose. This high selectivity could be due to the specificity of glucose with GOX. The results indicate that the assay has good selectivity. Taken together, this designed platform is feasible to provide a detection method for glucose.
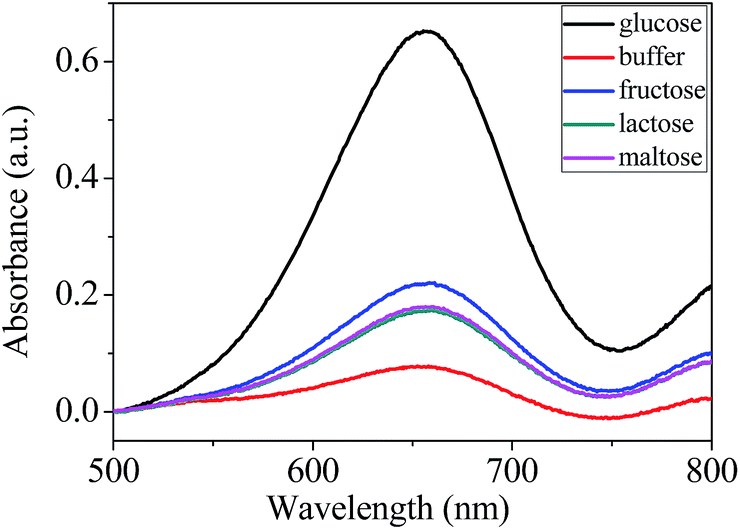 | ||
| Fig. 6 UV-vis absorbance spectra of the sensing system in the presence of 0.15 mM glucose, pure buffer, fructose, lactose and maltose. | ||
3.5 Analytical performance in serum
It is very important but challenging to detect glucose in the blood serum as glucose exists in blood, which is a more complicated media than the buffer solution. Many sensing platforms for glucose detection were conducted in diluted serum media, such as colorimetric,28,38 fluorescence39 and upconversion luminescence.40 Our scheme based on peroxidase-like activity of chitosan–AuNPs was tested in the presence of fetal bovine serum with different volume ratios. The results in 10%, 40%, 60% serum are shown in Fig. S5† and summarized in Table 2. The relative absorption intensities in the complex media were found to steadily increase with increasing concentration of glucose (Fig. S5†). However, the value of ΔA strongly depends on the volume ratio of serum and decreases when more serum was added. The maximum ΔA decreases from 1.21 (0% serum) to 0.28 in 60% serum as shown in Table 2. Results show that the ΔA is linearly proportional to the concentration of glucose. The LOD of this method was estimated to be 12 μM in 60% serum. This revealed that the assay was practicable for detection of glucose in serum.| Serum ratio | ΔAmax | LOD (μM) |
|---|---|---|
| 0 | 1.21 | 3 |
| 10% | 1.15 | 7 |
| 40% | 0.7 | 9 |
| 60% | 0.28 | 12 |
4. Conclusions
Chitosan–AuNPs were found to exhibit intrinsic peroxidase-like activity by catalyzing the oxidation of TMB to a blue-colored product. The catalytic ability of prepared AuNPs was higher than natural enzyme of HRP. The optimal experiment condition is at pH 4.2 and 50 °C. Importantly, the peroxidase-like activity of AuNPs is effective during broad temperature between 10–90 °C, which offers the AuNPs wide range application. The peroxidase-like activity of AuNPs was used to design sensing platform for H2O2 and glucose, with LOD of 0.6 μM and 3 μM, respectively. This method can perfectly distinguish glucose from fructose, lactose and maltose, indicating the feasibility of the assay. Furthermore, the assay was employed to detect glucose in 60% serum with LOD of 12 μM. In summary, chitosan–AuNPs is more suitable for bioanalysis compared with other peroxidase-like Au nanomaterials, because it is very stable and cytocompatible in water solution. The detection method for glucose has the advantages of easy preparation, low cost and simple.Conflicts of interest
There are no conflicts of interest to declare.Acknowledgements
This work was supported by the National Natural Science Foundation of China (Grant No. 21605128), Natural Science Foundation of Jiangsu Province (No. BK20150427, BK20160440), the Initial Scientific Research Foundation of Yancheng Institute of Technology (No. xj201530). Jiangsu Provincial Department of science and technology prospective joint research project (No. BY2015057-09). The authors also acknowledge the “Jiangsu Province Shuangchuang Plan (2015)” for the financial support.References
- L. Gao, J. Zhuang, L. Nie, J. Zhang, Y. Zhang, N. Gu, T. Wang, J. Feng, D. Yang, S. Perrett and X. Yan, Nat. Nanotechnol., 2007, 2, 577–583 CrossRef CAS PubMed.
- M. Nasir, M. H. Nawaz, U. Latif, M. Yaqub, A. Hayat and A. Rahim, Microchim. Acta, 2016, 184, 323–342 CrossRef.
- H. Wei and E. Wang, Chem. Soc. Rev., 2013, 42, 6060–6093 RSC.
- L.-L. Wu, L.-Y. Wang, Z.-J. Xie, F. Xue and C.-F. Peng, RSC Adv., 2016, 6, 75384–75389 RSC.
- L. Shen, C. Chu, C. Ma, H. Yang, S. Ge, J. Yu, M. Yan and X. Song, Sens. Actuators, B, 2014, 201, 196–203 CrossRef CAS.
- Y. Tao, Y. Lin, J. Ren and X. Qu, Biosens. Bioelectron., 2013, 42, 41–46 CrossRef CAS PubMed.
- P. Ni, H. Dai, Y. Wang, Y. Sun, Y. Shi, J. Hu and Z. Li, Biosens. Bioelectron., 2014, 60, 286–291 CrossRef CAS PubMed.
- D. Zhao, C. Chen, L. Lu, F. Yang and X. Yang, Sens. Actuators, B, 2015, 215, 437–444 CrossRef CAS.
- Y. Chang, Z. Zhang, J. Hao, W. Yang and J. Tang, Sens. Actuators, B, 2016, 232, 692–697 CrossRef CAS.
- J. Liu, X. Hu, S. Hou, T. Wen, W. Liu, X. Zhu, J. J. Yin and X. Wu, Sens. Actuators, B, 2012, 166–167, 708–714 CrossRef CAS.
- S. Zhang, H. Li, Z. Wang, J. Liu, H. Zhang, B. Wang and Z. Yang, Nanoscale, 2015, 7, 8495–8502 RSC.
- C. Chen, N. Li, J. Lan, X. Ji and Z. He, Anal. Chim. Acta, 2016, 902, 154–159 CrossRef CAS PubMed.
- L. Han, C. Li, T. Zhang, Q. Lang and A. Liu, ACS Appl. Mater. Interfaces, 2015, 7, 14463–14470 CAS.
- F. Kang, X. Hou and K. Xu, Nanotechnology, 2015, 26, 405707 CrossRef PubMed.
- A. Boujakhrout, P. Diez, P. Martinez-Ruiz, A. Sanchez, C. Parrado, E. Povedano, P. Soto, J. M. Pingarron and R. Villalonga, RSC Adv., 2016, 6, 74957–74960 RSC.
- Y. Zhao, H. Qiang and Z. Chen, Microchim. Acta, 2016, 184, 107–115 CrossRef.
- C. Zheng, W. J. Ke, T. X. Yin and X. Q. An, RSC Adv., 2016, 6, 35280–35286 RSC.
- Q. Chen, Y. Fu, W. Zhang, S. Ye, H. Zhang, F. Xie, L. Gong, Z. Wei, H. Jin and J. Chen, Talanta, 2017, 165, 516–521 CrossRef CAS PubMed.
- S. K. Vaishanav, J. Korram, R. Nagwanshi, K. K. Ghosh and M. L. Satnami, Sens. Actuators, B, 2017, 245, 196–204 CrossRef CAS.
- T. Wen, F. Qu, N. B. Li and H. Q. Luo, Anal. Chim. Acta, 2012, 749, 56–62 CrossRef CAS PubMed.
- L. Lin, X. Song, Y. Chen, M. Rong, T. Zhao, Y. Wang, Y. Jiang and X. Chen, Anal. Chim. Acta, 2015, 869, 89–95 CrossRef CAS PubMed.
- X. Zhang, M. Wei, B. Lv, Y. Liu, X. Liu and W. Wei, RSC Adv., 2016, 6, 35001–35007 RSC.
- X. Miao, L. Ling and X. Shuai, Biosens. Bioelectron., 2013, 41, 880–883 CrossRef CAS PubMed.
- J. Xu, X. Cao, J. Xia, S. Gong, Z. Wang and L. Lu, Anal. Chim. Acta, 2016, 934, 44–51 CrossRef CAS PubMed.
- M. S. Steiner, A. Duerkop and O. S. Wolfbeis, Chem. Soc. Rev., 2011, 40, 4805–4839 RSC.
- L. Hu, Y. Yuan, L. Zhang, J. Zhao, S. Majeed and G. Xu, Anal. Chim. Acta, 2013, 762, 83–86 CrossRef CAS PubMed.
- X. Jiang, C. Sun, Y. Guo, G. Nie and L. Xu, Biosens. Bioelectron., 2015, 64, 165–170 CrossRef CAS PubMed.
- L. Jin, Z. Meng, Y. Zhang, S. Cai, Z. Zhang, C. Li, L. Shang and Y. Shen, ACS Appl. Mater. Interfaces, 2017, 9, 10027–10033 CAS.
- L. Wu, C. Shi, L. Tian and J. Zhu, J. Phys. Chem. C, 2007, 112, 319–323 Search PubMed.
- G. K. Darbha, A. K. Singh, U. S. Rai, E. Yu, H. T. Yu and P. C. Ray, J. Am. Chem. Soc., 2008, 130, 8038–8043 CrossRef CAS PubMed.
- J. G. You, Y. W. Liu, C. Y. Lu, W. L. Tseng and C. J. Yu, Biosens. Bioelectron., 2017, 92, 442–448 CrossRef CAS PubMed.
- Q. Liu, P. Chen, Z. Xu, M. Chen, Y. Ding, K. Yue and J. Xu, Sens. Actuators, B, 2017, 251, 339–348 CrossRef CAS.
- Q. Li, G. Tang, X. Xiong, Y. Cao, L. Chen, F. Xu and H. Tan, Sens. Actuators, B, 2015, 215, 86–92 CrossRef CAS.
- D. Jampaiah, T. S. Reddy, V. E. Coyle, A. Nafady and S. K. Bhargava, J. Mater. Chem. B, 2017, 5, 720–730 RSC.
- B. L. N. Wang, F. Qiao, J. Sun, H. Fan and A. Shiyun, J. Mater. Chem. B, 2015, 3, 7718–7723 RSC.
- J. Li, R. Yuan and Y. Chai, Microchim. Acta, 2011, 173, 369–374 CrossRef CAS.
- Y. Wang, W. Wei, X. Liu and X. Zeng, Mater. Sci. Eng., C, 2009, 29, 50–54 CrossRef CAS.
- Y. Xia, J. Ye, K. Tan, J. Wang and G. Yang, Anal. Chem., 2013, 85, 6241–6247 CrossRef CAS PubMed.
- C. Zong, M. Wang, B. Li, X. Liu, W. Zhao, Q. Zhang, A. Liang and Y. Yu, RSC Adv., 2017, 7, 26559–26565 RSC.
- H. Chen, A. Fang, L. He, Y. Zhang and S. Yao, Talanta, 2017, 164, 580–587 CrossRef CAS PubMed.
Footnote |
| † Electronic supplementary information (ESI) available. See DOI: 10.1039/c7ra08967h |
| This journal is © The Royal Society of Chemistry 2017 |