 Open Access Article
Creative Commons Attribution 3.0 Unported Licence
Low-voltage-driven and highly-diffractive holographic polymer dispersed liquid crystals with spherical morphology†
Haiyan Penga,
Lei Yua,
Guannan Chena,
Trent William Bohla,
Yunsheng Ye a,
Xingping Zhou*ab,
Zhigang Xue
 a,
V. A. L. Royc and
Xiaolin Xie
 *ad
*ad
aKey Laboratory for Material Chemistry of Energy Conversion and Storage, Ministry of Education, School of Chemistry and Chemical Engineering, Huazhong University of Science and Technology, Wuhan 430074, China. E-mail: xpzhou@mail.hust.edu.cn; xlxie@mail.hust.edu.cn
bHubei Key Laboratory of Material Chemistry and Service Failure, School of Chemistry and Chemical Engineering, Huazhong University of Science and Technology, Wuhan 430074, China
cDepartment of Physics and Materials Science, City University of Hong Kong, Tat Chee Avenue, Kowloon Tong, Hong Kong SAR, China
dNational Anticounterfeit Engineering Research Center, Wuhan 430074, China
First published on 7th November 2017
Abstract
It is a constant pursuit to form highly-diffractive and low-voltage-driven holographic polymer dispersed liquid crystals (HPDLCs) for meeting the requirements of practical applications. Nevertheless, the high-voltage-driven characteristic is usually given while improving the diffraction efficiency of HPDLCs, and it remains a challenge to form HPDLCs with concurrent features of high diffraction and low driving voltage via a simple method. In this work, we synthesize a non-room-temperature LC, 4-butyloxy-4′-cyanobiphenyl (4OCB), and mix it with a room-temperature nematic LC mixture named P0616A. These new LC mixtures are then homogeneously mixed with monomers and a photoinitibitor composed of 3,3′-carbonylbis(7-diethylaminocoumarin) (KCD) and N-phenylglycine (NPG), followed by patterning via laser interference, generating well-structured HPDLCs. The introduction of 4OCB into the standard formulation is found to be able to optimize the morphology and electro-optical properties of the resulting HPDLC transmission gratings. By doping 5 wt% of 4OCB into the HPDLCs, a high diffraction efficiency of 92 ± 3% is obtained; meanwhile, the threshold and saturated voltages significantly decrease by 80.8% (i.e., from 12.0 ± 0.8 to 2.3 ± 0.9 V μm−1) and 73.2% (i.e., from 19.0 ± 0.6 to 5.1 ± 0.7 V μm−1), respectively, in comparison with the pristine. The enhanced performance is believed to be ascribed to the formed larger LC droplets (70 ± 20 nm) and lower interface anchoring strength (0.7 μN m−1) of the polymer network on LCs.
1. Introduction
Holographic polymer dispersed liquid crystals (HPDLCs), in the form of sub-micron alternating planes of an LC-rich phase and a solid polymer-rich phase,1–3 have the easy-processing capabilities of polymers, unique electro-optical properties of LCs and controllable optical diffraction.4 Thus, HPDLCs show great application prospects in widespread advanced technique fields, such as switchable photonic crystals,5,6 3D displays,7 distributed feedback lasers,8–11 colored 3D image storage,12–14 and radiation-hardened memory for space communication.15 Nevertheless, HPDLCs usually suffer from relatively low diffraction efficiency or high switching voltage,13,14,16 which hinders their practical applications.To optimize the diffraction efficiency and driving voltage of HPDLCs, it is necessary to comprehend the formation mechanism of HPDLC gratings in theory. When two coherent laser beams irradiate the homogeneous mixture consisting of reactive monomers, non-reactive LCs, photosensitizer and co-initiator, the photosensitizer absorbs photons and then transforms to its excited states, which subsequently reacts with the co-initiator through photoinduced electron transfer and proton transfer. This photo-triggered reaction generates radicals to preferentially initiate reactive monomers to polymerize in the bright (interference strengthening) regions. The consumption of monomers in the high light intensity regions results in diffusion of reactive monomers from the low light intensity regions to the high light intensity regions, thereby causing a periodically spatial modulation of the polymerization kinetics. As the miscibility gap between LCs and growing polymer host increases, the radical-inert LC molecules are squeezed into the low light intensity regions in order to balance the chemical potential. Eventually, the dark (interference weakening) regions become enriched with LC molecules while the bright regions are filled with polymer, in the form of spatially alternating layers of polymer-rich and LCs-rich phases. Only the diffusion of LCs is faster than their nucleation and the nucleation is faster than the polymerization gelation, can a well-defined grating be formed, affording high diffraction efficiency. Through careful selection of LC concentration,17,18 monomer type and average functionality,16,18–25 sensitizer and co-initiator,13,14,20,26 or judicious optimization of the processing conditions such as recording temperature, light intensity and exposure time,17 the micromorphology of HPDLCs can be well controlled to offer high diffraction efficiency. Nevertheless, the electro-optical properties of HPDLCs are also closely dependent on their micromorphology, and HPDLC gratings with high diffraction efficiency usually need a high driving voltage to switch.12,13,16,23 Therefore, it remains a great challenge to chase low driving voltage while maintaining a high diffraction efficiency of HPDLCs.
To overcome this bottleneck, two typical methods have been employed so far. The first method is to decrease the interface anchoring energy between the polymer host and LC by reducing the interfacial tension with the introduction of surfactants or low surface energy polymers containing fluorine.27–32 For instance, Xu et al. investigated the effect of surfactants on the electro-optical properties of HPDLCs by adding a small portion of three different kinds of surfactants, namely, octanoic acid, sorbitan monooleate, and Tergital Min-Foam 1X.32 Although the threshold electric field was reduced from 13.0 V μm−1 to about 2.3 V μm−1 by adding 8 wt% of sorbitan monooleate, the diffraction efficiency was not higher than 70%. Bunning's group discovered that, to some extent, adding octanoic acid reduced the switching voltages of HPDLCs.31 However, octanoic acid contaminated the LC droplets, which reduced the clearing temperature and potentially gave rise to long-term performance degradation issues.31 Woo and Kim confirmed that the switching voltages of HPDLCs could be significantly decreased by incorporating the partially fluorinated acrylate monomers because of the decrease in the interface anchoring strength.27 However, fluoride monomers are usually expensive and hard to synthesize. The second method to lower down driving voltage is to incorporate inorganic nanoparticles with relatively large low-frequency electrical conductivity, such as silica,33,34 gold or silver,35,36 carbon nanotubes,37,38 graphene or graphene oxide,39,40 and ZnS16 into the polymer-rich regions of HPDLC gratings. Fontecchio's group experimentally proved a reduction in switching voltage of HPDLCs by doping a low concentration of oxidized multi-walled carbon nanotubes, due to the fact that the MWNTs got trapped in the polymer matrix to improve the matrix conductivity.38 Braun and co-workers incorporated acrylate-functionalized silica nanoparticles into HPDLC gratings and demonstrated that the functionalized silica nanoparticles were predominantly sequestered in the polymer-rich regions, which afforded lower driving voltage and a relatively high diffraction efficiency.34 Recently, our group revealed that the threshold driving voltage of HPDLCs could be decreased from 11.6 to 2.5 V μm−1 and diffraction efficiency was increased to 94 ± 2% when doping 8 wt% of ZnS semiconductor nanoparticles into the polymer-rich regions.16 The drawback of nanoparticle doping is that complicated synthesis and surface functionalization are usually involved. Despite of the extensive research and amazing progress, it remains a big challenge to chase the low driving voltage while maintaining a high diffraction efficiency of HPDLCs via a simple way.
Herein, a novel approach is proposed which relies on simple LC mixing. LC mixing is a long-standing method to achieve desired LC properties for meeting the requirement of display. We hypothesize that this simple approach is able to offer a fine tune in the micromorphology of HPDLCs which is envisioned to consequently offer enhanced device performance. We first synthesized the LC 4OCB easily from low cost raw materials via a one-step process, and then mixed it with a commercially available nematic LC mixture named P0616A. These new LCs were then homogeneously mixed with monomers and the photoinitibitor composed of KCD and NPG. HPDLCs were finally generated by exposing the mixtures to laser interference patterns. The LCs 4OCB and P0616A jointly form the LCs-rich regions during the formation of HPDLCs due to their better compatibility compared with the poor compatibility with polymer. The LC 4OCB can not only control the micromorphology as manifested by the significant increased average diameter of LC droplets, but it can also decrease the interface anchoring energy of the polymer on LCs. HPDLC transmission gratings with a high diffraction efficiency of 92.0 ± 2.8%, a low threshold driving voltage of 2.3 V μm−1, and a low saturated voltage of 5.1 V μm−1 were achieved by doping 5 wt% of 4OCB into the HPDLCs. The new findings here are believed to advance the understanding of the structure–property relation of HPDLCs, and the proposed protocol here promises practical application of HPDLCs with concurrent high diffraction efficiency and low driving voltage.
2. Materials and methods
2.1. Materials
4′-Hydroxy-4-biphenylcarbonitrile (purity 99%), 1-butyl bromide (purity 99%), and sodium hydroxide (NaOH, AR) were purchased from Sinopharm Chemical Reagent Co., Ltd., China. N,N-Dimethylacrylamide (DMAA, purity 98%) was purchased from J&K Scientific. Hyperbranched acrylate monomer 6361-100 was donated by Eternal Chemical Co., Ltd., China. 3,3′-Carbonylbis(7-diethylaminocoumarin) (KCD) and N-phenylglycine (NPG) were received from Aldrich and Aladdin, respectively. The nematic LC mixture named P0616A (Table 1) was obtained from Shijiazhuang Chengzhi Yonghua Display Material Co., Ltd., China.2.2. Synthesis of LC 4-butyloxy-4′-cyanobiphenyl (4OCB)
The LC 4OCB was synthesized as follows according to the reported procedure:41 1.95 g (10 mmol) of 4′-hydroxy-4-biphenylcarbonitrile and 0.4 g (10 mmol) of NaOH were placed in a three neck round bottom flask fitted with a condenser. Nitrogen gas was passed through the apparatus. 30 mL of anhydrous butanone was then added via a cannula, followed by vigorous stirring for 20 min at 60 °C using a magnetic stirring bar. Next, 10 mL (9 mmol) of 1-butyl bromide in butanone was dropwise added and the mixture was kept refluxing for 19 h under the protection of nitrogen gas. The resulting solution was filtered and 100 mL of NaOH water solution (0.4 mol L−1) was added to the filtrate. The organic product in the filtrate was extracted using dichloromethane for three times, and then concentrated using rotary evaporation under reduced pressure. The resulting solid was purified by recrystallization from ethanol. The final product (white crystals, yield: 70%) was characterized by nuclear magnetic resonance spectroscopy (NMR, Bruker, AV400) and high resolution mass spectrometry (HRMS, Bruker SolariX 7.0T FTMS).2.3. Phase transition characterization of 4OCB and 4OCB/P0616A mixtures
The phase transition behaviors of 4OCB and 4OCB/P0616A mixtures were determined using differential scanning calorimetry (DSC, TA Q2000) and cross polarized optical microscopy (POM, Axio Scope. A1, Carl Zeiss).The LC mixtures composed of 4OCB and P0616A were prepared in selected proportions of 0/33, 2/31, 5/28, 8/25 and 11/22, respectively. To obtain homogeneous LC mixtures, the LCs were heated to the isotropic phase and annealed for a period of 30 min.
2.4. Preparation of holographic mixtures
The holographic mixtures used in this study consisted of the mono-functional monomer DMAA, hyperbranched acrylate monomer 6361-100, a photoinitibitor composed of KCD and NPG, as well as LC P0616A and 4OCB. The weight fraction of each component is shown in Table 2. The total weight percentage of 4OCB and P0616A was kept unchanged in the monomer/LCs mixtures (33 wt% in total). Thus, the LC 4OCB concentration in the monomer/LCs mixtures was calculated to increase from zero to 11 wt%. The monomers and LCs were then added into brown glass bottles and ultrasonicated at 30 °C for 10 min to obtain homogeneous mixtures. Finally, KCD and NPG were introduced to the mixtures, followed by another 10 min of ultrasonication.| Entry | 4OCB | P0616A | DMAA | 6361-100 |
|---|---|---|---|---|
| a The KCD and NPG concentrations were set as 0.6 and 1.3 wt% of the total mass of monomers and LCs, respectively. | ||||
| 1 | 0.0 | 33.0 | 44.7 | 22.3 |
| 2 | 2.0 | 31.0 | 44.7 | 22.3 |
| 3 | 5.0 | 28.0 | 44.7 | 22.3 |
| 4 | 8.0 | 25.0 | 44.7 | 22.3 |
| 5 | 11.0 | 22.0 | 44.7 | 22.3 |
2.5. Viscosity of holographic mixtures
The viscosities of holographic mixtures were characterized at 25 °C using a rheometer (MCR 302, Anton-Paar) with two parallel plates in a diameter of 25 mm. A shear rate of 0–100 s−1 was employed, and the gap between the two plates was set as 0.2 mm.2.6. Photopolymerization kinetics
Photopolymerization kinetics was investigated using a Q2000 photo-differential scanning calorimeter (P-DSC, TA Instruments). About 7 mg of the sample was added in an aluminum liquid pan that was then placed onto the sample holder while another vacuum aluminum pan was placed onto the reference holder. The sample was purged by 50 mL min−1 of nitrogen gas during the test. After being kept isothermal at 30 °C for 5 min, the aluminum pans were simultaneously irradiated by two separate monochromatic 442 nm beams from the top isothermally for another 20 min. The light intensity for each beam was fixed at 3.2 mW cm−2. The exothermal heat flow during photo-mediated reaction versus the irradiation time was recorded, which allowed for the calculation of photopolymerization rate and double-bond conversion using the previously reported method,23
 | (1) |
 | (2) |
![[double bond, length as m-dash]](https://www.rsc.org/images/entities/char_e001.gif) C double bond conversion up to time t. dH/dt and ΔH(t) are the exothermic heat flow and enthalpy change, respectively. m, xi, fi and Mi are the total mass of holographic mixtures, individual weight fraction, functionality and molecular weight of the monomer i, separately. ΔH0 represents the standard reaction enthalpy of C
C double bond conversion up to time t. dH/dt and ΔH(t) are the exothermic heat flow and enthalpy change, respectively. m, xi, fi and Mi are the total mass of holographic mixtures, individual weight fraction, functionality and molecular weight of the monomer i, separately. ΔH0 represents the standard reaction enthalpy of C![[double bond, length as m-dash]](https://www.rsc.org/images/entities/char_e001.gif) C double bond that equals 86 kJ mol−1 for acrylate and 83 kJ mol−1 for acrylamide.
C double bond that equals 86 kJ mol−1 for acrylate and 83 kJ mol−1 for acrylamide.
2.7. Photorheology
The photorheological behavior of holographic mixtures under flood light exposures was investigated using a rheometer (MCR 302, Anton-Paar) that was equipped with two parallel plates with diameters of 25 mm, wherein the bottom plate was transparent polyester that allowed the light to penetrate through. To obtain rational experimental results, the gap between the two plates, angular frequency, strain, and temperature were set as 0.1 mm, 10 rad s−1, 15% and 25 °C, respectively. Under the protection of nitrogen gas with a purge flow of 50 mL min−1, the samples were isothermally exposed to 3.2 mW cm−2 of monochromatic 442 nm light for a proper duration after being sheered in dark for 1 min. Both the storage and loss moduli were recorded and their crossover was considered the gelation point.42,432.8. Holographic recording
To fabricate the transmission holographic gratings, the holographic mixtures were injected by capillary action into a LC cell with an 11 μm thick gap (confirmed by LCT-5016C liquid crystal display parameter tester from North LC Engineering Research and Development Centre, China). A 442 nm He–Cd laser beam was divided by a splitter into two separate beams with an equal intensity of 3.2 mW cm−2. Then, the two coherent beams were used to simultaneously irradiate the holographic mixtures sandwiched in the LC cell for 40 s (Scheme 1), followed by postcure for another 5 min using a UV lamp. The bisector of the external angle between the two coherent laser beams was normal to the planar surface of LC cell.2.9. Electro-optical performance
The diffraction efficiencies of the HPDLCs gratings were measured by the LCT-5016C display parameter tester. During the test, a p-polarized 633 nm laser with high collimation (Thorlabs, USA) was employed to non-destructively probe the holographic gratings at the Bragg angle. The diffraction efficiency was defined as the ratio of the first-order diffraction intensity to the total intensities of the diffraction and transmission beams. For implementing the electric switching, a square wave voltage up to 250 V with a frequency of 1 kHz was applied. Three to five independent samples were characterized and each result was given in the form of average value plus standard deviation.2.10. Morphology characterization
The HPDLCs inside glass cells were cut into small specimens and then soaked in n-hexane for 48 h to fully remove the 4OCB and P0616A from the gratings. After being dried in air and coated with a thin platinum layer on the top surface, the morphology was characterized under a field emission scanning electron microscope (Sirion 200 FESEM). Atomic force microscopy (AFM, Shimadzu SPM-9700) was used to investigate the surface topology of HPDLCs transmission gratings after LC removal. The images were acquired in the tapping mode with a resonant frequency of 300 kHz.3. Results and discussion
3.1. Characterization of the LC 4OCB
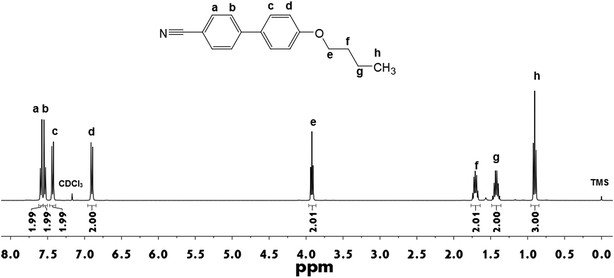
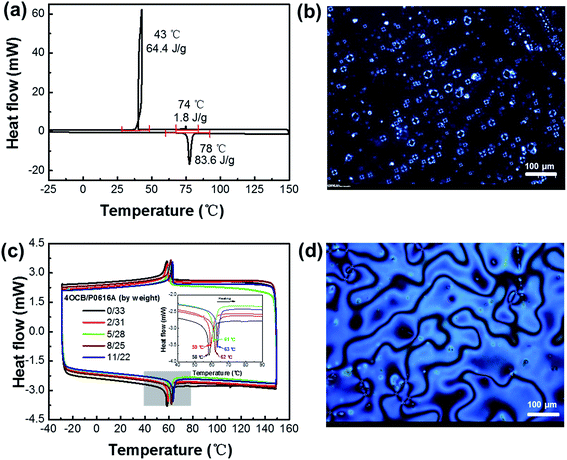
The successful synthesis of 4OCB is confirmed by NMR, HRMS and elemental analysis. As shown in Fig. 1, 1H-NMR spectral information of the LC 4OCB is given as follows, (400 MHz, CDCl3) δ [ppm]: 7.59 (2H, ortho to CN), 7.53 (2H, meta to CN), 7.43 (2H, meta to OCH2–), 6.90 (2 H, residual ortho to OCH2–), 3.92 (2H, PhOCH2CH2–), 1.71 (2H, PhOCH2CH2–), 1.43 (2H, –CH2CH3), 0.90 (3H, –CH2CH3). The 13C-NMR spectrum of 4OCB is displayed in Fig. S1 in the ESI,† and the spectral information is as follows, (400 MHz, CDCl3) δ [ppm]: 159.86, 145.26, 132.52, 131.20, 128.28, 127.03, 119.07, 115.10, 110.03, 67.80, 31.28, 19.26, 13.85. HRMS of 4OCB is shown in Fig. S2 in the ESI,† calculated for [C17H18NO]+ (MH+): m/z 252.1344; found: 252.1378. Elemental analysis (by weight): N 5.50%, C 80.43%, H 6.70%, O 7.37%.The phase behavior of 4OCB was investigated using DSC and POM. As displayed in Fig. 2a, a big melting peak at 78 °C is clear with an enthalpy value of 83.6 J g−1 during the second heating. When cooling down from 150 °C, a weak exothermic peak appears at 74 °C with an enthalpy value of 1.8 J g−1. This weak peak is ascribed to the isotropic–nematic transition,44 which is confirmed by the uniaxial Maltese cross texture in tetrapode nematic droplets under POM (Fig. 2b).45 When further cooling the sample, a relatively large exothermic peak (64.4 J g−1) appears at 43 °C corresponding to the crystallization of 4OCB. The nematic phase was observed only when cooling the isotropic melt, which indicates that the 4OCB is a monotropic nematic LC.46 The influence of the 4OCB on the phase transition temperature and texture of the LCs P0616A are illustrated in Fig. 2c and d, respectively. When varying the mass ratio between the LCs 4OCB and P0616A from 0/33 to 2/31, 5/28, 8/25 and 11/22, the nematic-isotropic transition temperature of the mixtures is 58, 59, 61, 62 and 63 °C, respectively (Fig. 2c), indicating that the nematic phase is easier to form when increasing the 4OCB in the LC mixtures. Adding 4OCB does not influence the schlieren texture with dark brushes of P0616A, as shown in Fig. 2d.
3.2. Photopolymerization kinetics and photorheology
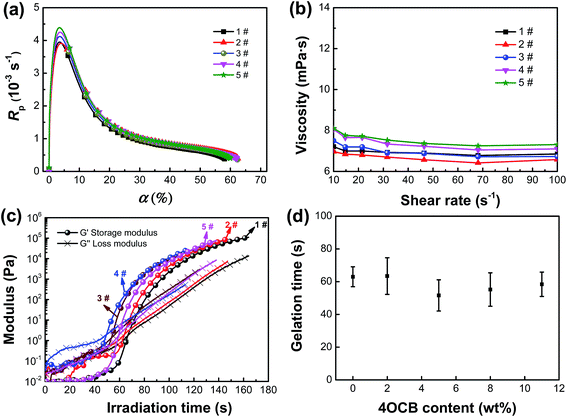
The photopolymerization rate as a function of double-bond conversion and the viscosity of the holographic mixtures with varied 4OCB content are displayed in Fig. 3a and b, respectively. The introduction of 4OCB shows a small influence on the photopolymerization kinetics and viscosity of holographic mixtures. With an augmentation of the 4OCB content from zero to 11 wt%, the maximum photopolymerization rate and viscosity increased by 12.8% (i.e., from 3.9 × 10⁻³ to 4.4 × 10⁻³ s−1) and 7.4% (i.e., from 6.8 to 7.3 mPa s−1), respectively. To be noted that, it is impractical to analyze the molecular weight of the generated polymer as it is a cross-linked network. However, the almost unchanged double-bond conversion when varying the 4OCB content implies that the molecular weight of the generated polymer shows insignificant influence on the HPDLC structure and performance. The photorheological behavior during photopolymerization is displayed in Fig. 3c. Before turning on the light, it can be seen that the initial loss modulus is greater than the storage modulus; however, both the loss modulus and storage modulus increase when the light irradiation duration is extended because the molecular weight increases during photopolymerization. When further increasing the irradiation time, the storage modulus increases faster than the loss modulus does, and the time corresponding to their crossover is considered to be the gelation time. When the 4OCB content is 0, 2, 5, 8 and 11 wt%, the gelation time during photopolymerization is found to be 63 ± 6, 63 ± 11, 51 ± 9, 55 ± 10 and 58 ± 7 s, respectively (Fig. 3d).3.3. Effect of LC 4OCB content on the micromorphology of HPDLCs gratings
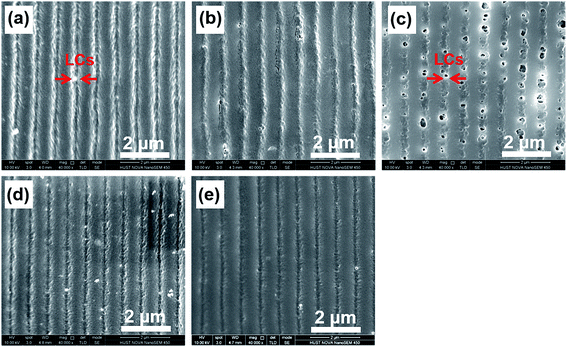
The performance of HPDLC gratings inherently depends on their micromorphologies. As illustrated in Fig. 4, dark channels or holes represent the original LCs before being removed and the others represent polymer regions. Uniform gratings with sharp edges were obtained except for the grating with 5 wt% of 4OCB where dark holes represent the original locations of LC droplets (Fig. 4c). The LCs-rich regions are composed of small, discrete, and nearly spherical LC droplets with an average size of 70 ± 20 nm, which are slightly larger than those found in the other gratings. The widths of LCs-rich regions with the incremental LC 4OCB content are approximately 0.34 ± 0.04, 0.31 ± 0.02, 0.36 ± 0.05, 0.27 ± 0.05 and 0.23 ± 0.02 μm, and they are separated by polymer-rich regions with widths of about 0.77 ± 0.08, 0.77 ± 0.07, 0.76 ± 0.02, 0.75 ± 0.04 and 0.78 ± 0.03 μm, respectively. We therefore know that the ratio of the LCs-rich region width to the grating period (44%, 40%, 47%, 36% and 29%, respectively) generally decreases with the incremental LC 4OCB, except for the grating with 5 wt% of 4OCB.Theoretically, the phase separation of HPDLC gratings strongly depends on the relative rates of monomer/LC diffusion, polymerization gelation and LC nucleation.47 Only if the diffusion of LCs is faster than their nucleation and the nucleation is faster than the polymerization gelation can a laminated grating structure be formed, as illustrated in Fig. 4a. Because the viscosity does not change significantly when loading 4OCB, the molecular diffusion difference can be negligible. With the increase of 4OCB concentration from zero to 11%, the nematic-isotropic phase transition temperature of the P0616A/4OCB mixtures gradually increases from 58 to 63 °C (Fig. 2c), indicating that the nucleation capability of the LC mixture increases, which is expected to offer shorter nucleation time during holographic photopolymerization. Considering the HPDLCs with 5 wt% of 4OCB, the gelation time has been noted to decrease from 63 ± 6 to 51 ± 9 s compared with the pristine. Under such condition, if the diffusion time of the LCs is smaller than the nucleation time, while the nucleation and polymerization gelation speed is approximately on the same order, discrete LC droplets are expected in the LCs-rich regions (Scheme 2, case A). With the further increase of the 4OCB content to 11 wt%, the nucleation time continues to decrease while the gelation time increases (e.g., from 51 ± 9 to 58 ± 7 s), the nucleation is envisioned to occur faster than the polymerization gelation, which in turn results in well-defined phase separation with alternating LC lamellae and polymer lamellae (Scheme 2, case B).
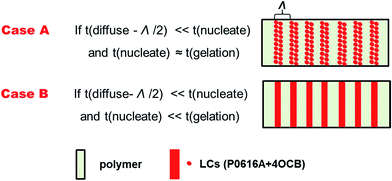 | ||
| Scheme 2 Schematic representation of the extreme morphologies of HPDLC gratings based on the competition of diffusion, nucleation and gelation. | ||
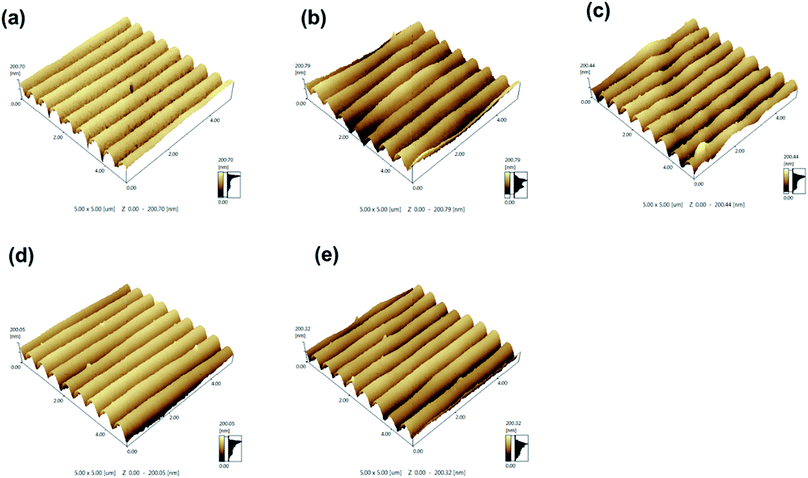
The morphologies were further investigated using AFM. Fig. 5 shows a three-dimensional view of the transmission gratings with different content of LC 4OCB. The surfaces of the five gratings show sinusoidal type profiles. The grating without 4OCB shows a smooth surface (Fig. 5a). As the LC content increases to 2 and 5 wt%, the AFM images present rough surfaces (Fig. 5b and c) that is consistent with the SEM results. Further increasing the 4OCB content to 8 and 11 wt% results in much smoother grating surfaces again (Fig. 5d and e). In addition, an interesting feature observed with AFM is that the depth of the gratings slightly decreases when doped with 5 wt% of 4OCB. The average depth of the grating with 5 wt% of 4OCB is found to be 94 ± 4 nm; this lower depth is ascribed to the disconnected LC droplets in the LCs-rich phase. The polymer walls in the LCs-rich phase prevent the penetration of the pyramidal AFM tip. Because of the limited resolution of the AFM tip, only rough surface rather than droplet-like structure can be detected.
3.4. Effect of LC 4OCB content on the diffraction efficiency and light scattering loss of HPDLCs gratings
The p-polarized diffraction efficiency of the HPDLC gratings with varied content of 4OCB are displayed in Fig. 6a. It can be seen that the diffraction efficiency of the pristine is up to 95 ± 2%. With an increase of 4OCB content to 2, 5, 8 and 11 wt%, the diffraction efficiency of HPDLC gratings does not change significantly, offering values of 94 ± 2%, 92 ± 3%, 93 ± 3% and 95 ± 2%, respectively. Nevertheless, the light scattering loss of HPDLC gratings increases slightly from 10.1 ± 1.4% to 13.6 ± 2.7% as the 4OCB content increases from zero to 5 wt% and then decreases back to around 9% when further increasing the 4OCB content.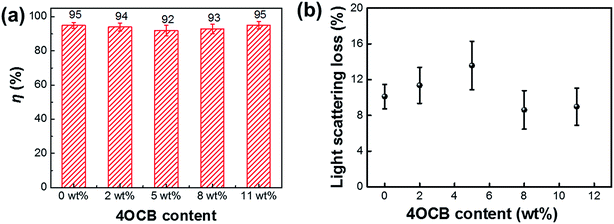 | ||
| Fig. 6 (a) p-Polarized diffraction efficiency, η, and (b) light scattering loss for the HPDLC gratings with varied content of 4OCB. | ||
In principle, a great mismatch of the refractive index between the polymer and LCs is a basic requirement for HPDLCs with high diffraction efficiency.17 The enhanced refractive index mismatch highly relies on the improved phase separation. Because the phase separation increases with the molecular weight of growing polymer, high conversion of monomers into polymer as well as a large solubility parameter gap between the polymer and LCs are of basic concern to obtain good phase separation.48 As shown in eqn (3), the diffraction efficiency in HPDLC gratings can be theoretically predicted by Kogelnik coupled-wave theory,23
 | (3) |
3.5. Effect of LC 4OCB content on the electro-optical behaviors of HPDLC gratings
To further understand the fundamental structure–property relation of HPDLCs, we analyzed the normalized diffraction efficiency versus applied voltage. A square wave voltage up to 250 V with a frequency of 1 kHz is optimized for the measurement. Fig. 7a shows the dependence of the normalized diffraction efficiency of HPDLC gratings on the applied voltage with varied content of 4OCB. The LC molecules with positive dielectric constants orient along the electric field direction when a voltage is applied across the grating, which results in a decrease of the refractive index mismatch and thus the diminished diffraction efficiency.49 The voltages at which the diffraction efficiency decreases to 90% and 10% of the initial value are considered as the threshold and saturated voltages, respectively.19,50,51 When the content of 4OCB increases from zero to 5 wt%, the threshold (Vth) and saturated (Vsat) voltages significantly decrease by 80.8% (i.e., from 12.0 ± 0.8 to 2.3 ± 0.9 V μm−1) and 73.2% (i.e., from 19.0 ± 0.6 to 5.1 ± 0.7 V μm−1), respectively. Nevertheless, with a further increase of the 4OCB content to 11 wt%, these values increase to 11.0 ± 0.3 and 16.0 ± 0.4 V μm−1, respectively. Meanwhile, the switching-off time increases from 84.7 ± 13.3 to 102.5 ± 13.8 ms when increasing the 4OCB content to 5 wt% and then deceases to 35.7 ± 11.0 ms when further increasing the 4OCB content to 11 wt% (Fig. 7b), primarily because of varied anchoring energy at the polymer/LC interface. Larger LC droplets usually suffer from smaller anchoring energy because of the decreased specific surface area, and thus give rise to longer switching-off time. Detailed data are summarized in Table 3.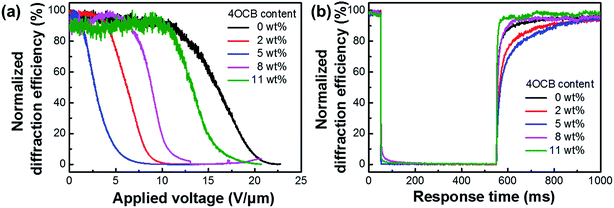 | ||
| Fig. 7 Normalized diffraction efficiency versus (a) applied voltage and (b) response time for the HPDLC gratings with varied content of 4OCB. | ||
| 4OCB (wt%) | 0 | 2 | 5 | 8 | 11 |
|---|---|---|---|---|---|
| WB (μN m−1) | 1.1 | 0.9 | 0.7 | 1.0 | 0.9 |
| Vth (V μm−1) | 12.0 ± 0.8 | 4.9 ± 0.7 | 2.3 ± 0.9 | 9.5 ± 1.1 | 11.0 ± 0.3 |
| τon (ms) | 2 | 2 | 2 | 5 | 3 |
| τoff (ms) | 84.7 ± 13.3 | 99.8 ± 9.2 | 102.5 ± 13.8 | 43.7 ± 9.3 | 35.7 ± 11.0 |
| CR | 18.0 | 26.0 | 23.0 | 22.0 | 13.0 |
The critical electric field for driving HPDLCs can be written as follows,23
 | (4) |
 | (5) |
In addition to the driving voltage and response time, contrast ratio (CR) is also an indispensable factor in evaluating the electro-optical properties of HPDLC gratings when they are applied as electro-optical devices. Eqn (6) can be used to calculate the CR (Table 3),53
 | (6) |
4. Conclusions
In summary, we have synthesized the non-room-temperature LC 4OCB and experimentally investigated the effects of 4OCB on the morphology and electro-optical properties of HPDLC transmission gratings. Due to the good compatibility between the 4OCB and P0616A, the 4OCB participated in the phase separation process as a radical inert part and jointly formed the LCs-rich phase. The introduction of 4OCB was found to facilitate the formation of larger LC droplets in the LCs-rich regions at a proper loading. The morphology and performance variations come from the competition among LC diffusion, LC nucleation and system gelation. The 4OCB is believed to offer faster nucleation during the process of holographic photopolymerization induced phase separation. A decrease in the interface anchoring energy was also noticed between the LCs and polymer when incorporating 4OCB. After doping 5 wt% of 4OCB into the HPDLCs, the threshold and saturated voltages significantly decreased by 80.8% (i.e., from 12.0 ± 0.8 to 2.3 ± 0.9 V μm−1) and 73.2% (i.e., from 19.0 ± 0.6 to 5.1 ± 0.7 V μm−1), respectively, in comparison with the pristine, yet offering high diffraction efficiency of 92 ± 3%. This simple LC mixing protocol paves the way to fabricate diffractive optical elements with both high diffraction efficiency and low driving voltage.Conflicts of interest
The authors declare that there is no conflict of interest.Acknowledgements
We thank the financial support from the National Natural Science Foundation of China (51503045, 51433002, 51773073). The Natural Science Foundation of Hubei Scientific Committee (2016CFA001) and the Fundamental Research Funds for the Central Universities (2017KFYXJJ165) are also grateful.References
- C. Y. Li and T. J. Bunning, Curr. Opin. Chem. Eng., 2013, 2, 63 CrossRef.
- R. L. Sutherland, L. V. Natarajan, V. P. Tondiglia and T. J. Bunning, Chem. Mater., 1993, 5, 1533 CrossRef CAS.
- T. J. Bunning, L. V. Natarajan, V. P. Tondiglia and R. L. Sutherland, Annu. Rev. Mater. Sci., 2000, 30, 83 CrossRef CAS.
- K. N. Wang, J. H. Zheng, Y. R. Liu, H. Gao and S. L. Zhuang, Opt. Commun., 2017, 392, 128 CrossRef CAS.
- Y. J. Zhao, Z. Y. Xie, H. C. Gu, C. Zhu and Z. Z. Gu, Chem. Soc. Rev., 2012, 41, 3297 RSC.
- V. P. Tondiglia, L. V. Natarajan, R. L. Sutherland, D. Tomlin and T. J. Bunning, Adv. Mater., 2002, 14, 187 CrossRef CAS.
- K. N. Wang, J. H. Zheng, H. Gao, F. Y. Lu, L. J. Sun, S. Yin and S. L. Zhuang, Opt. Express, 2015, 23, 31436 CrossRef CAS PubMed.
- L. J. Liu, L. Xuan, G. Y. Zhang, M. H. Liu, L. F. Hu, Y. G. Liu and J. Ma, J. Mater. Chem. C, 2015, 3, 5566 RSC.
- W. B. Huang, Z. H. Diao, Y. G. Liu, Z. H. Peng, C. L. Yang, J. Ma and L. Xuan, Org. Electron., 2012, 13, 2307 CrossRef CAS.
- M. H. Liu, Y. G. Liu, Z. H. Peng, S. X. Wang, Q. D. Wang, Q. Q. Mu, Z. L. Cao and L. Xuan, Materials, 2017, 10, 509 CrossRef PubMed.
- M. H. Liu, Y. G. Liu, G. Y. Zhang, Z. H. Peng, D. Y. Li, J. Ma and L. Xuan, J. Phys. D: Appl. Phys., 2016, 49, 465102 CrossRef.
- H. Y. Peng, G. N. Chen, M. L. Ni, Y. Yan, J. Q. Zhuang, V. A. L. Roy, R. K. Y. Li and X. L. Xie, Polym. Chem., 2015, 6, 8259 RSC.
- H. Y. Peng, S. G. Bi, M. L. Ni, X. L. Xie, Y. G. Liao, X. P. Zhou, Z. G. Xue, J. T. Zhu, Y. Wei, C. N. Bowman and Y.-W. Mai, J. Am. Chem. Soc., 2014, 136, 8855 CrossRef CAS PubMed.
- G. N. Chen, M. L. Ni, H. Y. Peng, F. H. Huang, Y. G. Liao, M. K. Wang, J. T. Zhu, V. A. L. Roy and X. L. Xie, ACS Appl. Mater. Interfaces, 2017, 9, 1810 CAS.
- A. Ogiwara, M. Watanabe and Y. Ito, Appl. Opt., 2017, 56, 4854 CrossRef PubMed.
- M. L. Ni, G. N. Chen, H. W. Sun, H. Y. Peng, Z. F. Yang, Y. G. Liao, Y. S. Ye, Y. K. Yang and X. L. Xie, Mater. Chem. Front., 2017, 1, 294 RSC.
- Y. J. Liu, B. Zhang, Y. Jia and K. S. Xu, Opt. Commun., 2003, 218, 27 CrossRef CAS.
- M. S. Park and B. K. Kim, Nanotechnology, 2006, 17, 2012 CrossRef CAS.
- M. De Sarkar, N. L. Gill, J. B. Whitehead and G. P. Crawford, Macromolecules, 2003, 36, 630 CrossRef CAS.
- R. A. Ramsey and S. C. Sharma, ChemPhysChem, 2009, 10, 564 CrossRef CAS PubMed.
- N. H. Nataj, E. Mohajerani, H. Jashnsaz and A. Jannesari, Appl. Opt., 2012, 51, 697 CrossRef CAS PubMed.
- J. H. Park and B. K. Kim, J. Polym. Sci., Part A: Polym. Chem., 2013, 51, 1255 CrossRef CAS.
- H. Y. Peng, M. L. Ni, S. G. Bi, Y. G. Liao and X. L. Xie, RSC Adv., 2014, 4, 4420 RSC.
- Y. Fukuda and Y. Tomita, Materials, 2016, 9, 16 CrossRef PubMed.
- K. R. Moon, S. Y. Bae and B. K. Kim, Opt. Mater., 2015, 42, 160 CrossRef CAS.
- L. V. Natarajan, D. P. Brown, J. M. Wofford, V. P. Tondiglia, R. L. Sutherland, P. F. Lloyd and T. J. Bunning, Polymer, 2006, 47, 4411 CrossRef CAS.
- J. Y. Woo and B. K. Kim, Liq. Cryst., 2008, 35, 987 CrossRef CAS.
- J. Y. Woo, E. H. Kim and B. K. Kim, ChemPhysChem, 2008, 9, 141 CrossRef CAS PubMed.
- E. H. Kim, J. Y. Woo, Y. H. Cho and B. K. Kim, Bull. Chem. Soc. Jpn., 2008, 81, 773 CrossRef CAS.
- J. Y. Woo and B. K. Kim, ChemPhysChem, 2007, 8, 175 CrossRef CAS PubMed.
- J. Klosterman, L. V. Natarajan, V. P. Tondiglia, R. L. Sutherland, T. J. White, C. A. Guymon and T. J. Bunning, Polymer, 2004, 45, 7213 CrossRef CAS.
- Y. J. Liu, X. W. Sun, H. T. Dai, J. H. Liu and K. S. Xu, Opt. Mater., 2005, 27, 1451 CrossRef CAS.
- E. H. Kim, J. Y. Woo and B. K. Kim, Macromol. Rapid Commun., 2006, 27, 553 CrossRef CAS.
- J. D. Busbee, A. T. Yuhl, L. V. Natarajan, V. P. Tongdilia, T. J. Bunning, R. A. Vaia and P. V. Braun, Adv. Mater., 2009, 21, 3659 CrossRef CAS.
- K. Wang, J. Zheng, K. Gui, D. Li and S. Zhuang, Plasmonics, 2015, 10, 383 CrossRef CAS.
- K. Wang, J. Zheng, Y. Chen, Q. Wang, K. Gui and S. Zhuang, IEEE Photonics Technol. Lett., 2015, 27, 1048 CrossRef CAS.
- S. K. Shriyan and A. K. Fontecchio, Opt. Express, 2010, 18, 24842 CrossRef CAS PubMed.
- S. K. Shriyan and A. K. Fontecchio, Proc. SPIE, 2009, 7414, 741407 CrossRef.
- M. W. Jang and B. K. Kim, J. Mater. Chem., 2011, 21, 19226 RSC.
- B. K. Kim, M. W. Jang, H. C. Park, H. M. Jeong and E. Y. Kim, J. Polym. Sci., Part A: Polym. Chem., 2012, 50, 1418 CrossRef CAS.
- L. Q. Fei, P. Wang, W. Q. Yang and X. Q. Guo, Appl. Chem. Ind., 2013, 42, 803 CAS.
- T. F. Scott, B. A. Kowalski, A. C. Sullivan, C. N. Bowman and R. R. McLeod, Science, 2009, 324, 913 CrossRef CAS PubMed.
- H. H. Winter and F. Chambon, J. Rheol., 1986, 30, 367 CrossRef CAS.
- T. Tsuji, K. Kubo, A. Mori and Y. Nishimura, Talanta, 2001, 55, 485 CrossRef CAS PubMed.
- Y. Wang, H. G. Yoon, H. K. Bisoyi, S. Kumar and Q. Li, J. Mater. Chem., 2012, 22, 20363 RSC.
- Y. Bai, X. Chen, X. Wan, Q. F. Zhou, H. Liu, B. Zhang and Q. Gong, Appl. Phys. B: Lasers Opt., 2001, 73, 35 CrossRef CAS.
- T. J. Bunning, L. V. Natarajan, V. P. Tondiglia, R. L. Sutherland, R. Haaga and W. W. Adams, Proc. SPIE, 1996, 2651, 44 CrossRef CAS.
- J. A. Jung and B. K. Kim, Opt. Commun., 2005, 247, 125 CrossRef CAS.
- A. F. Senyurt, G. Warren, J. B. Whitehead and C. E. Hoyle, Polymer, 2006, 47, 2741 CrossRef CAS.
- M. De Sarkar, J. Qi and G. P. Crawford, Polymer, 2002, 43, 7335 CrossRef CAS.
- M. D. Schulte, S. J. Clarson, L. V. Natarajan, D. W. Tomlin and T. J. Bunning, Liq. Cryst., 2000, 27, 467 CrossRef CAS.
- Z. Zheng, F. Guo, Y. Liu and L. Xuan, Appl. Phys. B: Lasers Opt., 2008, 91, 17 CrossRef CAS.
- Y. J. Liu, X. W. Sun, J. H. Liu, H. T. Dai and K. S. Xu, Appl. Phys. Lett., 2005, 86, 041115 CrossRef.
Footnote |
| † Electronic supplementary information (ESI) available. See DOI: 10.1039/c7ra08949j |
| This journal is © The Royal Society of Chemistry 2017 |


