 Open Access Article
Creative Commons Attribution 3.0 Unported Licence
Thymine based copolymers: feasible sensors for the detection of persistent organic pollutants in water†
J. Ledesmaa,
P. L. Pisanob,
D. M. Martino‡
 c,
C. E. Boschetti
 a and
S. A. Bortolato
 *b
*b
aInstituto de Procesos Biotecnológicos y Químicos de Rosario, CONICET, Suipacha 570, Rosario 2000, Argentina
bInstituto de Química de Rosario, CONICET, Suipacha 570, Rosario 2000, Argentina. E-mail: bortolato@iquir-conicet.gov.ar
cInstituto de Física del Litoral, CONICET, Güemes 3450, Santa Fe 3000, Argentina
First published on 19th October 2017
Abstract
Polycyclic Aromatic Hydrocarbons (PAHs) are among the main persistent organic pollutants in water, because they can cause serious diseases in living organisms. The PAHs trace levels in environmental samples makes their detection particularly difficult. The development of new fluorescence spectroscopic sensors is a realistic alternative for the quantification of PAHs at very low concentrations. Bio-inspired copolymers based on thymine and charged groups showed high affinity for benzo[a]pyrene, the nastiest contaminant of the PAHs group, and can be used to enhance their native luminescence. In the present work we rationalized the observed experimental evidence using a theoretical model that studies the plausible non-covalent interactions (polar hydrogen–π, π–π “stacking”, etc.) between these compounds, in order to make a realistic design of new thymine-based copolymers sensors.
1 Introduction
The waste effluents of industrial plants have a fundamental accountability for the pollution of water, since they contain, among other components, some Polycyclic Aromatic Hydrocarbons (PAHs), the main persistent organic pollutants in water, which are distinguished for being formed by four or more fused benzene rings. The PAHs are formed during the incomplete combustion of coal, oil, gas, waste and other organic substances such as snuff and grilled meat. These compounds can trigger off serious human diseases, such as cancer and mutagenic processes,1,2 therefore the development of efficient analytical methods for their detection and quantification is a priority.The US Environmental Protection Agency designates sixteen PAHs as priority pollutants,3 drawing attention to the benzo[a]pyrene (BaP) as the most toxic. The European Union and the World Health Organization established a maximum acceptable BaP concentration of 10 ng L−1 in drinking water.4 The low concentration levels to be detected, together with the inherent complexity of the matrices where the PAHs are found, makes the determination of these compounds in environmental samples very complicated. Usually, the analytical strategies used include chromatographic techniques combined with specific detection systems.5–8 However, these methods are relatively expensive, use up huge experimental time, and often include a laborious sample treatment previous to the analysis.9–12 In summary, the resources reported in the literature used to achieve the required sensitivity represent a drawback for the design of a routine analysis in environmental laboratories.
Molecular luminescence spectroscopy, including fluorescence and phosphorescence in different variations of implementation (in organized media,5 over solid phases,13 combined with flow systems, etc.) has gained renewed interest. A review shows that the development of new luminescent methods represents an interesting alternative for quantification of analytes at trace level concentrations in samples of complex composition.14,15 Due to the recaptured attention around the topic, in the past two decades the development of chemical sensors for environmental analysis based on fluorescence signals was consolidated as a dynamic area within the sensor field.16 From a quite general view, a chemical sensor is frequently defined as a device that interacts chemically with an analyte, transforming either qualitative or quantitative chemical information into an analytically useful signal.17 More specifically, it is a miniaturized device able to provide real-time information about the presence of specific analyte in a sample.18
In a typical luminescence sensor, the emitted fluorescence or phosphorescence signals are measured after the analyte is immobilized on an appropriate solid support and the analytical signals can be related to the concentration of analyte in the sample.18 Generally, it involves the adsorption of the analyte onto the sensor either on a flat surface (via direct deposit or through an extraction procedure with a syringe),19–21 or by immobilizing the analyte on microbeads, constituted by polymeric materials, ion-exchange resins or bonded-phase silica gel, which are then transferred to a measuring cell before each determination.22 The latter option becoming an excellent alternative since it can be incorporated in flow methodologies.23–25
The main advantage of these methodologies is an increase in sensitivity values, than can become several orders of magnitude larger that the conventional solution methods.19,26 In addition, notable results are obtained with very little sample preparation through minimum instrumental requirements.19,26–28
Bio-inspired copolymers based on thymine can meet particular conditions that transform them into appropriate chemical sensors to detect PAHs.29 According to the desired analytical strategy, they can be used as organized media or as optical sensors in flow systems. In that sense, the key for a successful development of a new spectroscopic-polymer chemical sensor for PAHs is to regulate, at least, two aspects of the adsorption phenomenon. On one hand the solvent polarity, and on the other hand the nature of attractive or repulsive forces established between the sensor and the analyte. It is known that some of the spectroscopic properties of the analytes are related to the solvent polarity, to its hydrophilic or hydrophobic character, or to its ability to participate in hydrogen bonding.30
From the characteristics of the compounds under study, they may present non-covalent interactions such as π–π “stacking”, hydrogen polar–π, etc. The hydrogen–π interactions are classified into two groups: non-polar hydrogen–π interactions (H–π or CH–π) and polar hydrogen–π intermolecular interactions (Hp–π).31 The energies of interaction of Hp–π are much stronger than the H–π interactions, comparable even with hydrogen bonds. In the Hp–π interactions, “donors” are the polar hydrogen atoms attached to electronegative atoms (R2NH, RNH2, and ROH), and “acceptors” are molecules containing aromatic rings or conjugate π-bonds.31
Preliminary results obtained in our laboratory showed that the bio-inspired water-soluble copolymer of 1-(4 vinylbenzyl) thymine (VBT) and vinyl phenyl sulfonate (VPS) has high affinity for BaP (C20H12), and can be used to enhance the native luminescence to this contaminant. From this outcome, it was wished-for building a VBT and VPS copolymer sensor and develop a spectroscopic method to achieve the sensitivity required for the determination of BaP in water samples. To accomplish these goals we performed a series of rigorous experiments to clearly establish the experimental variables that determine the potentials of the sensor, and at the same time we explained the experimental evidence through a theoretical model that study the non-covalent interactions which define the analyte-sensor adsorption (Hp–π interactions as dominants).
The adaptability of VBT makes it a very attractive monomer, since the balance between solubility and non-covalent interactions can be fine-tuned for a wide variety of applications. Some practical applications involve hair-styling products,32 electrically conductive coatings,33 antibacterial-coated surfaces,34 removable large area photolithographic coatings,35 or recyclable plastics.36 Besides, in addition to the advantages mentioned above, the biodegradable characteristic of the thymine based sensor is a plus, which would encourage the development of macro-sensors with the ability to detect and remove the target species in the environment. Additionally, the potential methods based in our chemical sensor are simple procedures that meet most of the Green Analytical Chemistry (GAC) requirements26 given that thymine-based copolymers are environmentally benign and consistent with the twelve principles of green chemistry:37 a non-toxic, water-soluble, and biodegradable material, which requires low energies for processing.38
In summary, this work presents a potential contribution to the determination of BaP at trace levels, which combines the sensitivity of fluorescence spectroscopy and the ability of VBT–VPS copolymers to exacerbate the analytical properties of the contaminant considered. The method developed will allow to work at room temperature using very simple equipments.
2 Materials and methods
2.1. Materials
Isopropanol and acetone were purchased from Cicarelli (Buenos Aires, Argentina). Methanol, acetonitrile, dichloromethane, toluene, dimethyl sulfoxide and hexane were obtained from Merck (Darmstadt, Germany). Thymine, 4-vinylbenzyl chloride, 2,2′-azobis-2-methylpropionitrile (AIBN) and 2,6-di-tert-butyl-4-methylphenol were purchased from Sigma-Aldrich (Buenos Aires, Argentina). VPS salt was purchased from Fluka (Buenos Aires, Argentina). All reagents were of high-purity grade and used as received. VBT was synthesized from thymine and vinylbenzyl chloride as described previously.39 Based on 1H NMR spectra (Bruker 300 MHz NMR spectrometer) the monomeric products were deemed pure enough for the synthesis of the polymers.Benzo[a]pyrene (BaP) was purchased from Aldrich (Milwaukee, WI). A stock solution of 1000 mg L−1 BaP in methanol was prepared. From the stock solution, diluted solutions (ranging from 10 to 500 mg L−1) in several organic solvents were obtained. Aqueous solutions were prepared immediately before using them by taking appropriate aliquots of methanol solutions and diluting with water to the desired concentrations.
Hydrophilic polyethylenterephthalate film (PET-X4C1, Dupont, USA) was used as substrate without previous treatment. Coatings were done using wire-round milled coating rods purchased from RDS Corp. (Webster, NY, USA).
2.2. Random copolymer synthesis and characterization
To produce water-soluble polymers, VBT was copolymerized in a free radical process with the anionic monomer VPS, as previously reported.40 The ratio of VBT![[thin space (1/6-em)]](https://www.rsc.org/images/entities/char_2009.gif) :
:![[thin space (1/6-em)]](https://www.rsc.org/images/entities/char_2009.gif) VPS monomers influences the behaviour of the VBT polymeric system, and varies depending on the application. Therefore, VBTn
VPS monomers influences the behaviour of the VBT polymeric system, and varies depending on the application. Therefore, VBTn![[thin space (1/6-em)]](https://www.rsc.org/images/entities/char_2009.gif) :
:![[thin space (1/6-em)]](https://www.rsc.org/images/entities/char_2009.gif) VPSm have been synthesized with n = 1 and m = 1, 4, 8, 16.
VPSm have been synthesized with n = 1 and m = 1, 4, 8, 16.
![[thin space (1/6-em)]](https://www.rsc.org/images/entities/b_char_2009.gif) :
:![[thin space (1/6-em)]](https://www.rsc.org/images/entities/b_char_2009.gif) VPS 1
VPS 1![[thin space (1/6-em)]](https://www.rsc.org/images/entities/b_char_2009.gif) :
:![[thin space (1/6-em)]](https://www.rsc.org/images/entities/b_char_2009.gif) 1 copolymer. To a 300 mL, 3-neck, round-bottom flask containing 250 mL of water/isopropanol (50
1 copolymer. To a 300 mL, 3-neck, round-bottom flask containing 250 mL of water/isopropanol (50![[thin space (1/6-em)]](https://www.rsc.org/images/entities/char_2009.gif) :
:![[thin space (1/6-em)]](https://www.rsc.org/images/entities/char_2009.gif) 50) VBT (11.9 g, 0.049 mol) and VPS (10.1 g, 0.049 mol) were added. The solution was heated to 65 °C while stirring and 0.22 g of AIBN were added. Stirring was held for 18 h while the temperature was maintained at 65 °C. The reaction mixture was cooled to room temperature and rotary evaporated to 50% concentration. Adding the aqueous solution to 1 L of cold acetone the copolymer precipitated. Subsequently, the white solid precipitate was filtered and dried under vacuum. To verify the absence of unreacted monomers, the precipitated copolymer was analysed by 1H NMR spectroscopy and the typical vinyl group between 5 and 6 ppm was not observed in the spectra. Additionally, size exclusion chromatography (SEC) results were consistent with the presence of a polymeric system (see ESI†). Copolymer composition was checked determining total nitrogen and carbon by combustion using a Leco CN628 Analyser (Leco Corporation, MI, USA): theoretical C/N mass ratio of 9.43, experimental C/N mass ratio of 9.32.
50) VBT (11.9 g, 0.049 mol) and VPS (10.1 g, 0.049 mol) were added. The solution was heated to 65 °C while stirring and 0.22 g of AIBN were added. Stirring was held for 18 h while the temperature was maintained at 65 °C. The reaction mixture was cooled to room temperature and rotary evaporated to 50% concentration. Adding the aqueous solution to 1 L of cold acetone the copolymer precipitated. Subsequently, the white solid precipitate was filtered and dried under vacuum. To verify the absence of unreacted monomers, the precipitated copolymer was analysed by 1H NMR spectroscopy and the typical vinyl group between 5 and 6 ppm was not observed in the spectra. Additionally, size exclusion chromatography (SEC) results were consistent with the presence of a polymeric system (see ESI†). Copolymer composition was checked determining total nitrogen and carbon by combustion using a Leco CN628 Analyser (Leco Corporation, MI, USA): theoretical C/N mass ratio of 9.43, experimental C/N mass ratio of 9.32.![[thin space (1/6-em)]](https://www.rsc.org/images/entities/b_char_2009.gif) :
:![[thin space (1/6-em)]](https://www.rsc.org/images/entities/b_char_2009.gif) VPS 1
VPS 1![[thin space (1/6-em)]](https://www.rsc.org/images/entities/b_char_2009.gif) :
:![[thin space (1/6-em)]](https://www.rsc.org/images/entities/b_char_2009.gif) 4, 1
4, 1![[thin space (1/6-em)]](https://www.rsc.org/images/entities/b_char_2009.gif) :
:![[thin space (1/6-em)]](https://www.rsc.org/images/entities/b_char_2009.gif) 8 and 1
8 and 1![[thin space (1/6-em)]](https://www.rsc.org/images/entities/b_char_2009.gif) :
:![[thin space (1/6-em)]](https://www.rsc.org/images/entities/b_char_2009.gif) 16 copolymers. Identical procedures varying only the corresponding ratios of starting monomers were followed. Polymer characterization, including 1H NMR spectroscopy, SEC and elemental analysis, was previously reported.33,40 We verified the obtaining of the required polymers by determining 1H NMR spectra and molecular weight in each case (see ESI†).
16 copolymers. Identical procedures varying only the corresponding ratios of starting monomers were followed. Polymer characterization, including 1H NMR spectroscopy, SEC and elemental analysis, was previously reported.33,40 We verified the obtaining of the required polymers by determining 1H NMR spectra and molecular weight in each case (see ESI†).2.3. Coating preparation for the scanning electron microscopy analysis
Aqueous solutions 10% w/w of VBT![[thin space (1/6-em)]](https://www.rsc.org/images/entities/char_2009.gif) :
:![[thin space (1/6-em)]](https://www.rsc.org/images/entities/char_2009.gif) VPSm copolymers, with m = 1, 4, 8 and 16 where prepared and homogenized by sonication. PET film was used as substrate without previous treatment. A known amount of aqueous copolymer solution was distributed homogeneously using a #06 wire-round milled coating rod, which resulted in coatings with 13.6 μm wet thickness.41 The films were dried at room temperature for two hour. Subsequently 50 × 10−3 mL of a BaP solution (1000 mg L−1) were deposited on the films, maintaining a group of uncontaminated PET film as a control.
VPSm copolymers, with m = 1, 4, 8 and 16 where prepared and homogenized by sonication. PET film was used as substrate without previous treatment. A known amount of aqueous copolymer solution was distributed homogeneously using a #06 wire-round milled coating rod, which resulted in coatings with 13.6 μm wet thickness.41 The films were dried at room temperature for two hour. Subsequently 50 × 10−3 mL of a BaP solution (1000 mg L−1) were deposited on the films, maintaining a group of uncontaminated PET film as a control.
2.4. Apparatus and software
Fluorescence measurements (in solid-phase or solution) were carried out on a Varian Cary-Eclipse luminescence spectrometer (Varian, Mulgrave, Australia) equipped with a xenon flash lamp and controlled by a microprocessor fitted with the Cary Eclipse software package. Excitation and emission slit widths were 5 nm, while the photomultiplier sensitivity was set on 655 V. Excitation–emissions fluorescence matrices (EEFMs) were registered in the following conditions: λexc = 300–365 nm and λems = 370–450 nm every 1 nm. For the fluorescence measurements of the PET films containing the sample, the selected configuration implied the introduction of PET into a usual quartz cell, so the angle formed between the excitation and emission beams was 90°, with an incident angle of 45°.Scanning electron micrographs of PET films were performed using a scanning electron microscope (Leitz-AMR1600 T, Koln, Germany). The films were previously sputter-coated with a gold layer in order to make them conductive.
2.5. Computational methods
Molecular modelling of the system initially begun with a conformational search of a huge number of geometries (up to 100) that were generated by using the method of molecular mechanics MM+ from the Hyperchem software.42 Subsequently, selected structures were optimized with the M06-2X43 exchange correlation functional coupled with the 6-31+G(d,p) basis set by using a ONIOM (M06-2X/6-31+G(d,p):uff) hybrid method with Gaussian 09W software.44 The functional M06-2X from Truhlar's group is frequently used to model non-covalent interactions.45Considering the size of the system under study, in which CPU time calculations would be prohibitively long for a rational design of copolymers, ONIOM46 methodology allows to approximate the calculation of a real system of many atoms by modelling only a small number of central atoms with an elevated level of theory (high layer, M06-2X/6-31+G(d,p)). Then, the rest of the system is treated with a less accurate model (low layer, universal force field uff). Therefore, the energy of the real system at the higher theory level can be estimated as E(ONIOM,real) = E(high,model) + E(low,real) − E(low,model).
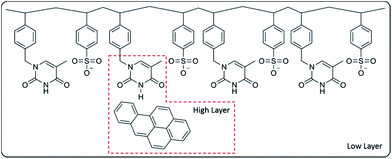
In our case, the modelled system involved a copolymer of four molecules of VBT and four molecules of VPS with one molecule of BaP, by placing one of the thymine fragments at 4.5 Å of the BaP molecule (Fig. 1). As can be seen in Fig. 1, the high layer consist of the Bap molecule and a ring of thymine from the VBT moiety.
All ONIOM geometry optimizations were performed in solution by computing the reaction field separately in each sub-calculation always using the cavity of the real system.47 Solvents used for calculation were acetonitrile (ε = 35.69), dimethyl sulfoxide (ε = 46.83), dichloromethane (ε = 8.93), and toluene (ε = 2.37). Finally, frequency calculations were performed to verify the nature of the stationary points (i.e., to not find imaginary frequencies).
3 Results and discussions
3.1. Theory section
The goal of the computational study was to find indications of the existence of non-covalent interaction between VBT–VPS copolymer and BaP, in order to design new sensors by tuning thymine-based copolymers looking for higher copolymer–analyte interactions.Fig. 2 shows optimized geometries by ONIOM method of the system VBT![[thin space (1/6-em)]](https://www.rsc.org/images/entities/char_2009.gif) :
:![[thin space (1/6-em)]](https://www.rsc.org/images/entities/char_2009.gif) VPS1/BaP in the four solvents studied. As it can be seen from Fig. 2, similar conformations were obtained for all solvents, in which the thymine ring of VBT moiety is close to the most external aromatic ring in BaP with an interaction of parallel-offset face-to-face type (π–π “stacking” interaction). Furthermore, the closest interaction in all solvents was between a hydrogen atom of N–H thymine moiety of the copolymer and the external aromatic ring of BaP where the distance varies from 3.158 to 3.362 Å, depending on the solvent. This type of Hp–π interaction, wherein the hydrogen atom is on the geometric centre of the aromatic ring in question, arise from a N–H thymine moiety acting as “donor” and an aromatic ring of BaP as “acceptor”.
VPS1/BaP in the four solvents studied. As it can be seen from Fig. 2, similar conformations were obtained for all solvents, in which the thymine ring of VBT moiety is close to the most external aromatic ring in BaP with an interaction of parallel-offset face-to-face type (π–π “stacking” interaction). Furthermore, the closest interaction in all solvents was between a hydrogen atom of N–H thymine moiety of the copolymer and the external aromatic ring of BaP where the distance varies from 3.158 to 3.362 Å, depending on the solvent. This type of Hp–π interaction, wherein the hydrogen atom is on the geometric centre of the aromatic ring in question, arise from a N–H thymine moiety acting as “donor” and an aromatic ring of BaP as “acceptor”.
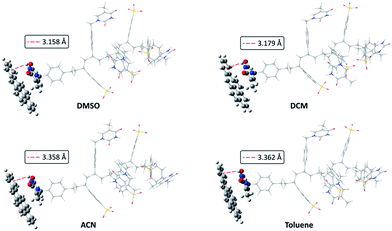 | ||
Fig. 2 Optimized geometries by ONIOM method for the system VBT![[thin space (1/6-em)]](https://www.rsc.org/images/entities/char_2009.gif) : :![[thin space (1/6-em)]](https://www.rsc.org/images/entities/char_2009.gif) VPS1/Bap in the four solvents studied. Red dotted line indicates the interaction distance. VPS1/Bap in the four solvents studied. Red dotted line indicates the interaction distance. | ||
Table 1 summarise the relative free Gibbs energy values and distance of the Hp–π interaction for the different organic solvents. DMSO gives the closest Hp–π interaction (3.158 Å) in the system, and additionally, the smallest relative free energy. These results are consistent with the stabilization produced by the Hp–π interaction. Additionally, observed difference among the solvents are explained in view of the increased solvent polarity in the series from DMSO to toluene.
| Solvent | Relative free energya (kcal mol−1) | Hp–π distanceb (Å) |
|---|---|---|
| a Relative free Gibbs energies in kcal mol−1 of the modelled systems.b Hp–π interaction in ångströms (Å) between hydrogen atom from N–H thymine moiety of copolymer and the external aromatic ring of BaP. | ||
| DMSO | 0.00 | 3.158 |
| DCM | 0.16 | 3.179 |
| ACN | 1.92 | 3.358 |
| TOL | 6.38 | 3.362 |
The proposed model failed to evaluate same interactions produced in water because, in this solvent, the conventional hydrogen bonds of N–H thymine moiety with water are by far more predominant than the non-covalent interactions generated with BaP.
Finally, it is known that the degree of sensitivity in fluorescence signal is also due to the interactions that take place in the local environment during the excited state lifetime. Nevertheless, theoretical evidence of the existence of interactions in the ground state could serve as good initial approximation in rational design of thymine copolymers, taking into account that TD-DFT (excited state) calculations are by far CPU time demanding and they overcome the application of this initial theoretical screening.
3.2. Experimental section
![[thin space (1/6-em)]](https://www.rsc.org/images/entities/char_2009.gif) :
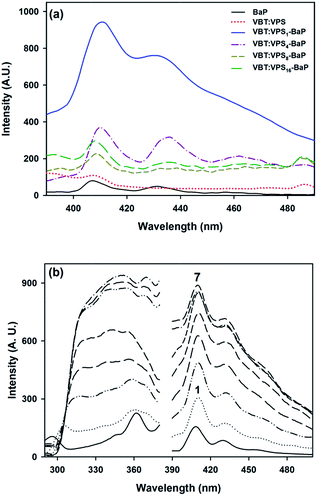
:![[thin space (1/6-em)]](https://www.rsc.org/images/entities/char_2009.gif) VPSm copolymers, with m = 1, 4, 8 and 16) and BaP in water were tested (in all cases, the concentrations of BaP and copolymer were set to 5 × 10⁻³ mg L−1 and 5 × 10³ mg L−1, respectively). Fig. 3 shows that the enhancing effect decreased notably when the VBT percentage in the copolymer is reduced. Is likely that the reduction of thymine residues in the copolymer network obstructs the interaction between the thymine hydrogen and the sterically less hindered benzene ring, which causes a marked reduction in the interaction that explains the observed exaltation (further detailed analysis, see Theory section). In view of this outcome, we decided to work with the highest VBT ratio (VBT
VPSm copolymers, with m = 1, 4, 8 and 16) and BaP in water were tested (in all cases, the concentrations of BaP and copolymer were set to 5 × 10⁻³ mg L−1 and 5 × 10³ mg L−1, respectively). Fig. 3 shows that the enhancing effect decreased notably when the VBT percentage in the copolymer is reduced. Is likely that the reduction of thymine residues in the copolymer network obstructs the interaction between the thymine hydrogen and the sterically less hindered benzene ring, which causes a marked reduction in the interaction that explains the observed exaltation (further detailed analysis, see Theory section). In view of this outcome, we decided to work with the highest VBT ratio (VBT![[thin space (1/6-em)]](https://www.rsc.org/images/entities/char_2009.gif) :
:![[thin space (1/6-em)]](https://www.rsc.org/images/entities/char_2009.gif) VPS1).
VPS1).
Fluorescence measurements of copolymer aqueous solutions with BaP were performed to explore the interaction between the analyte and VBT![[thin space (1/6-em)]](https://www.rsc.org/images/entities/char_2009.gif) :
:![[thin space (1/6-em)]](https://www.rsc.org/images/entities/char_2009.gif) VPS1. Fig. 3b shows the fluorescence excitation and emission spectra of seven solutions (λems = 410 nm, λexc = 360 nm), where the concentration of VBT
VPS1. Fig. 3b shows the fluorescence excitation and emission spectra of seven solutions (λems = 410 nm, λexc = 360 nm), where the concentration of VBT![[thin space (1/6-em)]](https://www.rsc.org/images/entities/char_2009.gif) :
:![[thin space (1/6-em)]](https://www.rsc.org/images/entities/char_2009.gif) VPS1, was varied from 0.5 × 10³ mg L−1 to 6.5 × 10³ mg L−1, in 1 × 10³ mg L−1 steps, while the BaP concentration was set to 5 × 10⁻³ mg L−1.
VPS1, was varied from 0.5 × 10³ mg L−1 to 6.5 × 10³ mg L−1, in 1 × 10³ mg L−1 steps, while the BaP concentration was set to 5 × 10⁻³ mg L−1.
Initial results showed a remarkable enhancement in the inherent fluorescence of BaP, but clearly the projected effect maximized at concentrations greater than or equal to 5 × 10³ mg L−1, making it unnecessary to work at higher concentrations. A systematic study of the contaminant interaction is fully justified, which sets the foundations for the development of a thymine-based sensor.
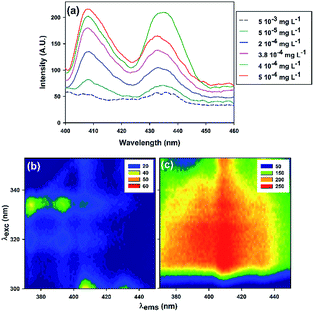
In the next step a known mass of copolymer (final concentration of 5 × 10³ mg L−1) was added to solutions of different BaP concentrations in order to define the optimum ratio of the observed effect and to outline the analytical usefulness of the sensor (e.g., lowest BaP concentration possible with quantifiable signal). In this case, both single fluorescence emission spectra and excitation–emission matrices were recorded to develop a better approach.
Fig. 4 shows that the luminescent exacerbation persisted, however the system becomes very unstable due to the alteration of the spectral bands characteristics of BaP, and spectral red shifts were observed.
Shifts or modifications in emission bands can be induced by a change in solvent nature or matrix composition, what actually is an evidence of changes in solvation energy.48 Several examples described in the literature have shown that specific solute–solvent non-covalent interactions should be considered as one of the various aspects of fluorescence phenomenon.49,50
The random copolymeric synthesis used in this work yields statistical water soluble copolymers, with several potential conformational changes that could explain the distortion observed.51 This important point deserves further discussion since dissimilar non-covalent interactions in different samples can lead to dramatic changes in the fluorescence spectra, which could hinder achieving the set goal.
A modification of a solvent ability to form non-covalent interactions with the analyte, alternate the order of the transitions in the excited state (π–π* instead of n–π*); therefore, increases the relative intensity of the vibronic bands of the aromatic compounds.49 It is very likely that some of the above happened, therefore it was essential to carry out a systematic study of the solvent effect on our system.
Fig. 5a shows BaP solutions in different aprotic solvents (polar and non-polar), where it is seen that DMSO induced the π–π* state at lower energy. The following order of fluorescence exaltation can be established depending on the solvent used: DMSO > CH2Cl2 > ACN ≈ TOL.
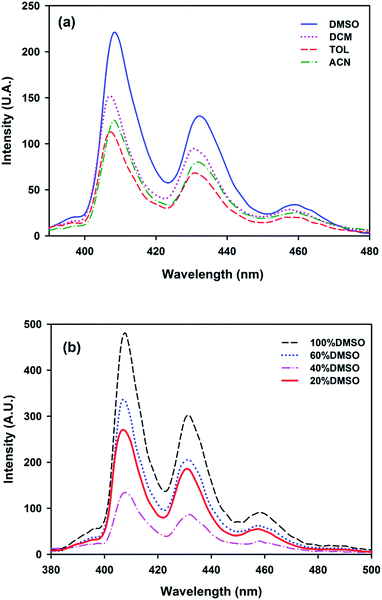 | ||
Fig. 5 (a) BaP solvation in different solvents ([BaP] = 5 × 10⁻³ mg L−1). (b) Interaction between BaP (5 × 10⁻³ mg L−1) and VBT![[thin space (1/6-em)]](https://www.rsc.org/images/entities/char_2009.gif) : :![[thin space (1/6-em)]](https://www.rsc.org/images/entities/char_2009.gif) VPS1 (0.25 × 10³ mg L−1) in DMSO VPS1 (0.25 × 10³ mg L−1) in DMSO![[thin space (1/6-em)]](https://www.rsc.org/images/entities/char_2009.gif) : :![[thin space (1/6-em)]](https://www.rsc.org/images/entities/char_2009.gif) H2O solutions of different ratio. H2O solutions of different ratio. | ||
In order to develop an environmentally friendly sensor, the next step was to investigate the effect produced by addition of water to the copolymer–BaP–DMSO system (DMSO being the solvent that causes the highest fluorescence enhancement). It was expected that increasing the protic character of the DMSO–water mixture will decrease the strong solvation on BaP since the copolymer establishes other interactions with water (i.e., hydrogen bonds between VBT and water).49
As it was expected, when the polarity of the solvent increases, the fluorescence enhancement of BaP decreases (Fig. 5b). In addition, the effect is fully reproducible (not shown), suggesting that the new environment gives lower rigidity to BaP. Interestingly enough, it was noted that the signal decreases proportionally with the amount of water added to the solvent mixture, however when the percentage of DMSO is 20%, the signal is once again very good. These particular results can be explained by the fact that an optimal balance between a hydrophobic effect (that pushes the BaP closer to the thymine) and a non-covalent interaction VBT–BaP (besides the rigid solvation of DMSO on BaP) was established, leading to similar responses observed when the analyte was dissolved in the DMSO aprotic ideal solvent.
To further explain the topic discussed in this section, we performed new analyses directly on a solid support, in order to systematically investigate the interaction between the contaminant and the copolymer.
![[thin space (1/6-em)]](https://www.rsc.org/images/entities/char_2009.gif) :
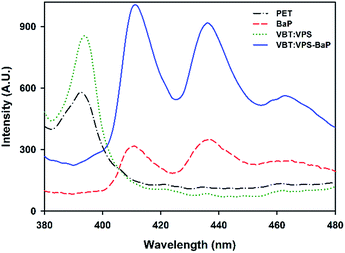
:![[thin space (1/6-em)]](https://www.rsc.org/images/entities/char_2009.gif) VPS1 copolymer 10% w/v coated on PET (green dotted line), are irrelevant for wavelengths greater than 400 nm. In addition, the typical emission spectrum of 5 × 10⁻² mg of BaP on PET is shown (red dotted line). The emission spectrum of the film corresponding to a VBT
VPS1 copolymer 10% w/v coated on PET (green dotted line), are irrelevant for wavelengths greater than 400 nm. In addition, the typical emission spectrum of 5 × 10⁻² mg of BaP on PET is shown (red dotted line). The emission spectrum of the film corresponding to a VBT![[thin space (1/6-em)]](https://www.rsc.org/images/entities/char_2009.gif) :
:![[thin space (1/6-em)]](https://www.rsc.org/images/entities/char_2009.gif) VPS1 copolymer solution with the addition of 5 × 10⁻² mL of 1 mg L−1 BaP solution (blue solid line), shows remarkable enhancement of fluorescence, which suggests the existence of some kind of non-covalent interaction between BaP and copolymer VBT
VPS1 copolymer solution with the addition of 5 × 10⁻² mL of 1 mg L−1 BaP solution (blue solid line), shows remarkable enhancement of fluorescence, which suggests the existence of some kind of non-covalent interaction between BaP and copolymer VBT![[thin space (1/6-em)]](https://www.rsc.org/images/entities/char_2009.gif) :
:![[thin space (1/6-em)]](https://www.rsc.org/images/entities/char_2009.gif) VPS1.
VPS1.
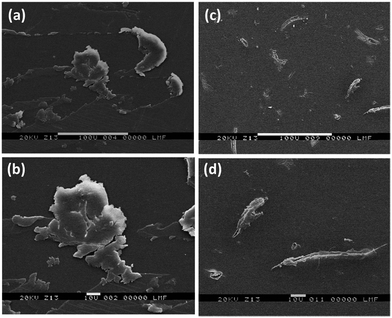
Fig. 7 shows the Scanning Electron Microscopy images (SEM) with different magnifications, of the films whose fluorescence spectra were obtained previously (Fig. 6). Results obtained by fluorescence spectroscopy totally correlate with the evidence collected by SEM: compact amorphous clusters were appreciated when only VBT![[thin space (1/6-em)]](https://www.rsc.org/images/entities/char_2009.gif) :
:![[thin space (1/6-em)]](https://www.rsc.org/images/entities/char_2009.gif) VPS1 was present, which can be connected with a poor fluorescent signal system (Fig. 7a and b). However, is remarkable how the previous amorphous structure was sharply disentangled when BaP was added to the copolymer film (Fig. 7c and d). The new arrangement could explain the enhancement fluorescent signal previously recorded (Fig. 6, solid blue line).
VPS1 was present, which can be connected with a poor fluorescent signal system (Fig. 7a and b). However, is remarkable how the previous amorphous structure was sharply disentangled when BaP was added to the copolymer film (Fig. 7c and d). The new arrangement could explain the enhancement fluorescent signal previously recorded (Fig. 6, solid blue line).
In summary, the experimental evidences completed on solid phase are in consonance with both the experimental results performed in solution and the results of the theoretical model, which rationalize the observations shown in Fig. 6 and 7. These indications provide a solid foundation for the construction of a sensitive and versatile fluorescent sensor for determining BaP contaminant.
4 Conclusions
The existence of a non-covalent interaction between thymine-based copolymer and BaP were corroborated from two analytical methods: fluorescence spectroscopy and scanning electron microscopy.It was demonstrated that the Bap in VBT![[thin space (1/6-em)]](https://www.rsc.org/images/entities/char_2009.gif) :
:![[thin space (1/6-em)]](https://www.rsc.org/images/entities/char_2009.gif) VPS1 water solutions significantly increases its fluorescence. Additionally, the study of the non-covalent interaction was performed in a series of aprotic solvents, being DMSO the solvent which produced the largest fluorescence enhancement. An explanation of the phenomenon was given. Finally, the experimental conditions to utilize the VBT
VPS1 water solutions significantly increases its fluorescence. Additionally, the study of the non-covalent interaction was performed in a series of aprotic solvents, being DMSO the solvent which produced the largest fluorescence enhancement. An explanation of the phenomenon was given. Finally, the experimental conditions to utilize the VBT![[thin space (1/6-em)]](https://www.rsc.org/images/entities/char_2009.gif) :
:![[thin space (1/6-em)]](https://www.rsc.org/images/entities/char_2009.gif) VPS1 copolymer as a BaP sensor in water were established.
VPS1 copolymer as a BaP sensor in water were established.
When the BaP–VBT: VPS1 system was isolated on PET, similar results to those achieved in solution were obtained, with a remarkable exaltation of the BaP fluorescence due to the non-covalent interaction with the thymine of the VBT.
Optimized geometries obtained in the computational study suggest that two types of π interaction exists in the system: Hp–π interaction and π–π interaction (“stacking”). Hp–π interaction arise from N–H thymine moiety of the copolymer and the external aromatic ring of BaP. The results found in the theoretical study might explain, in part, the high affinity between the VBT–VPS copolymer and BaP evidenced experimentally.
Although it has not yet being demonstrated that the sensor can detect BaP in less than 10 ng L−1, from the reported results this goal is highly possible to achieve.
In summary, the use of VBT![[thin space (1/6-em)]](https://www.rsc.org/images/entities/char_2009.gif) :
:![[thin space (1/6-em)]](https://www.rsc.org/images/entities/char_2009.gif) VPS1 copolymers as sensors for the determination of BaP in water samples is feasible. The large number of variables involved in the process suggest the implementation of a strategy of rational experimentation in order to propose the best conditions to develop the desired sensor. Currently, tested variables are being optimized to give more robustness to the proposed methodology.
VPS1 copolymers as sensors for the determination of BaP in water samples is feasible. The large number of variables involved in the process suggest the implementation of a strategy of rational experimentation in order to propose the best conditions to develop the desired sensor. Currently, tested variables are being optimized to give more robustness to the proposed methodology.
Conflicts of interest
There are no conflicts to declare.Acknowledgements
SAB, CEB and PLP are members of CONICET. JL thanks CONICET for a doctoral fellowship. Authors are grateful for the grants received from CONICET (PIP 112-200801-01079 and 112-201101-0089), Universidad Nacional del Litoral (CAI+D PI 11-57 and PI 501-93), Secretaría de Estado de Ciencia, Tecnología e Innovación, Provincia de Santa Fe (Proyecto 2010-182-13).References
- J. Santodonato, Chemosphere, 1997, 34, 835–848 CrossRef CAS PubMed.
- J. Yan, L. Wang, P. Fu and H. Yu, Mutat. Res., 2004, 557, 256–253 Search PubMed.
- Environmental Protection Agency (EPA) of the United States of America, Compendium Method TO-13A, EPA, Cincinnati, OH, USA, 1999 Search PubMed.
- Council of the European Communities, Directive 98/83/EC, Off. J. Eur. Communities: Legis., 1998, 330, 32 Search PubMed.
- T. Vo-Dinh, Chemical Analysis of Polycyclic Aromatic Compounds, Wiley, New York, 1990 Search PubMed.
- (a) A. Prieto, S. Schrader and M. Moeder, J. Chromatogr. A, 2010, 1217, 6002–6011 CrossRef CAS PubMed; (b) L. Guo and H. K. Lee, J. Chromatogr. A, 2011, 1218, 9321–9327 CrossRef CAS PubMed.
- M. Shamsipur and B. Hashemi, RSC Adv., 2015, 5, 20339–20345 RSC.
- A. Andrade-Eiroa, R. Shahla, M. N. Romanías and P. Dagaut, RSC Adv., 2014, 4, 33636–33644 RSC.
- US EPA, Appendix A to part 136, Methods for Organic Chemical Analysis of Municipal and Industrial Wastewater, Method 610, Polynuclear Aromatic Hydrocarbons, U.S. Environmental Protection Agency, Washington, D.C., 1984 Search PubMed.
- S. A. R. Soares, C. R. Costa, R. G. O. Araujo, M. R. Zucchi, J. J. Celino and L. S. G. Teixeira, J. Braz. Chem. Soc., 2015, 26(5), 955–962 CAS.
- J. W. Hodgeson, Method 550: Determination of Polycyclic Aromatic Hydrocarbons in Drinking Water by Liquid-Liquid Extraction and HPLC with Coupled Ultraviolet and Fluorescence Detection, U.S. Environmental Protection Agency, Cincinnati, OH, 1990 Search PubMed.
- (a) M. T. Pena, M. C. Casais, M. C. Mejuto and R. Cela, J. Chromatogr. A, 2009, 1216, 6356–6364 CrossRef CAS PubMed; (b) H. Wang and A. D. Campiglia, Anal. Chem., 2008, 80, 8202–8209 CrossRef CAS PubMed.
- R. J. Hurtubise, Anal. Chim. Acta, 1997, 351, 1–16 CrossRef CAS.
- S. A. Bortolato, J. A. Arancibia and G. M. Escandar, Anal. Chem., 2008, 80, 8276–8286 CrossRef CAS PubMed.
- S. G. Dmitrienko, E. Ya. Gurariy, R. E. Nosov and Y. A. Zolotov, Anal. Lett., 2001, 34(3), 425–438 CrossRef CAS.
- G. A. Ibañez and G. M. Escandar, Sensors, 2011, 11, 11081–11102 CrossRef PubMed.
- A. M. Powe, S. Das, M. Lowry, B. El-Zahab, S. O. Fakayode, M. L. Geng, G. A. Baker, L. Wang, M. E. McCarroll and G. Patonay, Anal. Chem., 2010, 82, 4865–4894 CrossRef CAS PubMed.
- O. S. Wolfbeis, Anal. Chem., 2006, 78, 3859–3874 CrossRef CAS PubMed.
- S. A. Bortolato, J. A. Arancibia and G. M. Escandar, Anal. Chim. Acta, 2008, 613, 218–227 CrossRef CAS PubMed.
- R. A. Correa and G. M. Escandar, Anal. Chim. Acta, 2006, 571, 58–65 CrossRef CAS PubMed.
- S. Zhang, Z. Li, X. Yang, C. Wang and Z. Wang, RSC Adv., 2015, 5, 54329–54337 RSC.
- M. Trojanowicz, Advances in Flow Analysis, Wiley, New York, 2008 Search PubMed.
- S. Matsuoka and K. Yoshimura, Anal. Chim. Acta, 2010, 664, 1–18 CrossRef CAS PubMed.
- R. B. R. Mesquita and A. O. S. S. Rangel, Anal. Chim. Acta, 2009, 648, 7–22 CrossRef CAS PubMed.
- J. F. Fernández Sánchez, A. Segura Carretero, J. M. Costa Fernández, N. Bordel, R. Pereiro, C. Cruces Blanco, A. Sanz Medel and A. Fernández Gutiérrez, Anal. Bioanal. Chem., 2003, 377, 614–623 CrossRef PubMed.
- A. Molina-Díaz, J. F. García-Reyes and B. Gilbert-López, TrAC, Trends Anal. Chem., 2010, 29, 654–666 CrossRef.
- A. Valero-Navarro, J. F. Fernández-Sánchez, A. L. Medina-Castillo, F. Fernández-Ibáñez, A. Segura-Carretero, J. M. Ibáñez and A. Fernández-Gutiérrez, Chemosphere, 2007, 67, 903–910 CrossRef CAS PubMed.
- J. F. Fernández-Sánchez, A. Segura Carretero, C. Cruces-Blanco and A. Fernández-Gutiérrez, Anal. Chim. Acta, 2004, 506, 1–7 CrossRef.
- B. Adhikari and S. Majumdar, Prog. Polym. Sci., 2004, 29, 699–766 CrossRef CAS.
- J. R. Lakowicz, Principles of Fluorescence Spectroscopy, Springer, New York, 2006 Search PubMed.
- Q. Du, Q. Wang, L. Du, D. Chen and R. Huang, Chem. Cent. J., 2013, 7, 92–100 CrossRef PubMed.
- A. S. Cannon, S. Amy, J. Raudys, A. Undurti and J. C. Warner, U.S. Pat. 7 550 136, 2003.
- S. Trakhtenberg, Y. Hangun-Balkir, J. C. Warner, F. F. Bruno, J. Kumar, R. Nagarajan and L. A. Samuelson, J. Am. Chem. Soc., 2005, 127, 9100–9104 CrossRef CAS PubMed.
- R. El-Hayek and J. C. Warner, J. Biomed. Mater. Res., Part A, 2006, 79(4), 874–881 CrossRef PubMed.
- J. Whitfield, A. Morelli and J. C. Warner, J. Macromol. Sci., Part A: Pure Appl.Chem., 2005, 42, 1541–1546 CrossRef.
- J. C. Warner, A. Morelli and M. C. Ku, Methods of solubilizing and recycling biodegradable polymers containing photoreactive moieties using irradiation, U.S. Pat. US 2003224497, Appl. Publ., 2003, p. 4.
- P. T. Anastas and J. C. Warner, Green Chemistry: Theory and Practice, Oxford University Press, New York, 1998 Search PubMed.
- N. Casis, C. V. Luciani, J. Vich Berlanga, D. A. Estenoz, D. M. Martino and G. R. Meira, Green Chem. Lett. Rev., 2007, 1, 65–72 CrossRef CAS.
- C. Cheng, M. Egbe, J. Grasshoff, D. Guarrera, R. Pai, J. C. Warner and L. J. Taylor, J. Polym. Sci., Part A: Polym. Chem., 1995, 33, 2515–2519 CrossRef CAS.
- C. Kiarie, J. Bianchini, S. Trakhtenberg and J. C. Warner, J. Macromol. Sci., Part A: Pure Appl.Chem., 2005, 42, 1489–1496 CrossRef.
- D. M. MacLeod, in Coating Technology Handbook, ed. D. Satas, Marcel Dekker, New York, 1991 Search PubMed.
- Hyperchem Professional Release 7.52, Hypercube, 2005 Search PubMed.
- Y. Zhao and D. G. Truhlar, Acc. Chem. Res., 2008, 41, 157–167 CrossRef CAS PubMed.
- M. J. Frisch, et al., Gaussian 09, Revision A.02, Gaussian, Inc., Wallingford, CT, 2009 Search PubMed.
- Y. Zhao and D. Truhlar, Theor. Chem. Acc., 2008, 120, 215–241 CrossRef CAS.
- L. W. Chung, W. M. C. Sameera, R. Ramozzi, A. J. Page, M. Hatanaka, G. P. Petrova, T. V. Harris, X. Li, Z. Ke, F. Liu, H.-B. Li, L. Ding and K. Morokuma, Chem. Rev., 2015, 115, 5678–5796 CrossRef CAS PubMed.
- T. Vreven, B. Mennucci, C. O. D. Silva, K. Morokuma and J. Tomasi, J. Chem. Phys., 2001, 115, 62–72 CrossRef CAS.
- B. Valuer, Molecular fluorescence principles and applications, Willey, Weinheim, Germany, 2002 Search PubMed.
- Y. Niko, Y. Cho, S. Kawauchi and G. Konishi, RSC Adv., 2014, 4, 36480–36484 RSC.
- A. Ya Freidzon, R. R. Valiev and A. A. Berezhnoy, RSC Adv., 2014, 4, 42054–42065 RSC.
- I. Teraoka, Polymer Solutions: An Introduction to Physical Properties, Willey, New York, 2002 Search PubMed.
Footnotes |
| † Electronic supplementary information (ESI) available. See DOI: 10.1039/c7ra08868j |
| ‡ Present address: Warner Babcock Institute for Green Chemistry, 100 Research dr, Wilmington, MA, 01887, USA. |
| This journal is © The Royal Society of Chemistry 2017 |

