DOI:
10.1039/C7RA08864G
(Paper)
RSC Adv., 2017,
7, 44915-44922
Blue to magenta tunable luminescence from LaGaO3: Bi3+, Cr3+ doped phosphors for field emission display applications†
Received
10th August 2017
, Accepted 7th September 2017
First published on 19th September 2017
Abstract
A series of blue to magenta emitting color-tunable LaGaO3: Bi3+/Cr3+ phosphors were prepared by chemical routes, and their phase structure, morphology and photoluminescence (PL) properties were investigated in detail. Luminescence studies indicated that the optimum concentrations of Bi3+ and Cr3+ in LaGaO3 were found to be 1 at% and 3 at%. Co-doping with Bi3+ ions resulted in increased Cr3+ emission intensity and gradual reduction in Bi3+ emission intensity, confirming the presence of a Bi3+–Cr3+ energy transfer. The energy transfer (ET) mechanism from the host lattice to the Bi3+ and Cr3+ ions in the LaGaO3: Bi3+/Cr3+ phosphor has been explained. The ET efficiency has been calculated and found to be 55%. The critical ET distance has been calculated by the concentration-quenching method. The enhanced intensity and tuned luminous color of LaGaO3: Bi3+/Cr3+ phosphors provided a promising material for field emission display devices.
Introduction
Currently, oxide-based perovskite phosphors are strategic components for display applications, described by the general chemical formula ABO3. Research on these materials opens a variety of new possibilities in the field of flat panel display devices, which can be integrated into various types of displays such as plasma display panels (PDPs), vacuum fluorescent displays (VFDs), electro-luminescent displays (EDs) and field emission displays (FEDs).1–7 In comparison to conventional phosphors for cathode ray tubes (CRT), it is important to develop phosphors for display devices that show high efficiency and good stability at low-voltage electron excitation and high current density.5–9 Therefore, selection of suitable phosphors material is considered to be one of the most critical and urgent challenges in the lighting field. It is well known that besides from its luminescence applications, LaGaO3 perovskite have been promising material as an electrolyte for solid fuel cells.10,11 The lanthanum gallate (LaGaO3) crystal has an orthorhombically distorted centrosymmetric GdFeO3 type perovskite-like structure with space group Pbnm.12 Indeed, LaGaO3 is a relatively simple matrix, which consists three dimensional sub-lattice of corner connected GaO6 octahedra and the La3+ is in eight-fold coordination with oxygen ions, and is potentially act as a host material in phosphor applications. LaGaO3 doped with several rare earth (RE) ions (RE = Eu, Tb, Dy/Eu, Sm/Tb etc.) were extensively studied for their luminescence properties, color rendering properties and superior stability under electron bombardment.13–15 The luminescent properties of Bi3+ doped LaGaO3 were studied by B. Jacquier et al.16 reported that Bi3+ was a good activator of luminescence for lanthanide compounds having its transitions between the ground state 1S0 and the excited levels 3P1 and 1P1. Alok M. Srivastava et al.17 reported thermal quenching of Bi3+ luminescence in LaGaO3 and explained the energy transfer mechanism between Bi3+ ions to host lattice-quenching centers. Research reports also show that along with Eu2+, Ce3+; Bi3+ could be used as sensitizer ion to produce abundant and tunable emission colors including white via adjusting doped ion concentrations.18–22 Trivalent chromium (Cr3+) is widely used as a luminescent dopant in various materials. Chromium is a low-cost activator, which can provide deep red color and bright luminescence. On this account, Cr3+ is the subject of numerous optical spectroscopic, vivo imaging, energy saving and luminescence applications.23–26 Recently, significant efforts have been devoted by several research groups on the synthesis and characterization of various Cr3+ doped host materials.
Our present studies have paid more attention to investigate NIR photoluminescence of Cr3+ ions doped LaGaO3 phosphors and also including the enhancement in intensity of Cr3+ ions on co-doping with Bi3+ ions in detail. To the best of author's knowledge, no accurate information is available on the energy transfer (ET) mechanism and efficiency from Bi3+ to Cr3+ in LaGaO3 compound. From CIE color coordinates, it is demonstrated that, by carefully selecting Bi3+ and Cr3+ contents, the relative intensity of the different emissions can be changed producing an overall emission colour that can be tuned from blue to magenta.
Experimental details
Preparation of the nanoparticles
The LaGaO3 undoped, LaGaO3: (0.1, 0.5, 1, 2 at%) Bi3+, LaGaO3: (0.5, 1, 3, 5 at%) Cr3+ and LaGaO3: (1 at%) Bi3+, (0.5, 1, 3, 5 at%) Cr3+ phosphors were all prepared by the polyol mediated method. Stoichiometric amounts of La(NO3)3·6H2O (Sigma-Aldrich, 99.99%), Ga(NO3)3·H2O (Sigma-Aldrich, 99.99%), Bi(NO3)3·5H2O (Sigma-Aldrich, 99.99%), Cr(NO3)3·9H2O (Alfa Aesar 98.5%) are used as precursors. Ethylene glycol (MERCK, 99.99%) was used as a solvent and stabilizing ligand. For preparing the undoped lanthanum gallate (LaGaO3), initially stoichiometric amounts of La(NO3)3·6H2O and Ga(NO3)3·H2O was transferred into a two-necked RB flask containing solution of 20 ml ethylene glycol. The solution was kept under magnetic stirring and continuous heating. When the temperature was at 100 °C, around 2 gram urea was added and temperature was raised further to 120 °C and kept up at this temperature for 2 hours. The formed precipitate was cooled, centrifuged, washed thrice with methanol, twice with acetone and allowed to dry overnight at room temperature. Then the samples were sintered in a muffle furnace at a temperature of 1000 °C for 5 h. Finally, the samples are naturally cooled down to room temperature and fully ground for further investigations. The above procedure was repeated for the preparation of Cr and Bi/Cr, doped LaGaO3 samples by dissolving required amount of Cr(NO3)3·9H2O, and Bi(NO3)3·5H2O salts in ethylene glycol.
Characterization
X-ray diffraction (XRD) studies were carried out using a Philips powder X-ray diffractometer (model PW 1071) with Ni filtered Cu-Kα radiation. For calibration purpose, diffraction peak corresponding to the (111) plane of Si at a 2θ value of 28.442° was employed. The lattice parameters were obtained from refinement of the XRD patterns using POWDERX software. All steady-state luminescence and lifetime measurements were carried out at room temperature using an Edinburgh Instrument (FLSP 920 system) having a 450 W Xe lamp. A microsecond flash lamp and a nanosecond hydrogen flash lamp were used for lifetime measurements. All emission and excitation measurements were carried out with a resolution of 3 nm. Emission spectra were corrected for the detector response and excitation spectra for the lamp profile. The fundamental structural morphologies of the samples and the elemental composition investigation has been done by utilizing a field emission scanning electron microscope FE-SEM Supra 55 (Carl Zeiss, Germany). An accelerating voltage of 20 kV and magnification of 10k× was used for recording the micrographs.
Results & discussion
Phase formation and microstructure
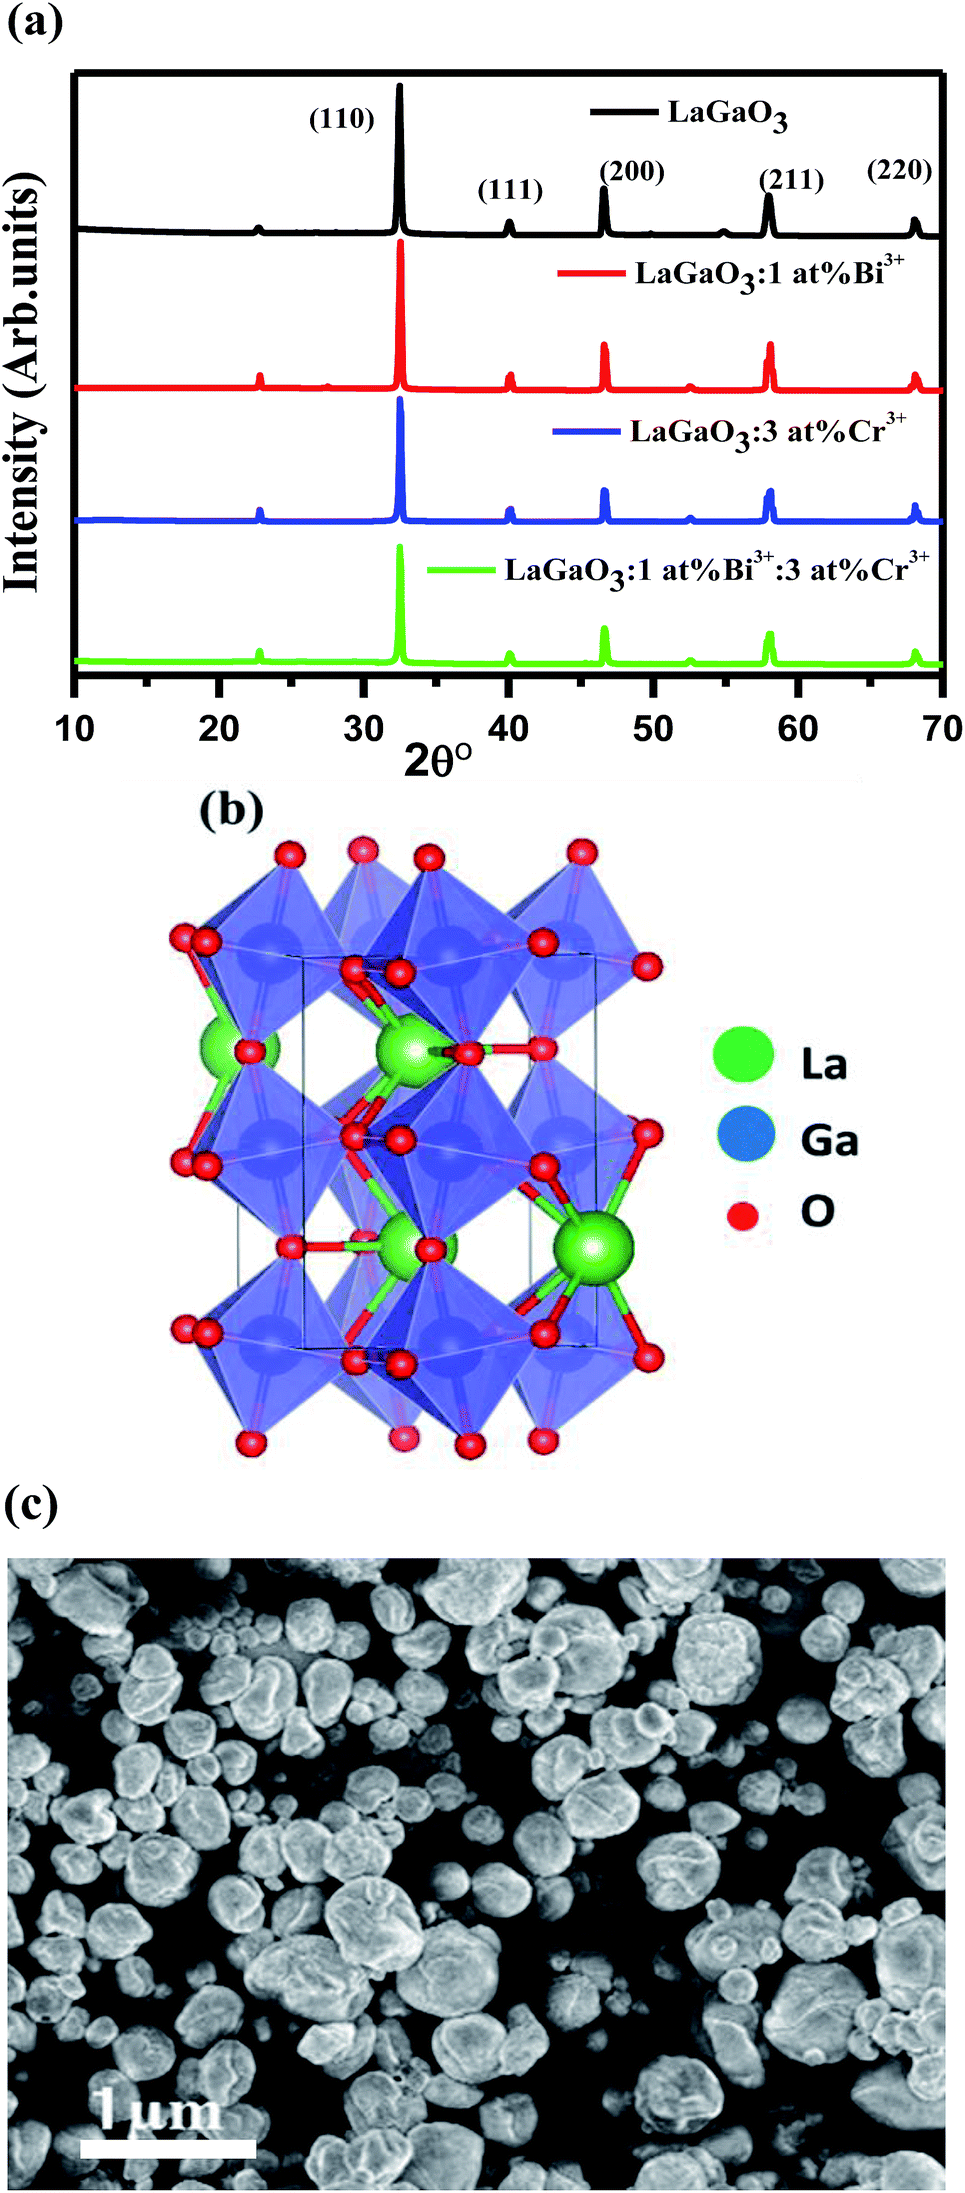
Fig. 1(a) shows the XRD patterns of undoped LaGaO3, LaGaO3: 1 at% Bi3+, LaGaO3: 3 at% Cr3+ and LaGaO3: 1 at% Bi3+, 3 at% Cr3+ phosphors. From Fig. 1(a), all the diffraction peaks are in good agreement with the reported orthorhombic phase of LaGaO3 (PCPDF89-7946)19 and no second phase was detected indicating that the Bi3+ and Cr3+ completely dissolved in the LaGaO3 host lattice. Table 1 shows lattice parameters and unit cell volume calculated from the peak position of XRD patterns from the undoped and doped LaGaO3 samples whereas average particle size where calculated from the peak width (i.e. FWHM) of the most intense peak (110) at 2θ = 32.49° from the XRD pattern using Scherrer's equation (D = 0.9λ/β![[thin space (1/6-em)]](https://www.rsc.org/images/entities/char_2009.gif) cosθ, where D is the average particle size, λ is the wavelength of X-rays and β is the corrected full width at half maximum (FWHM) of an observed peak). The average crystallite size (D) of pure LaGaO3, doped and co-doped LaGaO3 particles which are annealed at 1000 °C are estimated in the range of 70–80 nm. LaGaO3 structure shown in Fig. 1(b) consists of slightly distorted and tilted GaO6 octahedra are linked to each other by corner sharing to form three-dimension network and the La3+ is in eight-fold coordination with oxygen ions. The average bond length of Ga–O in GaO6 is 1.975 Å; while La3+ is 8-coordinated by O atoms with average bond length of 2.62 Å for La–O. The minor changes in lattice parameters of single doped Bi3+, Cr3+ and co-doped in LaGaO3 when compared with undoped LaGaO3 depends on ionic radii.22 The radius of Bi3+ (r = 1.03 Å, coordination number, CN = 6) is similar to that of La3+ (r = 1.16 Å, CN = 8), while the radius of Cr3+ (r = 0.61 Å, CN = 6) is comparable to that of Ga3+ (r = 0.47 Å, CN = 6),27 thus in Bi3+–Cr3+ co-doped LaGaO3, Bi3+ mostly likes to take La site and Cr3+ likes to take Ga site. SEM image of the selected LaGaO3: 1 at% Bi3+, 3 at% Cr3++ phosphor is presented in Fig. 1(c). It is clearly seen that the sample is composed of aggregated particles with size ranging from 60 to 90 nm. The approximate spherical morphology and particles size confirms that these phosphors can be used potentially in the future field emission display device applications.
cosθ, where D is the average particle size, λ is the wavelength of X-rays and β is the corrected full width at half maximum (FWHM) of an observed peak). The average crystallite size (D) of pure LaGaO3, doped and co-doped LaGaO3 particles which are annealed at 1000 °C are estimated in the range of 70–80 nm. LaGaO3 structure shown in Fig. 1(b) consists of slightly distorted and tilted GaO6 octahedra are linked to each other by corner sharing to form three-dimension network and the La3+ is in eight-fold coordination with oxygen ions. The average bond length of Ga–O in GaO6 is 1.975 Å; while La3+ is 8-coordinated by O atoms with average bond length of 2.62 Å for La–O. The minor changes in lattice parameters of single doped Bi3+, Cr3+ and co-doped in LaGaO3 when compared with undoped LaGaO3 depends on ionic radii.22 The radius of Bi3+ (r = 1.03 Å, coordination number, CN = 6) is similar to that of La3+ (r = 1.16 Å, CN = 8), while the radius of Cr3+ (r = 0.61 Å, CN = 6) is comparable to that of Ga3+ (r = 0.47 Å, CN = 6),27 thus in Bi3+–Cr3+ co-doped LaGaO3, Bi3+ mostly likes to take La site and Cr3+ likes to take Ga site. SEM image of the selected LaGaO3: 1 at% Bi3+, 3 at% Cr3++ phosphor is presented in Fig. 1(c). It is clearly seen that the sample is composed of aggregated particles with size ranging from 60 to 90 nm. The approximate spherical morphology and particles size confirms that these phosphors can be used potentially in the future field emission display device applications.
 |
| | Fig. 1 (a) XRD patterns of LaGaO3, LaGaO3: Bi3+, LaGaO3: Cr3+, LaGaO3: Bi3+, Cr3+ samples (b) 3D crystal structure of LaGaO3 and (c)FE-SEM image of LaGaO3: (1 at%) Bi3+, (3 at%) Cr3+ sample. | |
Table 1 Lattice parameters of LaGaO3, LaGaO3: 1 at% Bi3+, LaGaO3: 3 at% Cr3+ and LaGaO3: 1 at% Bi3+: 3 at% Cr3+ phosphors
| Compositions |
a (Å) |
b (Å) |
c (Å) |
V3 (Å) |
| LaGaO3 |
5.478 |
5.594 |
7.659 |
234.70 |
| LaGaO3: 1 at% Bi3+ |
5.468 |
5.552 |
7.691 |
233.48 |
| LaGaO3: 3 at% Cr3+ |
5.483 |
5.617 |
7.652 |
235.66 |
| LaGaO3: 1 at% Bi3+, 3 at% Cr3+ |
5.473 |
5.563 |
7.644 |
232.73 |
Photoluminescence and energy transfer (ET) mechanism of the samples
Excitation (inset) and emission spectra of host LaGaO3 at room temperature shown in Fig. 2, with excitation at 250 nm, host LaGaO3 gives a wide band from 300 to 600 nm with a maximum peak at 428 nm, which is attributed to the transition of self-activated optical center corresponding to groups in the host lattice GaO6.28 Monitored at 428 nm (inset), the corresponding excitation spectra in the range of 200–300 nm is observed with maximum peak position at 428 nm.
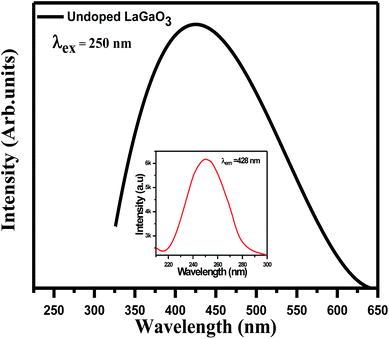 |
| | Fig. 2 Emission spectra and excitation (inset) of LaGaO3 phosphor. | |
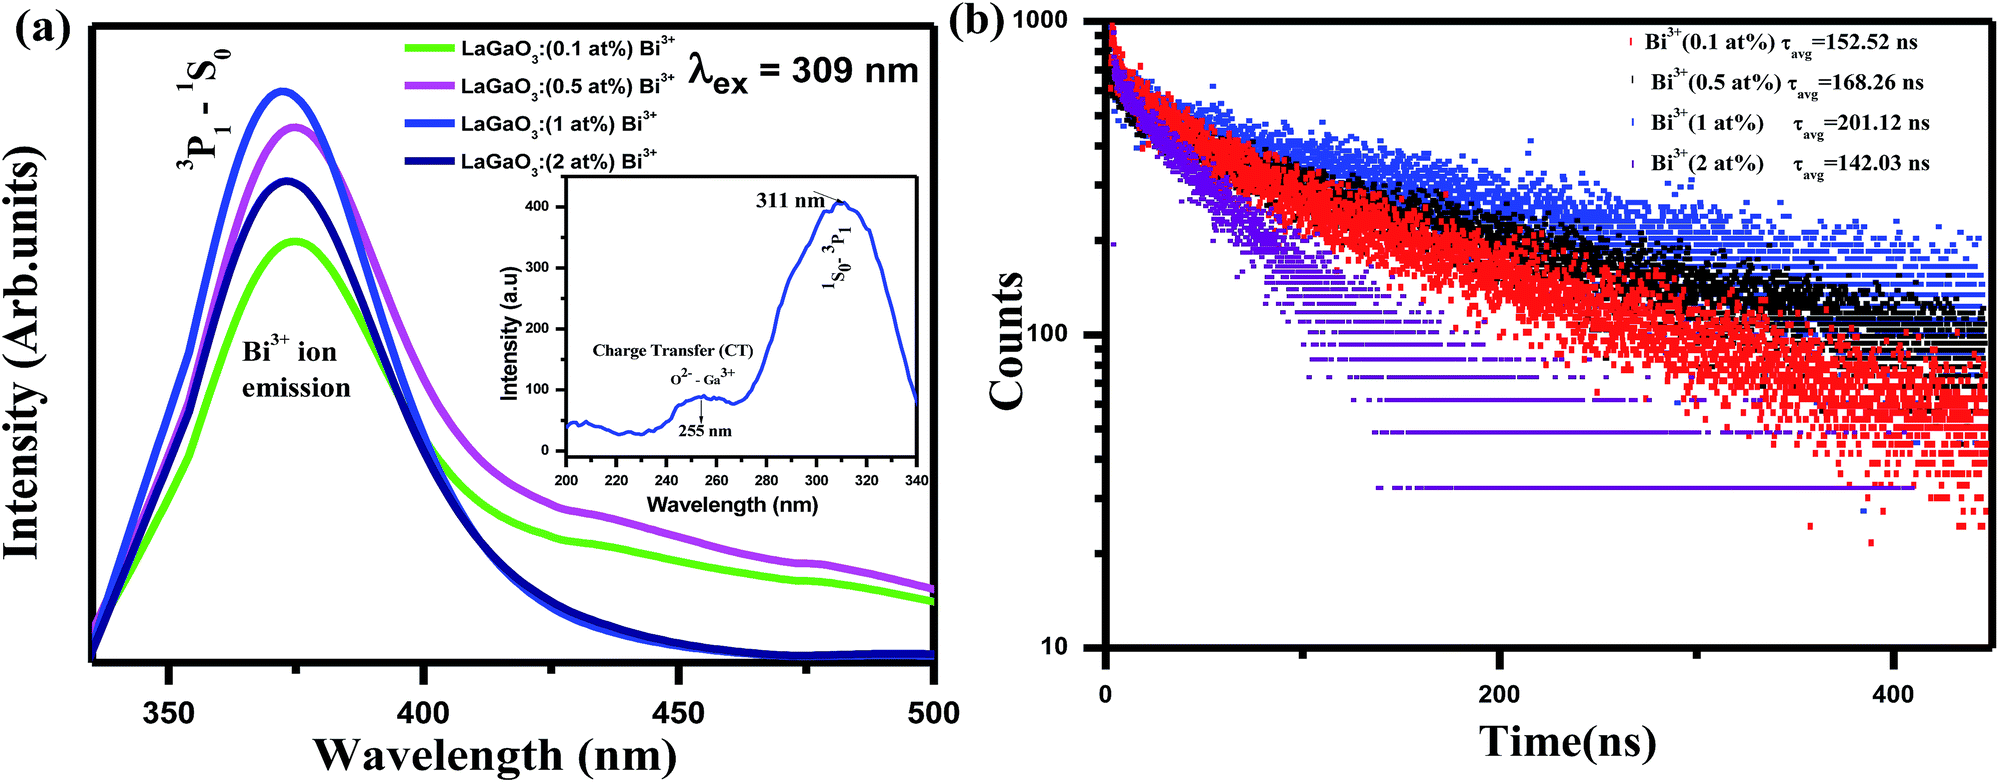
The excitation (inset) and emission spectra of a samples LaGaO3: (0.1, 0.5, 1, 2) at% Bi3+ is shown in Fig. 3(a), it is observed that the emission band centred at ∼374 nm which is attributed to 3P1–1S0 transition of Bi3+ ion on excitation with 309 nm.
 |
| | Fig. 3 (a) Emission spectra and excitation (inset) spectra of LaGaO3: Bi3+ phosphor (b) decay curve for LaGaO3: Bi3+ phosphor excited at 309 nm and monitored at 374 nm. | |
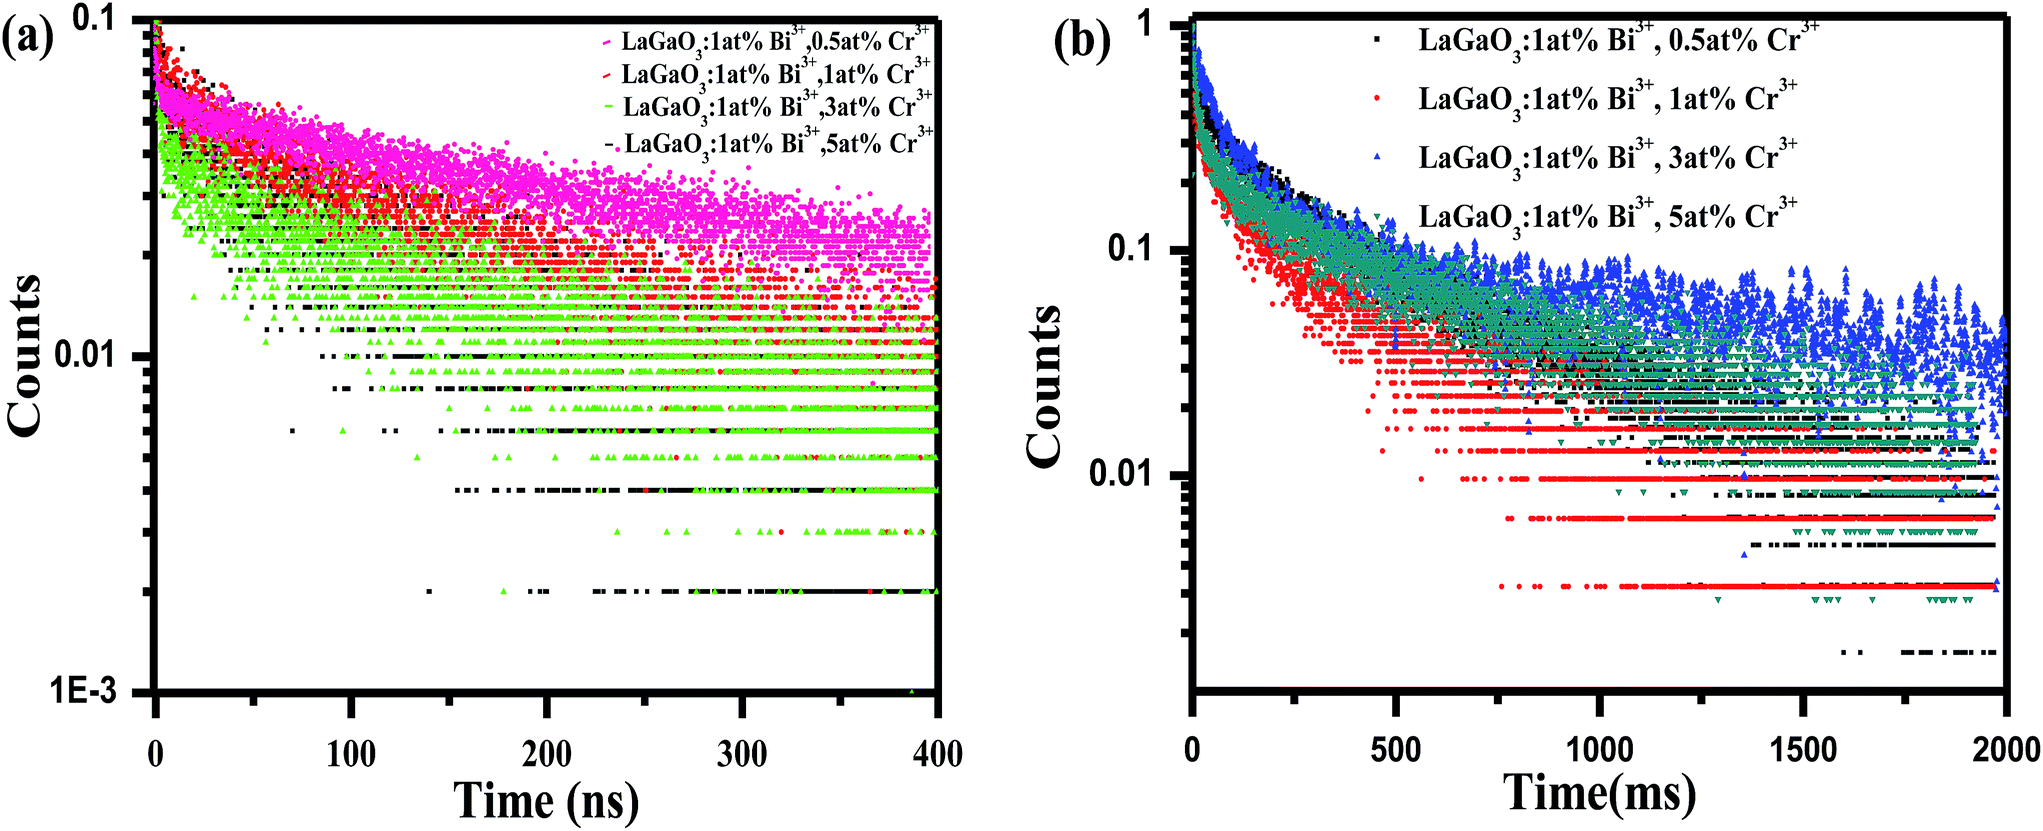
With increasing Bi3+ concentration, the intensity of the 374 nm emission band increases and reaches a maximum at 1 at% and decreases when Bi3+ content is further increased due to concentration quenching effect. Hence, multiphonon relaxation and the cross relaxation between neighboring Bi3+ ions, substantially quench the photoluminescence.29 Hence, the optimized Bi3+ content is at x = 1 at%. This is also confirmed from the corresponding bi-exponential lifetime decay values (152.52 ns, 168.26 ns, 201.12 ns, 142.03 ns) and curves of Bi3+ ions in LaGaO3 which is shown in Fig. 3(b)30 (procedure for calculation of decay values shown in preceding sections).
The excitation spectra shows weak band around 255 nm due to the charge transfer (CT) transition of 2p orbital of O2−to the empty 4s orbital of Ga3+ because the 3d orbital is completely filled31 and another is at 309 nm due to 1S0–3P1 electron transition of Bi3+ ion respectively. And overlapping of the absorption band of 1S0–1P1 state of Bi3+ ions and the (O–Ga) CT transition is also observed.16 Emission band of host LaGaO3 is found to overlap with excitation band of LaGaO3: 1 at% Bi3+ phosphor in the range of 275–350 nm, so, energy transfer (ET) between Bi3+ ion and GaO6 group may be formed shown in Fig. 1S.† In addition, it is worth to note that LaGaO3: 1 at% Bi3+ phosphor with excitation around 309 nm does not show host emission band assigned to Ga3+–O2− transition because the excited electrons in GaO6 group directly transfer the energy from the conduction band level of GaO6 to higher excited level of Bi3+ ion by energy transfer process.
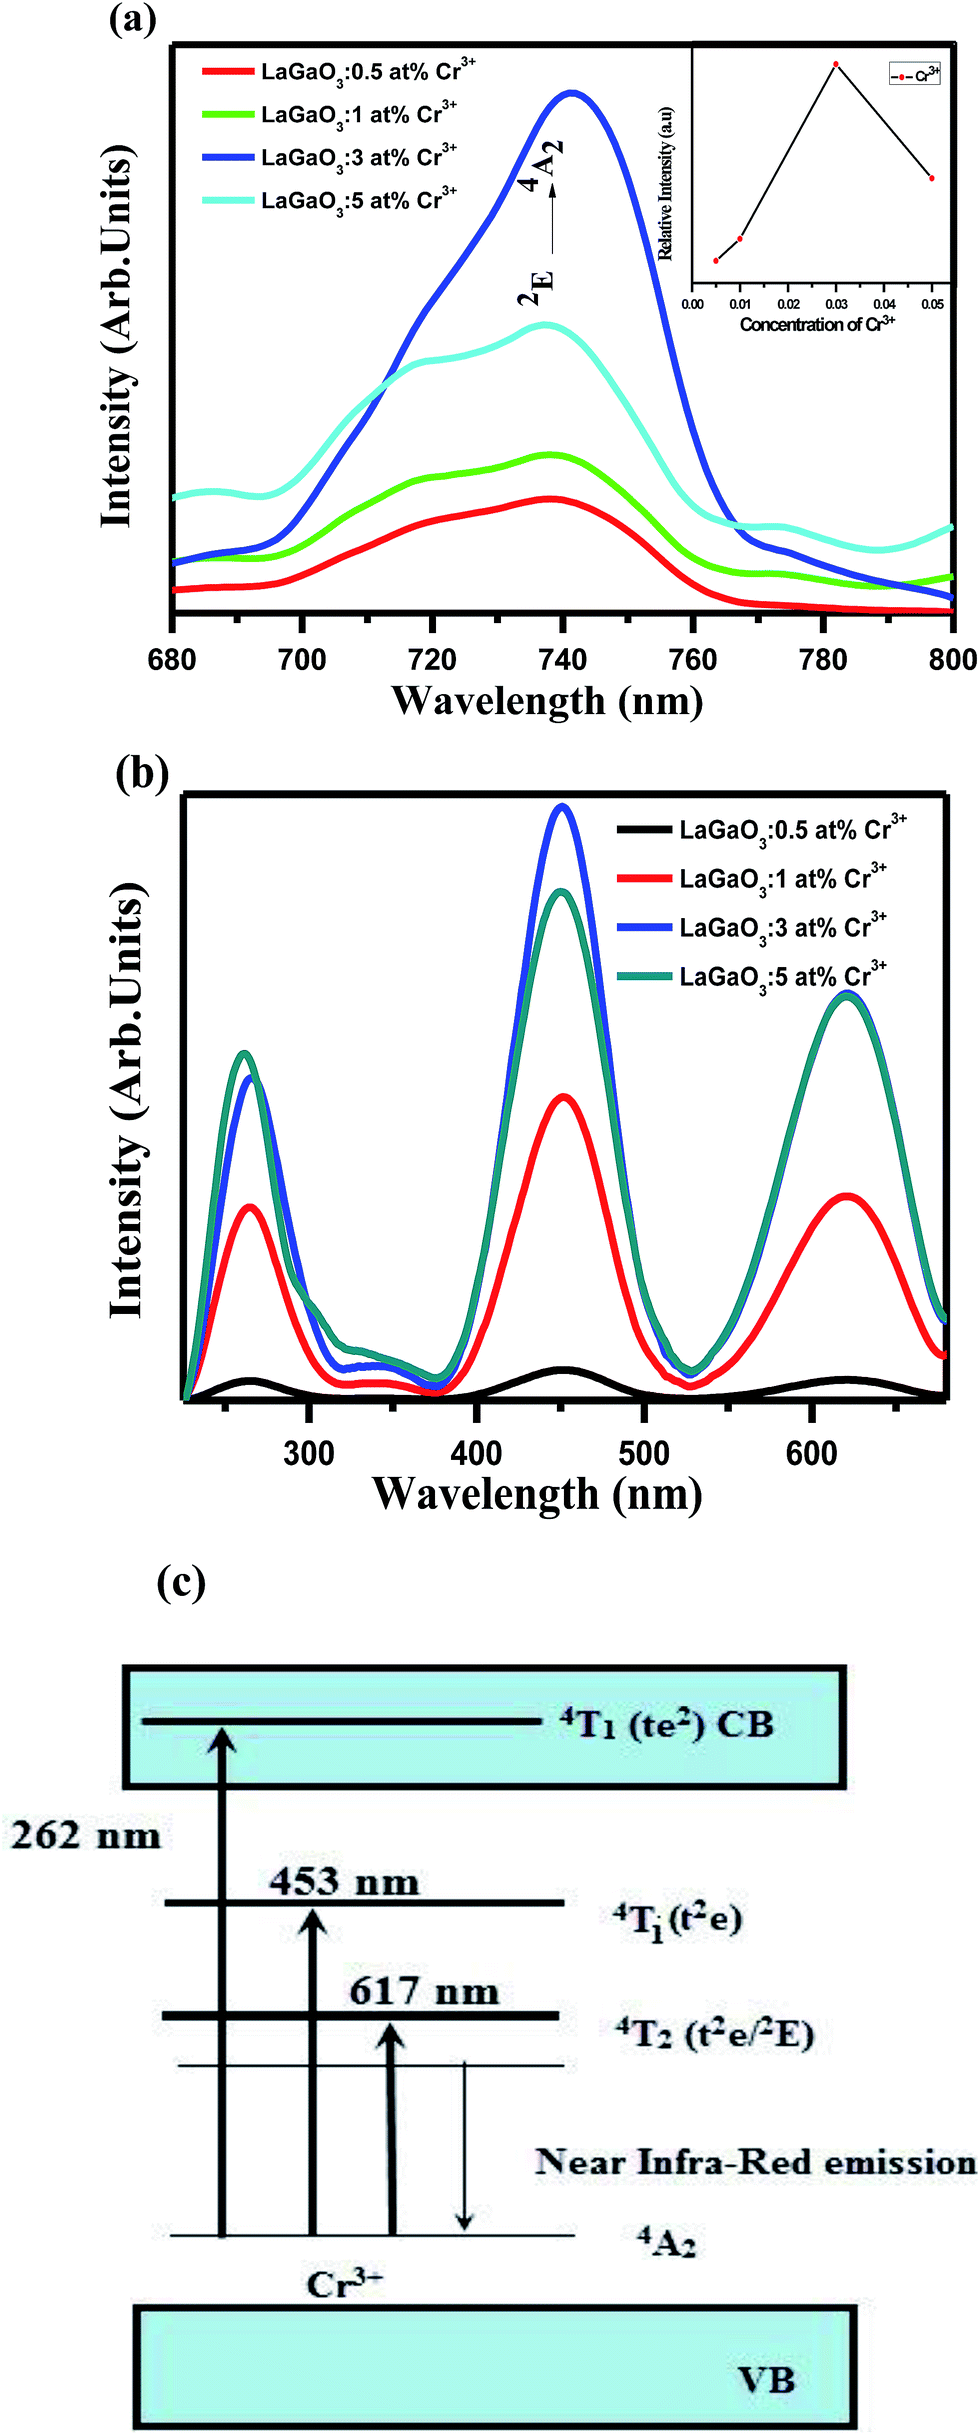
Fig. 4(a and b) shows the emission and excitation spectra of LaGaO3: (0.5, 1, 3, and 5 at%) Cr3+ phosphor. Under excitation at 453 nm, the sample exhibits a broadening 2E → 4A2 emission peaking at 740 nm ranging from ∼650 to 800 nm. The broadening of the 2E → 4A2 emission is possibly caused by the electron-phonon coupling in the host lattice. The excitation spectrum shown in Fig. 4(b) monitored at 740 nm covers a very broad spectra ranging from 200 to 700 nm and consists of three excitation bands originating from the d–d inner transitions of Cr3+, i.e., 262 nm band originating from the 4A2 → 4T1 (te2) transition, the 453 nm band originating from the 4A2 → 4T1 (t2e) transition and the 617 nm band originating from the 4A2 → 4T2 (t2e/2E) transition.32,33 In addition to this, (Fig. 4(a) inset) shows the variation in the Cr3+ concentration-dependent PL intensities, and the optimum doping concentration was found at y = 3 at%.
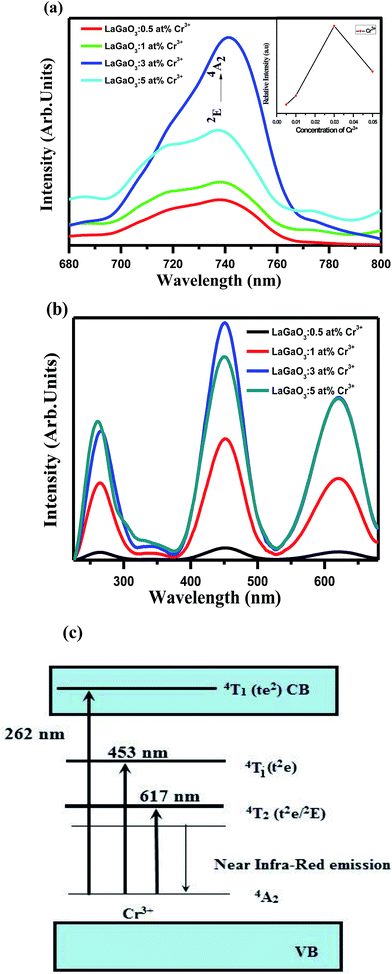 |
| | Fig. 4 (a) Emission spectra (inset: PL intensity dependence on Cr3+ content) (b) excitation spectra of LaGaO3: Cr3+ phosphor excited at 453 nm and monitored at 740 nm. (c) Schematic diagram of the photoluminescence showing the excitation, electron transitions of Cr3+ in LaGaO3: Cr3+ phosphor. | |
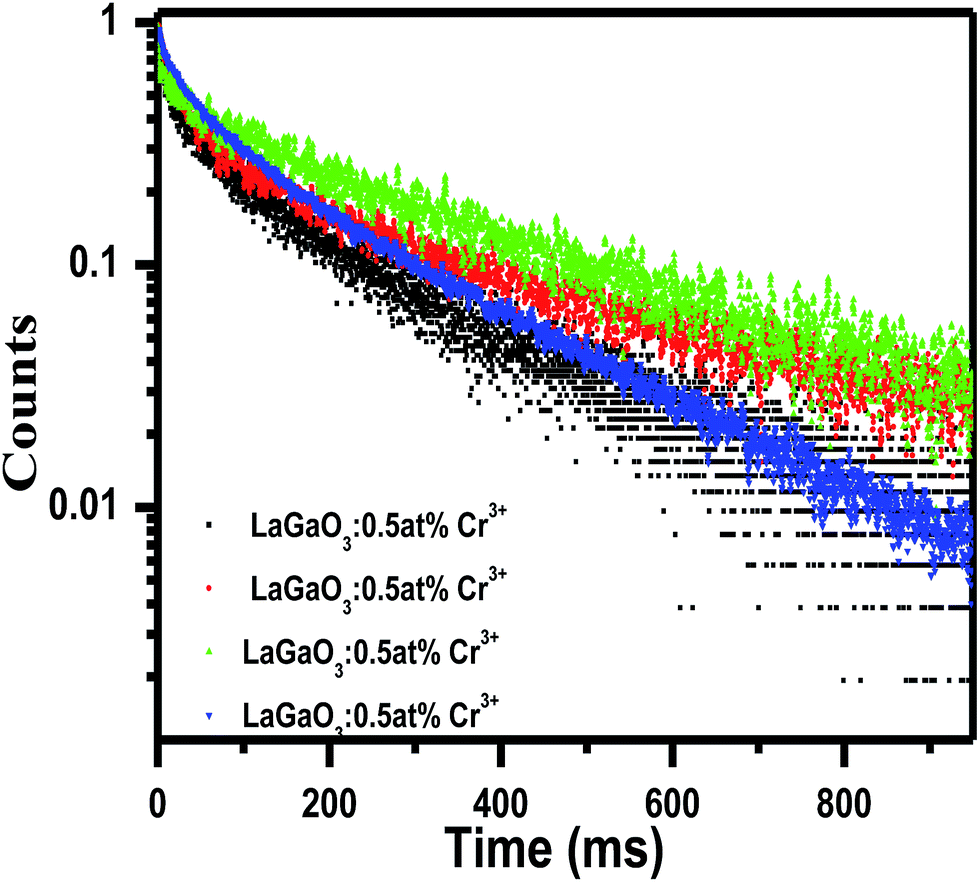
After that, the PL intensity begins to reduce owing to the concentration quenching effect of Cr3+ ions. Furthermore, a schematic diagram of the related energy levels for LaGaO3: Cr3+ phosphors is depicted in energy level diagram Fig. 4(c). As for the photoluminescence process, under light excitation corresponding to different wavelength, such as 261 nm, the ground-state electrons of Cr3+ ions are promoted to the 4T1 (te2) level. The excited electrons will relax to the 2E energy level, and shows the near Infra-Red emission via the 2E → 4A2 transition. The corresponding bi-exponential average lifetime decay values and curves of Cr3+ ions (1.48 ms, 3.26 ms, 3.91 ms, 2.14 ms) in LaGaO3 which is shown in Fig. 5. The efficient ET needs to have a significant spectral overlap between the emission bands of undoped and Bi3+ doped LaGaO3, Fig. 2S† to excitation bands of LaGaO3: 3 at % Cr3+ nanophosphor, in the range of 250–800 nm. Thus it can be speculated that in the co-doped LaGaO3, the energy transfer from GaO6 to Cr3+ and Bi3+ to Cr3+ may occur.
 |
| | Fig. 5 Average Life time decay curve and values for LaGaO3: Cr3+ phosphor excited at 453 nm and monitored at 740 nm. | |
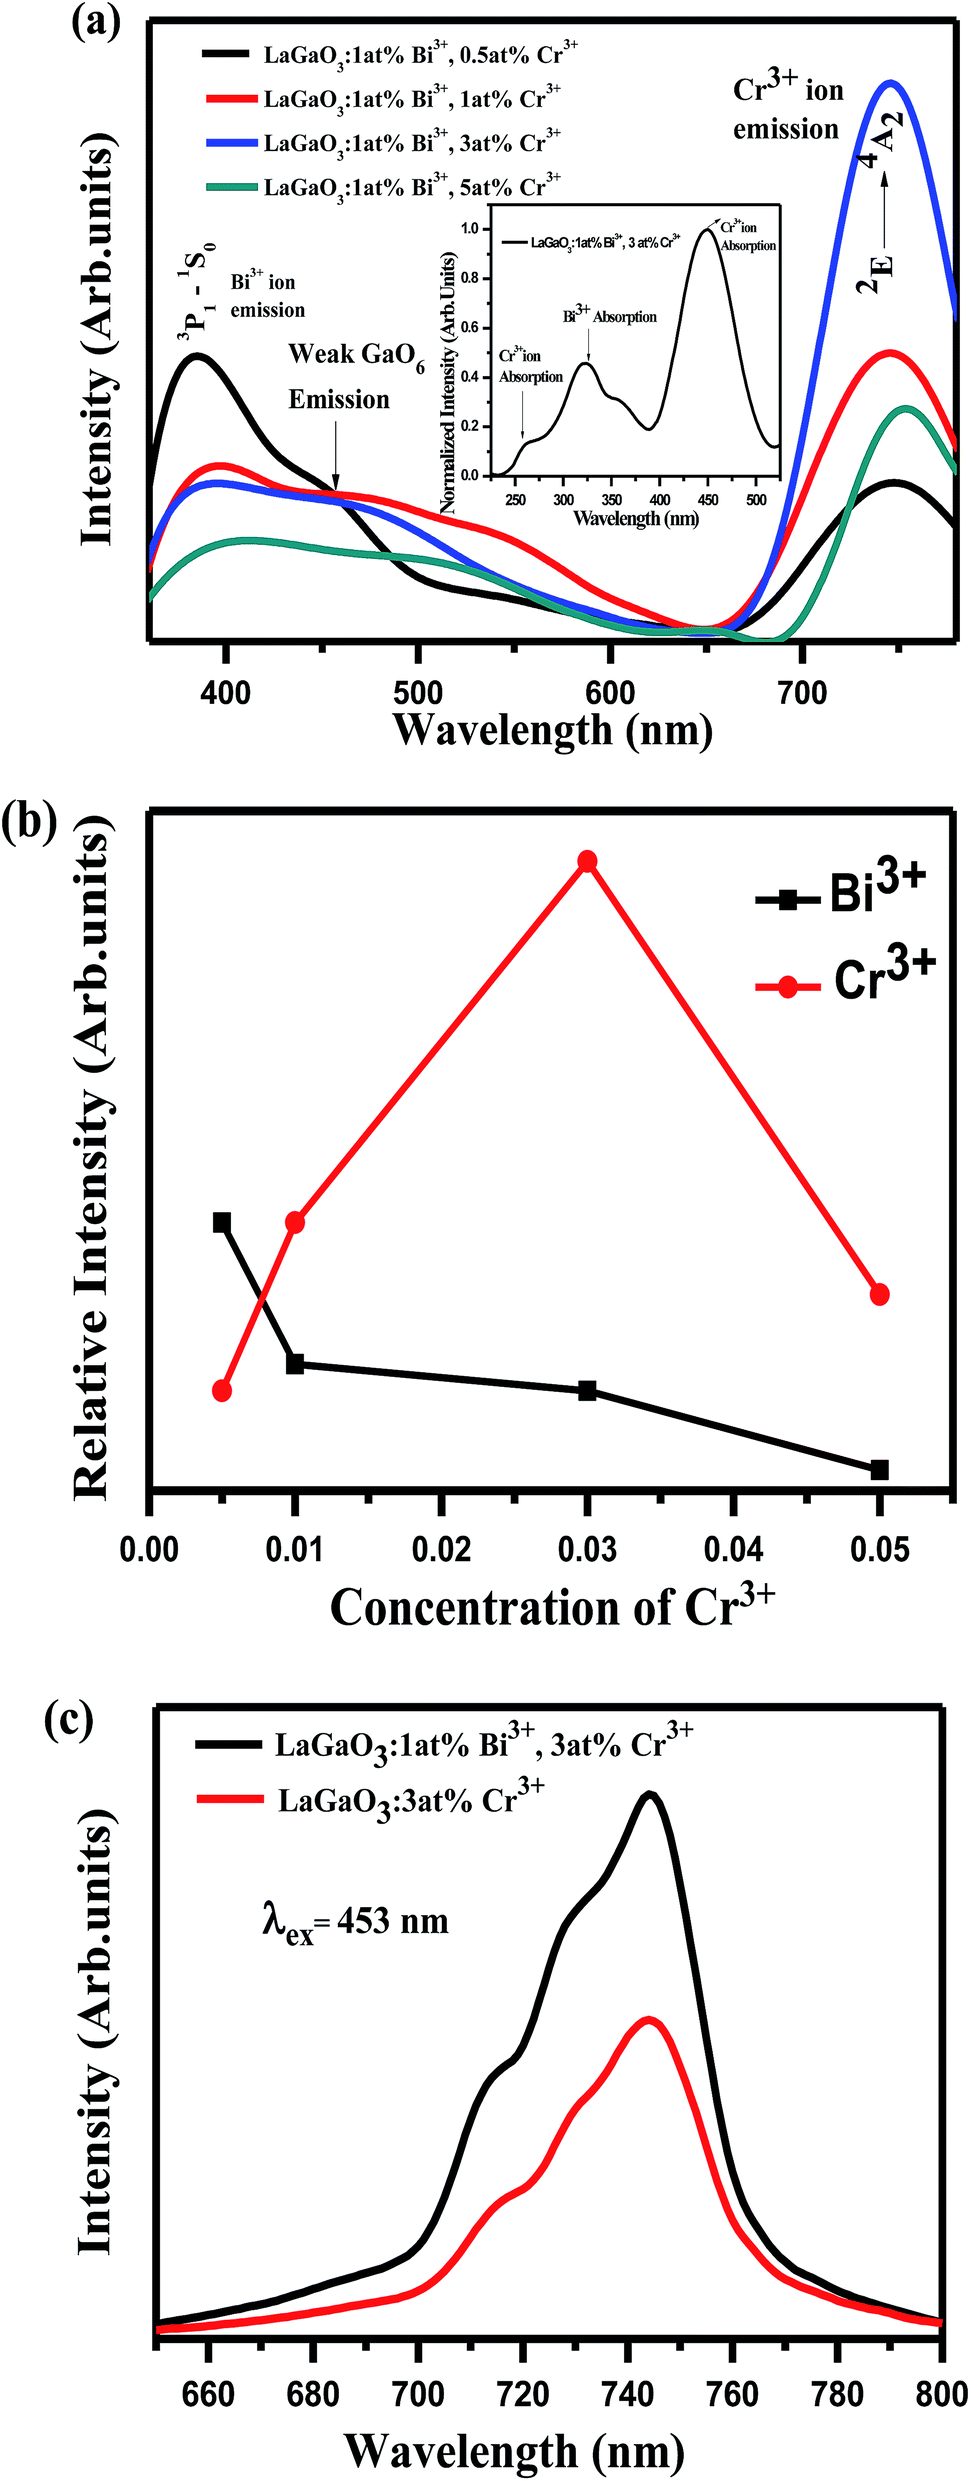
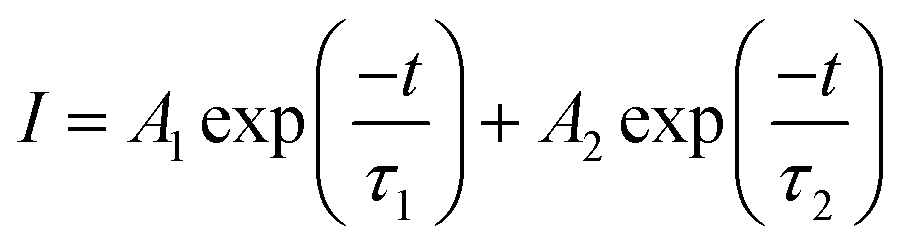
In Fig. 6(a), it is observed that the emission spectrum of LaGaO3: 1 at% Bi3+, (0.5, 1, 3, 5 at%) Cr3+ contains both Bi3+ emission and Cr3+ emission when excited at 309 nm. When Bi3+ concentration was fixed at 1 at%, and varying the Cr3+ concentration, the emission intensity of Cr3+ reaches maximum upto 3 at% and then notably decrease of Cr3+ emissions is observed on increasing further concentration, which can be rationalized as concentration quenching. From the excitation spectra (inset) (monitored at 740 nm) Fig. 6(a), broad band ranging from (200–400 nm) peak maximum at ∼309 nm is observed which is due to Bi3+ ion absorption and peaks around (weak) ∼260 nm, (broad) ∼453 nm are due to d–d transitions of Cr3+ ions. Meanwhile, Bi3+ emission decreases gradually, and this phenomenon ascribed to energy transfer happened between Bi3+–Cr3+ in this system. The relative emission intensities of Cr3+ ions at 740 nm and Bi3+ ions at 374 nm as a function of Cr3+ concentration were shown in Fig. 6(b). In addition it is observed that on excitation with 309 nm along with Bi3+, Cr3+ characteristic emissions there is weak host emission around ∼450 nm which is due to GaO6 transitions, which is overlapped with Bi3+ ion emission as shown in (Fig. 6(a)). Since the emission band of the LaGaO3 host overlaps with the excitation band of Bi3+, Cr3+ ions, the excited electron gets transfer their energy from GaO6 group directly to Cr3+ and Bi3+ ions. Later, the excited electrons in Bi3+ ion then relaxes where some part of energy has been released in the form of 374 nm light and the other part was contributed by the energy transfer process from Bi3+ to the Cr3+.
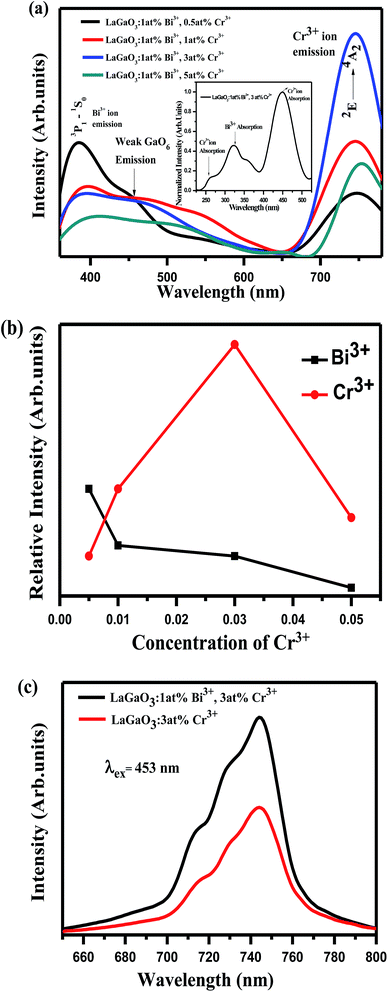 |
| | Fig. 6 (a) Emission and excitation (inset) spectra of LaGaO3: 1 at% Bi3+, 3 at% Cr3+ phosphor (b) intensity variation of Bi3+ as a function of Cr3+ concentration (c) intensity enhancement of Cr3+ ions on Bi3+ co-doping via energy transfer between Bi3+–Cr3+. | |
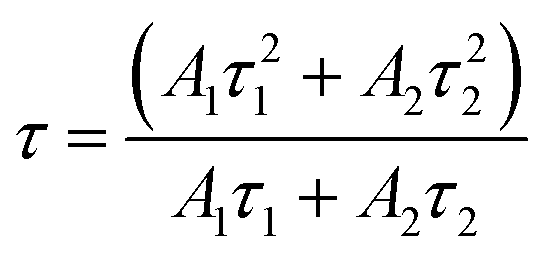
At the same time, we also illustrated the emission profiles (λex = 453 nm) of Cr3+ ion with and without Bi3+ ion presence in host for verifying the intensity enhancement in Cr3+ emissions due to Bi3+–Cr3+ energy transfer shown in Fig. 6(c). The energy transfer from Bi3+ to Cr3+, results in the improvement of Cr3+ emission, which is also strongly supported by the decrease in the decay behaviour of the Bi3+ emission in co-doped samples.
Decay curves of Bi3+ with various Cr3+ content for the system LaGaO3: 1 at% Bi3+, (0.5, 1, 3, 5 at%) Cr3+ are illustrated in Fig. 7(a and b). The decay curves were well fitted with a double-exponential rule according to the following equation:
| |
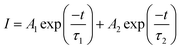 | (1) |
where,
I is the luminescence intensity at the time
t,
τ1 and
τ2 are two components of the decay time,
A1 and
A2 are constants. According to these parameters, the average decay times of LaGaO
3: 1 at% Bi
3+, (0.5, 1, 3, 5 at%) Cr
3+ nanophosphors can be calculated according to the following formula:
34| |
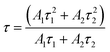 | (2) |
 |
| | Fig. 7 (a) Decay curve for Bi3+ ions in LaGaO3: 1 at% Bi3+, (0.5, 1,3,5 at%) Cr3+ phosphor excited at 309 nm and monitored at 374 nm (b) decay curve for Cr3+ ions in LaGaO3: 1 at% Bi3+, (0.5, 1,3,5 at%) Cr3+ phosphor excited at 309 nm and monitored at 740 nm. | |
Decay times (τ) of Bi3+ calculated are about 180.12, 153.25, 127.21 and 90.72 ns for Fig. 7(a) LaGaO3: Bi3+ (1 at%), (0.5, 1, 3, 5 at%) Cr3+ and corresponding to decay times of 2.27, 3.75, 5.48 and 2.55 ms respectively for varying contents of Cr3+ Fig. 7(b).
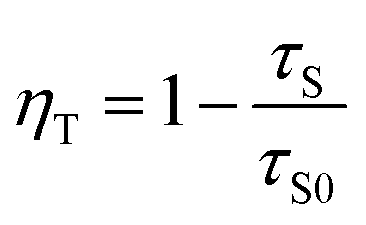
The increase of Cr3+ content leads to faster decay of Bi3+ emission, which is attributed to ET from Bi3+ to Cr3+. The ET efficiency ηT of Bi3+–Cr3+ can be calculated using the following equation35
| |
 | (3) |
where
τS and
τS0 represent the lifetime values of sensitizer Bi
3+ in the presence and absence of Cr
3+. The energy-transfer efficiency
ηT values from Bi
3+ to Cr
3+ for LaGaO
3 are tabulated in
Table 2. With increasing Cr
3+ doping concentrations, the energy-transfer efficiency
ηT reaches approximately 55%, indicating that the ET from Bi
3+ to Cr
3+ is efficient (
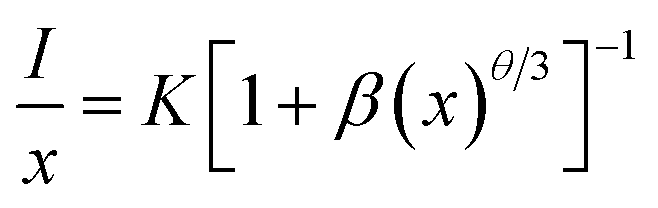
Table 2). However, it is well-know that the impurities can affect the luminescence properties, but it has the minute influence. Therefore, the interaction type between sensitizers or between sensitizer and activator can be calculated by the following equation
36| |
 | (4) |
where
x is the concentration of the activator ions (Bi
3+ and Cr
3+ ions),
I is the emission intensity,
K and
β are constants for the same excitation condition for a given host lattice, and
θ is a function of multipole–multipole interaction. When the value of
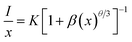
θ is 6, 8, or 10, the interaction types correspond to dipole–dipole (d–d), dipole–quadrupole (d–q), and quadrupole– quadrupole (q–q) interactions, respectively. The dependence of log(
I/
x) on log(
x) was found to be relatively linear, and it yields a straight line with a slope equal to
θ/3, so we can obtain the
θ value to study the energy-transfer process between Bi
3+ and Cr
3+ in LaGaO
3 host. As shown in
Fig. 8 the slope of the straight line is −
θ/3 = −1.72 based on the PL data of this series of LaGaO
3: 1 at% Bi
3+, (0.5, 1, 3, 5 at%) Cr
3+ samples. The calculated value of
θ is 5.16, which is close to six, meaning that the dipole–dipole interaction is the dominant mechanism for the interaction of Bi
3+ and Cr
3+ in the LaGaO
3 phosphors.
Table 2 Energy transfer efficiency (ηT) of the LaGaO3: 1 at% Bi3+, 3 at% Cr3+ phosphor
| Concentration (x) |
η (%) |
| 0.5 |
11 |
| 1 |
24 |
| 3 |
37 |
| 5 |
55 |
 |
| | Fig. 8 The fitting line of log (I/x) vs. log(x) in LaGaO3: 1 at% Bi3+, 3 at% Cr3+ phosphors beyond the quenching concentration. | |
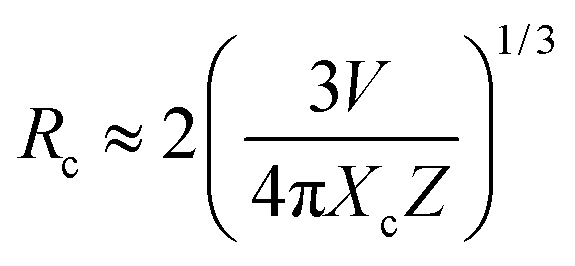
Moreover, the critical distance of Bi3+ and Cr3+ is also an essential parameter if we consider the concentration quenching effect in this system. We can approximately estimate the critical distance from the report of Blasse, the critical distance (Rc) can be calculated as follows36
| |
 | (5) |
where
V is the volume of the unit cell,
Z represents the number of the activator ions in the unit cell,
Xc is about 0.04 from the total concentration of Cr
3+ (the concentration of 0.03) and Bi
3+ (the concentration of 0.01). For the LaGaO
3 host, the crystallographic parameters are (
V = 244.77 Å,
Z = 2). The
Rc critical transfer distance is determined to be 11.34 Å. This value is much longer than 5 Å, indicating the possibility of energy transfer
via the multipolar interaction mechanism,
viz, dipole–dipole interaction as mentioned above.
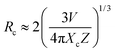
It is worthwhile to notice that the emission band of Bi3+ ions is in blue region and the emission band of Cr3+ ions is in red region. Combining both of them, magenta light emission may be achieved. Therefore, the luminescent colors of LaGaO3: Bi3+ (1 at%), (0.5, 1, 3, 5 at%) Cr3+ phosphors excited by 311 nm are characterized by Commission International de I'Eclairage (CIE) chromaticity diagram and shown in Fig. 9. The Bi3+, Cr3+ co-doped samples generates the color tunability from blue to magenta due to an efficient energy transfer from Bi3+ to Cr3+. The CIE chromaticity coordinate of LaGaO3: Bi3+ 1 at%, 3 at% Cr3+ sample is calculated to be (0.45, 0.24), i.e. magenta color is obtained from LaGaO3: Bi3+ 1 at%, 3 at% Cr3+ sample. The results indicate that Bi3+, Cr3+ co-doped phosphors may find potential application in field emission display applications.
 |
| | Fig. 9 CIE chromaticity diagram. | |
Conclusions
In this study, Bi3+ and Cr3+ co-doped LaGaO3 phosphors were prepared by chemical route. XRD proved the orthorhombic phase of LaGaO3: Bi3+, Cr3+ phosphors annealed at 1000 °C. The recorded FE-SEM micrograph showed that LaGaO3: Bi3+, Cr3+ phosphors were composed of agglomerated and spherical shaped particles. The photoluminescence properties, life time studies and energy transfer process were investigated in detail. The energy transfer from Bi3+ to Cr3+ was clearly observed and the maximum efficiency found to be 55% from lifetime values. Furthermore, the CIE diagram showed that the colors can be tuned from blue to magenta, indicating that the developed phosphor may potentially be used as a single phase phosphor for field emission display devices.
Conflicts of interest
There are no conflicts to declare.
Acknowledgements
The authors are grateful to Dr Sudarsan, Scientist-G, Bhabha Atomic Research Centre (BARC) for PL studies and Dr R. David Kumar, Principal, Government College (A), Rajamahendravaram, Andhra Pradesh for necessary lab facilities. One of the author Dr K. R. Rao gratefully acknowledge DAE-BRNS Project No: 2013/34/22/BRNS/10250 for providing the financial support.
Notes and references
- H. A. Hoppe, Angew. Chem., Int. Ed., 2009, 48, 3572–3582 CrossRef PubMed.
- I. Shah, Phys. World, 1997, 10, 45–48 CrossRef CAS.
- B. Chalamala, Y. Wei and B. Gnade, IEEE Spectrum, 1998, 35, 42–51 CrossRef.
- R. Waser, Nanoelectronics and Information Technology, Wiley-Vch, Weinheim, Germany, 2003, ch. 39 Search PubMed.
- C. E. Hunt and A. G. Chakhovskoi, J. Vac. Sci. Technol., B: Microelectron. Nanometer Struct.–Process., Meas., Phenom., 1997, 15, 516 CrossRef CAS.
- G. Li and J. Lin, Chem. Soc. Rev., 2014, 43, 7099 RSC.
- S. S. Pitale, V. Kumar, I. M. Nagpure, O. M. Ntwaeaborwa, E. Coetsee and H. C. Swart, J. Appl. Phys., 2011, 109, 013105 CrossRef.
- X. Liu, L. Yan and J. Lin, J. Electrochem. Soc., 2009, 156(1), 1 CrossRef.
- S. H. Cho, S. H. Kwon, J. S. Yoo, C. W. Oh, J. D. Lee, K. J. Hong and S. J. Kwon, J. Electrochem. Soc., 2000, 147, 3143 CrossRef CAS.
- M. I. Martinez-Rubio, T. G. Ireland, G. R. Fern, J. Silver and M. J. Snowden, Langmuir, 2001, 17, 7145 CrossRef CAS.
- G. Wakefield, E. Holland, P. J. Dobson and J. L. Hutchison, Adv. Mater., 2001, 13, 1557 CrossRef CAS.
- M. Marti, P. Fisher, F. Altorfer, H. J. Sheel and M. Tadin, J. Phys.: Condens. Matter, 1994, 6, 127 CrossRef.
- D. Lybye, F. W. Poulsen and M. Mogensen, Solid State Ionics, 2000, 128, 91–103 CrossRef CAS.
- X. Liu and J. Lin, J. Mater. Chem., 2008, 18, 221–228 RSC.
- X. Liu, R. Pang, Z. Quan, J. Yang and J. Lin, J. Electrochem. Soc., 2007, 154(7), J185–J189 CrossRef CAS.
- B. Jacquier, G. Boulon, G. Sallavuard and F. Gaume Mahn, J. Solid State Chem., 1972, 4, 374–378 CrossRef CAS.
- A. M. Srivastava, Mater. Res. Bull., 1999, 34(9), 1391–1396 CrossRef CAS.
- T. Samuel, C. Satya Kamal, K. Sujatha, V. Veeraiah, Y. Ramakrishana and K. Ramachandra Rao, Optik, 2016, 127, 10575–10587 CrossRef CAS.
- T. Samuel, C. Satya Kamal, S. Ravipati, B. P. Ajayi, V. Veeraiah, V. Sudarsan and K. Ramachandra Rao, Opt. Mater., 2017, 69, 230–237 CrossRef CAS.
- P. Ma, Y. Song, B. Yuan, Y. Sheng, C. Xu, H. Zou and K. Zheng, Ceram. Int., 2017, 43, 60–70 CrossRef CAS.
- J. Y. Park, H. C. Jung, G. S. R. Raju, B. Kee Moon, J. Hyun Jeong, S. M. Son and J. Hwan Kim, Mater. Res. Bull., 2010, 45, 572–575 CrossRef CAS.
- C. S. Kamal, T. K. Visweswara Rao, P. V. S. S. S. N. Reddy, K. Sujatha, B. P. Ajayi, J. B. Jasinski and K. Ramachandra Rao, RSC Adv., 2017, 7, 9724 RSC.
- Y. Katayama, H. Kobayashi and S. Tanabe, Appl. Phys. Express, 2015, 8, 012102 CrossRef.
- V. A. Trepakov, Z. Potucek, M. V. Makarova, A. Dejneka, P. Sazama, L. Jastrabik and Z. Bryknar, J. Phys.: Condens. Matter, 2009, 21, 375303–375308 CrossRef CAS PubMed.
- V. Singh, G. Sivaramaiah, J. L. Rao and S. H. Kim, Mater. Res. Bull., 2014, 60, 397–400 CrossRef CAS.
- Z. Han, X. Li, J. Ye, L. Kang, Y. Chen, J. Li and Z. Lin, J. Am. Ceram. Soc., 2015, 98(8), 2336–2339 CrossRef CAS.
- R. D. Shannon, Acta Crystallogr., Sect. A: Cryst. Phys., Diffr., Theor. Gen. Crystallogr., 1976, 32, 751–767 CrossRef.
- N. V. Chezhina, E. V. Bodritskaya, N. A. Zhuk, V. V. Bannikov, I. R. Shein and A. L. Ivanovskii, Phys. Solid State, 2008, 50, 2121–2126 CrossRef CAS.
- M. C. Wang, H. J. Lin and T. S. Yang, J. Alloys Compd., 2009, 473, 394–400 CrossRef CAS.
- G. Blasse and A. Bril, J. Inorg. Nucl. Chem., 1967, 29, 266 CrossRef CAS.
- G. Blasse and B. C. Grabmaier, Luminescent materials, Springer-Verlag, Berlin, 1994 Search PubMed.
- P. D. Rack, J. J. Peterson, M. D. Potter and W. Park, J. Mater. Res., 2001, 16, 1429–1433 CrossRef CAS.
- M. Grinberg, Opt. Mater., 2002, 9, 37–45 CrossRef.
- C. H. Huang, T. W. Kuo and T. M. Chen, ACS Appl. Mater. Interfaces, 2010, 2, 1395 CAS.
- W. H. Di, X. J. Wang, P. F. Zhu and B. J. Chen, J. Solid State Chem., 2007, 180, 467 CrossRef CAS.
- G. Blasse, Phys. Lett. A, 1968, 28(42), 444–445 CrossRef CAS.
Footnote |
| † Electronic supplementary information (ESI) available. See DOI: 10.1039/c7ra08864g |
|
| This journal is © The Royal Society of Chemistry 2017 |
Click here to see how this site uses Cookies. View our privacy policy here. 
 Open Access Article
 This Open Access Article is licensed under a
  *ac
*ac