 Open Access Article
Creative Commons Attribution 3.0 Unported Licence
Retracted Article: Metabolomics reveals that PPARα activation protects against lithocholic acid-induced liver injury†
Qi Zhao‡
ab,
Rui Yang‡ab,
Fang Liua,
Jing Wanga,
Dan-Dan Huac,
Xiu-Wei Yangd and
Fei Li *a
*a
aState Key Laboratory of Phytochemistry and Plant Resources in West China, Kunming Institute of Botany, Chinese Academy of Sciences, Kunming 650201, China. E-mail: lifeib@mail.kib.ac.cn; Tel: +86-871-65216953
bUniversity of Chinese Academy of Sciences, Beijing 100049, China
cSchool of Pharmaceutical Science, Yunnan Key Laboratory of Pharmacology of Natural Products, Kunming Medical University, Kunming 650500, China
dSchool of Pharmaceutical Sciences, Peking University Health Science Center, Peking University, Beijing 100191, China
First published on 26th October 2017
Abstract
Some studies have reported that the activation of peroxisome proliferator-activated receptor alpha (PPARα) could protect against liver injury-induced by chemicals. In the present study, ultra-performance liquid chromatography coupled with electrospray ionization quadrupole mass spectrometry (UPLC-ESI-QTOFMS)-based metabolomics revealed the protective effects of PPARα activation by fenofibrate on LCA-induced liver injury, which recovered metabolic disorder of bile acids in the enterohepatic system. Fenofibrate treatment significantly promoted the biosynthesis of phospholipids via the upregulation of expression levels of phospholipase A2 g6, g7, and g12b (Pla2 g6, g7, and g12b) in liver, contributing to the decrease in hepatic transforming growth factor beta (TGF-β) that regulates phospholipid homeostasis during liver injury. More importantly, the activation of PPARα by fenofibrate treatment protected against the enhanced expressions of the nuclear factor-kappa B (NF-κB) target genes, such as chemokine (C–C motif) ligand 2 (Ccl2) and secreted phosphoprotein 1 (Spp1). Its upstream factors related to NF-κB activation were also decreased by fenofibrate, including inflammasome, toll-like receptor (TLR), reactive oxygen species (ROS), and endoplasmic reticulum (ER) stress. Taken together, the current study demonstrated that PPARα activation could show a protective effect against LCA-induced liver injury using a metabolomics approach.
Introduction
Lithocholic acid (LCA) is one of the chemicals with the most potential of causing liver toxicity. Mice fed with LCA led to development of partial bile duct obstruction.1,2 Previous study has found that fenofibrate, a peroxisome proliferator-activated receptor α (PPARα) agonist, can reduce serum LCA (18.4%), glycolithocholic acid (GLCA) (7.8%), and LCA-sulfate (LCA-S) (23.1%) levels in non-cholestatic volunteers.3 Furthermore, activation of PPARα signaling promotes detoxification of LCA by activating UDP glucuronosyltransferase family 1 member A3 (UGT1A3).4,5 Fenofibrate has also been demonstrated to protect against varieties of hepatic toxicities, such as non-alcoholic fatty liver6 and concanavalin A-induced hepatitis.7 These data indicated that the activation of PPARα signaling might prevent LCA-induced liver injury.Metabolomics, based on ultra-performance liquid chromatography electrospray ionization quadrupole time-of-flight mass spectrometry (UPLC-ESI-QTOF MS), has been widely employed for detecting potential changes of endogenous small molecules in biological matrices.8–11 Applications of metabolomics have been displayed in therapeutic effects of drugs on hepatotoxicity, e.g., schisandrol B and oleanolic acid.12,13 The present study using metabolomics demonstrated that PPARα signaling activated by fenofibrate could protect against LCA-induced hepatotoxicity, as indicated by the repair of disrupted bile acid and phospholipid homeostasis, and the decrease of hepatic inflammation related to nuclear factor-kappa B (NF-κB) activation. The protective role might result from the regulation of lyso-phospholipid synthesis enzymes by fenofibrate, including phospholipase A2 g6, g7, and g12b (Pla2 g6, g7, and g12b). Finally, PPARα activation produced a protective effect against LCA-induced liver injury.
Materials and methods
Animals
Male C57BL/6J mice (6–8 weeks), weighting 20–22 g, were purchased from Shanghai laboratory animal center (SLAC), China. Mice were housed in light- and temperature-controlled rooms with free access to standard rodent food and water. Animals were maintained in accordance with the guidelines of the Chinese Academy of Sciences, Kunming, China, and approved by the institutional ethical committee (IEC) of Kunming Institute of Botany. The mice were randomly assigned into three groups: control group (n = 5), LCA group (n = 5), and LCA + fenofibrate group (LCA + Feno group) (n = 5). Fenofibrate (dissolved in 0.5% sodium carboxymethylcellulose, 200 mg kg−1, oral administration) was administered to mice for 7 consecutive days. LCA (dissolved in corn oil, 125 mg kg−1 twice daily, intraperitoneal administration) was administered from the fourth day to the seventh day, as described previously.14–17 All the experimental mice were housed separately in metabolic cages for 24 h to collect feces samples after the final LCA treatment. 24 h after the final LCA treatment, plasma, liver, bile, and small intestine (duodenum, jejunum, and ileum) samples were obtained and stored at −80 °C until use.Histologic and biochemical assessment
Liver tissues were formalin fixed, paraffin embedded, sectioned, and stained with hematoxylin and eosin (H&E). Serum aspartate transaminase (AST) and alanine aminotransferase (ALT) activities were measured following the manufacturer's instructions (Nanjing Jiancheng Bioengineering Institute, Nanjing, China).UPLC-ESI-QTOF MS analysis
Plasma, bile, feces, liver, and intestine samples were prepared using the method described previously.18–20 The UPLC system was Agilent equipment consisting of a reverse-phase XDB-C18 column (2.1 × 100 mm, 1.8 μM) with a gradient mobile phase containing water (A) and acetonitrile (B). The gradient was from 98% A decreased to 2% A at a constant speed over the next 16 min. Data were collected in both positive and negative mode on Agilent QTOF (Agilent, Santa Clara, USA), which was operated in full-scan mode at m/z 100 to 800. Drying gas temperature was set at 350 °C. Capillary voltage was set at 3.5 kV and nebulizer pressure was 35 psi. 5 μM chlorpropamide was added in the samples as the internal standard.Data processing and multivariate data analysis
Multivariate data analysis was conducted using Mass Profinder and Mass Profiler Professional software (Agilent, Santa Clara, USA). Principal component analysis (PCA) was performed using SIMCA-P+13.0 software (Umetrics, Kinnelon, USA).Quantification of mRNA
Liver RNA was extracted by using Trizol reagent (TAKARA, Dalian, China). Quantitative real-time PCR (QPCR) analysis was performed using SYBR green PCR master mix (TAKARA, Dalian, China) in a CFX Connect Real-Time System (Bio-Rad Laboratories). β-actin was run for each sample as an internal control. QPCR primer sequences were listed in ESI Table S1.†Western blot analysis
Protein extracted from mouse liver tissue was prepared using radioimmunoprecipitation assay (RIPA) lysis buffer, and protein concentration was determined by bicinchoninic acid assay (BCA) protein assay. Ten μg of protein were subjected to SDS-PAGE electrophoresis, transferred to polyvinylidene fluoride (PVDF) membranes (Bio-Rad, Shanghai, China), and probed with primary antibodies followed by secondary antibodies. The immunoreactive bands were visualized using ChemiDoc TM XRS+ system (Bio-Rad). The following antibodies were used: MRP3 (39909S, CST, Shanghai, China), CYP8B1 (A191910, Abcam, Shanghai, China), β-actin (D6A8, CST, Shanghai, China), and anti-rabbit peroxidase-conjugated second antibody (SA00001-2, Proteintech, Shanghai, China).Statistical analysis
All experimental values were presented as mean ± SEM. A P-value less than 0.05 was considered significant.Results
Fenofibrate protected against LCA-induced liver injury
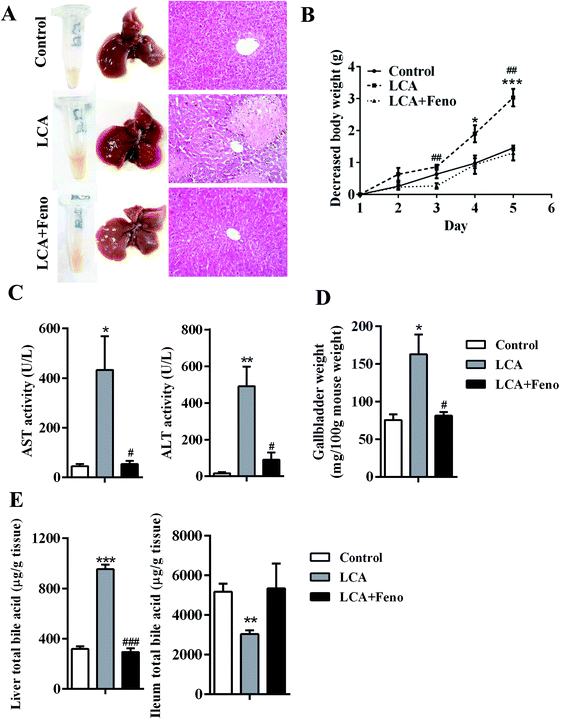
Hepatic morphologic and histological analyses showed that fenofibrate recovered parenchymal necrosis and inflammatory infiltration induced by LCA (Fig. 1A). Consistent with the histological examination, the weight loss induced by LCA was attenuated by fenofibrate (P < 0.05) (Fig. 1B). Fenofibrate recovered the abnormal elevation of AST and ALT induced by LCA (P < 0.05) (Fig. 1C). Additionally, the increased gallbladder weight induced by LCA was attenuated by fenofibrate (P < 0.05) (Fig. 1D). Total bile acid measurement revealed that fenofibrate recovered the increased hepatic total bile acids and the decreased ileal total bile acids induced by LCA (Fig. 1E). Taken together, these data clearly indicated that fenofibrate could protect against LCA-induced liver injury.Metabolomic analysis of mouse serum and liver
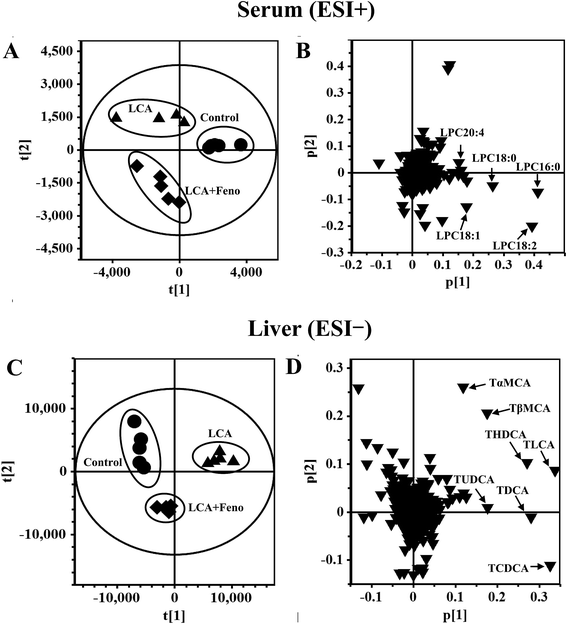
In order to determine the therapeutic effect of fenofibrate on LCA model, PCA model was used to analyze the serum data sets from control, LCA, and LCA + Feno groups. As shown in Fig. 2A, LCA group was deviated from control and LCA + Feno groups, indicating that fenofibrate treatment partially recovered the changed metabolites induced by LCA. Five ions 496.3398+ (Rt = 10.665), 524.3711+ (Rt = 12.132), 522.3554+ (Rt = 11.265), 520.3398+ (Rt = 10.231), and 544.3398+ (Rt = 10.264) were found to be deviated from the ions cloud in loading scatter plot (Fig. 2B). The MS/MS fragmentation identified these ions as lysophosphatidylcholine 16:0 (LPC16:0), LPC18:0, LPC18:1, LPC18:2, and LPC20:4, respectively (Fig. S1†).Liver metabolomics was also used to determine the differences among control, LCA, and LCA + Feno groups. LCA group was deviated from control and LCA + Feno group, suggesting the hepatoprotective effect of fenofibrate (Fig. 2C). As shown in Fig. 2D, seven ions 514.2843− (Rt = 6.336 and 6.422), 498.2895− (Rt = 7.104, 7.166, 8.092 and 8.394), and 482.2945− (Rt = 9.676) were found to be deviated from the ions cloud in loading scatter plot. The MS/MS fragmentation identified these ions as tauro-β-muricholic acid (TβMCA), tauro-α-muricholic acid (TαMCA), taurohyodeoxycholic acid (THDCA), tauroursodeoxycholic acid (TUDCA), taurochenodeoxycholic acid (TCDCA), taurodeoxycholic acid (TDCA), and taurolithocholic acid (TLCA), respectively. As seen from the results of metabolomics, bile acids were significantly decreased, and LPCs were significantly increased after fenofibrate treatment.
Disorder of bile acids homeostasis was recovered by fenofibrate
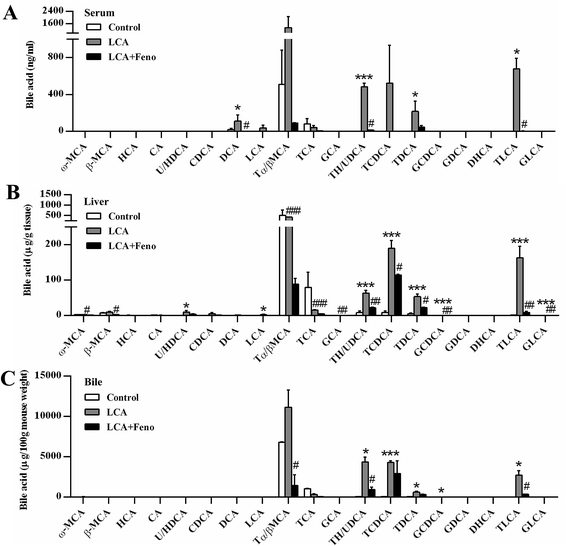
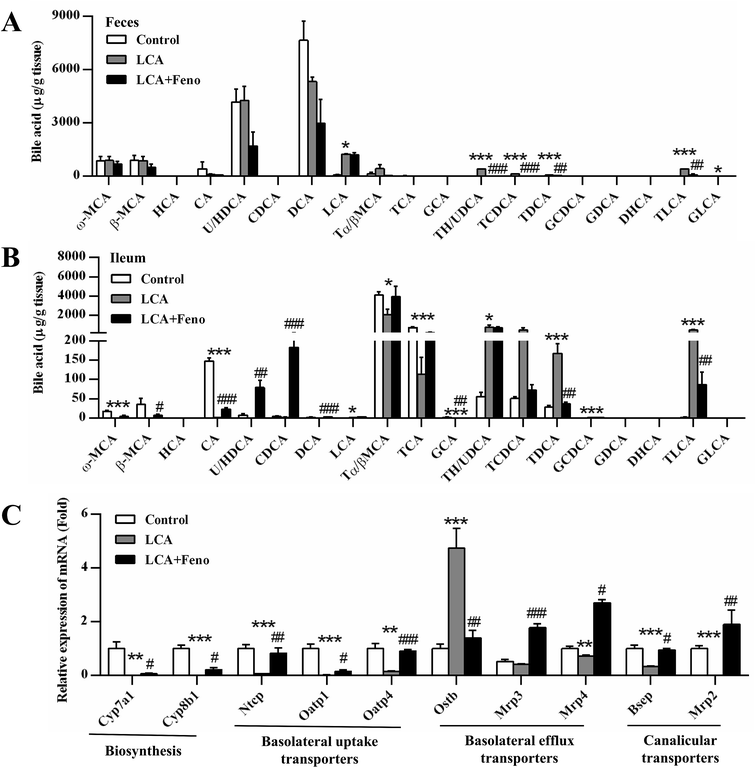
As LCA disrupted bile acid homeostasis in Fig. 2D, target analysis showed the increased bile acids by LCA exposure in serum, liver, bile, and feces were recovered by fenofibrate (Fig. 3 and 4A). The increased levels of deoxycholic acid (DCA), THDCA/TUDCA, and TLCA in serum of LCA group were improved by fenofibrate (P < 0.05) (Fig. 3A). The increased levels of THDCA/TUDCA, TCDCA, TDCA, glycochenodeoxycholic acid (GCDCA), TLCA, and GLCA in liver of LCA group were recovered with fenofibrate (P < 0.05) (Fig. 3B). The increased levels of THDCA/TUDCA and TLCA in bile of LCA group were attenuated by fenofibrate (P < 0.05) (Fig. 3C). The increased levels of THDCA/TUDCA, TCDCA, TDCA, and TLCA in feces of LCA group were recovered by fenofibrate (P < 0.05) (Fig. 4A). In ileum, the increased levels of TDCA and TLCA, and the decreased levels of cholic acid (CA) and glycocholic acid (GCA) in LCA group were improved by fenofibrate (P < 0.01) (Fig. 4B). The changed trends of bile acids in duodenum and jejunum were similar to that of the ileum (Fig. S2†).The expressions of bile acid synthesis and transport genes were further analyzed by QPCR (Fig. 4C). Fenofibrate recovered two of the most important bile acid synthesis genes, cholesterol 7α-hydroxylase (Cyp7a1) and sterol 12α-hydroxylase (Cyp8b1) (P < 0.05) (Fig. 4C). The decreased expressions of three basolateral uptake transporters, sodium taurocholate co-transporting polypeptide (Ntcp), organic anion transporting polypeptide 1 and 4 (Oatp1 and 4), were improved by fenofibrate (P < 0.05) (Fig. 4C). Three basolateral efflux transporters, organic solute transporter β (Ostβ), and multidrug resistance protein 3 and 4 (Mrp3 and 4), and two canalicular transporters, bile salt export pump (Bsep) and Mrp2, were also analyzed among three groups. The increased expression of Ostβ by LCA exposure was attenuated by fenofibrate (P < 0.01) (Fig. 4C). The decreased expression levels of Mrp2, 3, 4, and Bsep by LCA exposure were recovered by fenofibrate (P < 0.05) (Fig. 4C). Hepatic protein expression levels were consistent with hepatic mRNA expression levels (Fig. S3†). Fenofibrate treatment significantly resulted in MRP3 and CYP8B1 upregulation. Therefore, disorder of bile acids homeostasis was recovered by fenofibrate.
Disorder of phospholipid homeostasis was repaired by fenofibrate through upregulation of LPC synthesis
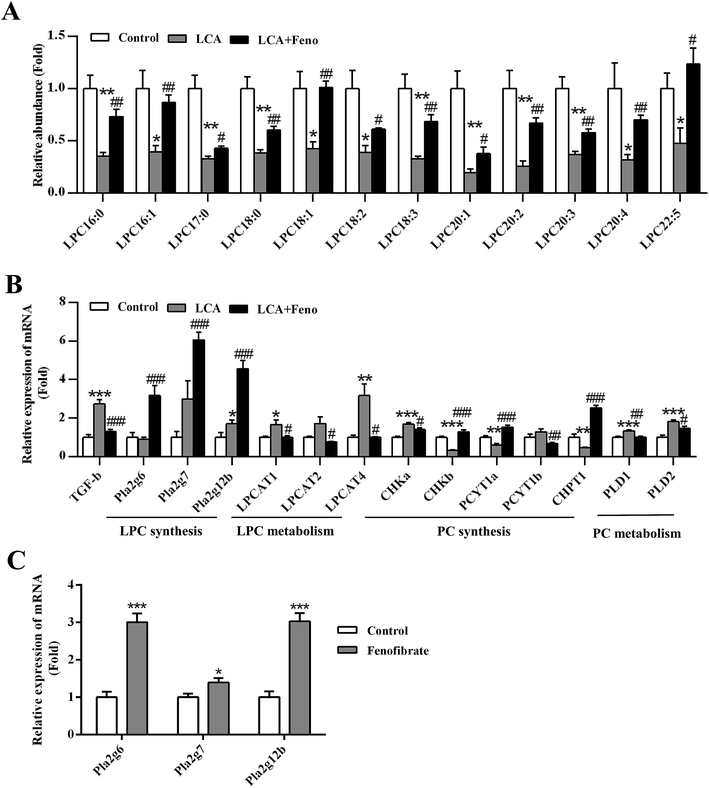
Due to LPC synthesis upregulated by PPARα activation,21 the role of PPARα in the improvement of LCA-disrupted phospholipid homeostasis was investigated. PCA analysis showed that fenofibrate treatment improved the levels of partial serum LPCs (Fig. 2B). Target metabolomics analysis showed that fenofibrate increased the levels of a series of LPCs, which were decreased in LCA-induced hepatotoxicity (P < 0.05) (Fig. 5A).The expression of LPC- and phosphatidylcholine (PC)-related genes were analyzed by QPCR (Fig. 5B). No significant change in the expression of Pla2g6, Pla2g7, and Pla2g12b was found between control and LCA groups. Interestingly, LCA + Feno group significantly induced the expression of Pla2g6, Pla2g7, and Pla2g12b (P < 0.001), which could contribute to the increased LPC levels (Fig. 5B). Additionally, fenofibrate alone could directly induce the expression of Pla2g6, Pla2g7, and Pla2g12b (P < 0.05) (Fig. 5C). Hepatic genes related to LPC metabolism, lysophosphatidylcholine acyltransferase 1, 2, and 4 (LPCAT1, 2, and 4) were determined (Fig. 5B). The up-regulations of hepatic LPCAT1 and 4 genes in LCA group were recovered by fenofibrate (P < 0.05) (Fig. 5B). LPC was closely related to PC homeostasis,1 so we measured the PC synthesis- and metabolism-related genes. Five of the hepatic de novo PC synthesis genes, hepatic choline kinase a and b (CHKa and b), phosphate cytidylyltransferase 1a and 1b (PCYT1a and 1b), and choline phosphotransferase 1 (CHPT1), were recovered by fenofibrate (Fig. 5B). Two of the increased PC metabolism-related genes, phospholipase D 1 and 2 (PLD1 and 2), were recovered by fenofibrate (P < 0.05) (Fig. 5B). It has demonstrated transforming growth factor beta (TGF-β) played a critical role in phospholipid synthesis and metabolism.1,22 The increased expression of TGF-β in LCA group was diminished by fenofibrate treatment (P < 0.001) (Fig. 5B). In conclusion, hepatic disruption of LPC and PC homeostasis by LCA could be significantly recovered by fenofibrate.
Furthermore, the expression of sphingomyelin (SM) and ceramides (CM) related genes were also analyzed by QPCR (Fig. S4†). SM was mainly regulated by SM synthase (SGMS) and sphingomyelin phosphodiesterase (SMPD), and CM was mainly regulated by its five de novo synthesis genes including serine palmitoyltransferase, long chain base subunit 1 and 2 (SPTLC1 and 2), LAG1 homolog, ceramide synthase 1 and 2 (LASS1 and 2), and degenerative spermatocyte homolog 1 (DEGS1). Fenofibrate treatment could repair the disrupted SM and CM homeostasis during LCA-induced liver injury (Fig. S4†).
Fenofibrate inhibited the increase in hepatic inflammation related to NF-κB activation
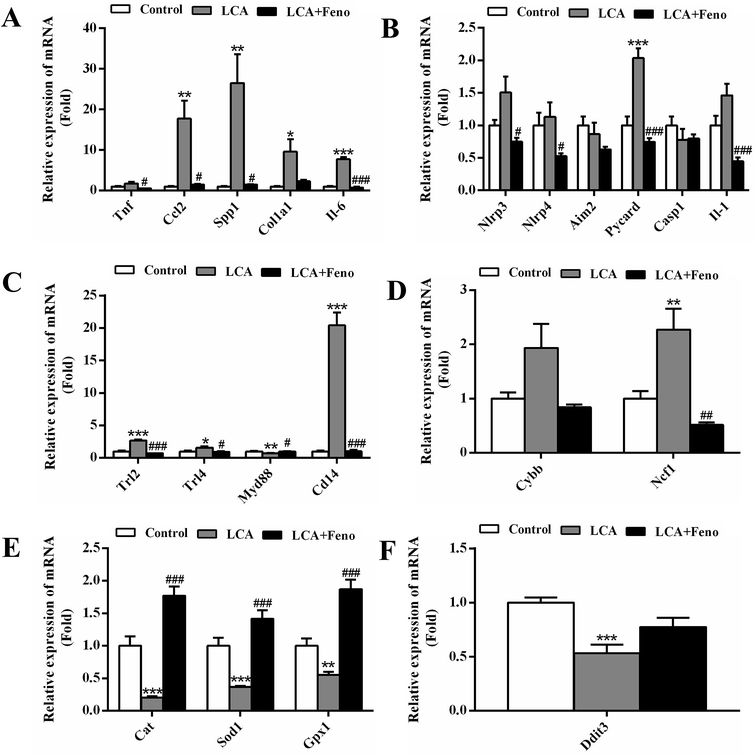
Considering the role of NF-κB in tissue inflammation and inhibitory effects of PPARα activation on inflammation, the hepatic inflammation related to NF-κB was measured. The increased expressions of the NF-κB target genes, tumor necrosis factor alpha (Tnf), chemokine (C–C motif) ligand 2 (Ccl2), secreted phosphoprotein 1 (Spp1), collagen, type I, alpha 1 (Col1a1), and interleukin-6 (Il-6), were recovered by fenofibrate (Fig. 6A). It has reported that NF-κB could be activated by several upstream factors, including inflammasome, toll-like receptor (TLR), reactive oxygen species (ROS), and endoplasmic reticulum (ER) stress.23 The genes associated with these four factors were changed by LCA exposure (Fig. 6B–F). The increased inflammasome-related gene, PYD and CARD domain containing (Pycard), was recovered by fenofibrate (P < 0.001) (Fig. 6B). The increased TLR-related genes, Trl2, Trl4, and CD14 antigen (Cd14), were improved by fenofibrate (P < 0.05) (Fig. 6C). The increased ROS-generating-related gene, neutrophil cytosolic factor 1 (Ncf1), was attenuated by fenofibrate (P < 0.01) (Fig. 6D). The decreased ROS-eliminating- and ER stress-related genes, catalase (Cat), superoxide dismutase 1 (Sod1), glutathione peroxidase 1 (Gpx1), and DNA-damage inducible transcript 3 (Ddit3), were recovered by fenofibrate (Fig. 6E and F). Among all these changed genes in LCA group, Cd14 gene increased 20 folds, and showed the most significant change following the treatment. Therefore, severe hepatic inflammations observed in LCA group associated with NF-κB activation could be improved by PPARα activation following the treatment of fenofibrate.Discussion
It has been demonstrated that LCA feeding leads to segmental bile duct obstruction and destructive cholangitis in mice. Although the mechanism of LCA-induced cholestasis is different from human cholestasis, LCA has been frequently used as the cholestatic liver injury in mice since the early 1960s.24 Nuclear receptors, such as pregnane X receptor (PXR) and NF-E2-related factor 2 (Nrf2), had been reported to protect against LCA toxicity.12,13,25,26 PXR played protective role through up-regulation of CYP3A that metabolized LCA for elimination.25 Nrf2 played protective role by up-regulation of Mrp2, 3, and 4.13 However, limited therapies were used to protect against LCA-induced liver injury.Previous study reported that LCA exposure leaded to the disrupted hepatic phospholipid homeostasis.1 In our studies, LPC metabolism-related genes, LPCAT1 and 4, were significantly increased after LCA exposure, resulting in the decreased content of LPC (Fig. 5B). After fenofibrate exposure, the synthesis of LPC was significantly induced by activating Pla2g6, Pla2g7, and Pla2g12b, which recovered the disrupted phospholipid homeostasis (Fig. 5B). Furthermore, the disruption of SM and CM induced by LCA exposure also could be improved by fenofibrate treatment (Fig. S4†).
NF-κB was also a central mediator in regulating genes involved in the inflammatory response,27 and its activation was induced by a variety of factors, such as TLR-mediated pathway.23 In our study, one of the TLR-related gene, CD14, was greatly induced after LCA exposure, which might play an important role in activating NF-κB in LCA model (Fig. 6C). Membrane-associated protein CD14 could form an TLR-2/CD14 receptor complex with TLR-2 and other adaptor proteins.28 Consistent with the increase of CD14, the level of TLR-2 was also increased by LCA here (Fig. 6C). Therefore, NF-κB signaling pathway in liver could be mediated by PPARα activation following fenofibrate treatment, contributing to the alleviation of LCA-induced liver injury.
In many models of liver injury, such as alpha-naphthyl isothiocyanate (ANIT) and lipopolysaccharide (LPS) induced hepatotoxicity, the expression level of Ostβ was significantly increased.29,30 Additionally, in obstructive cholestatic patients, the expression of Ostβ was also increased by 16-fold,31 suggesting that increased Ostβ expression contributes to eliminating bile acid and preventing injury. In the present study, the decreased Ostβ expression in liver after fenofibrate treatment was observed in liver injury induced by ANIT. These data demonstrated that the liver injury and inflammation induced by ANIT could be improved by fenofibrate.
In conclusion, the present study demonstrated the protective role of fenofibrate in LCA-induced liver damage using metabolomics approach. The disrupted phospholipid homeostasis was repaired by fenofibrate through the upregulation of Pla2g6, Pla2g7, and Pla2g12b. Both TGF-β and NF-κB signaling pathways were mediated by PPARα activation, contributing to the alleviation of liver injury. In the end, PPARα activation produces a protective effect against LCA-induced liver injury. These data demonstrate the power of mass spectrometry-based metabolomic analysis to uncover the potential therapy for liver injury induced by chemicals exposure.
Conflicts of interest
The authors declare that there are no conflicts of interest.Abbreviations
| Bsep: | Bile salt export pump |
| CA: | Cholic acid |
| Ccl2: | Chemokine (C–C motif) ligand 2 |
| Cd14: | CD14 antigen |
| CM: | Ceramides |
| ER: | Endoplasmic reticulum |
| GLCA: | Glycolithocholic acid |
| LCA: | Lithocholic acid |
| LPC: | Lysophosphatidylcholine |
| LPCAT: | Lysophosphatidylcholine acyltransferase |
| Mrp: | Multidrug resistance protein |
| NF-κB: | Nuclear factor-kappa B |
| Ostβ: | Organic solute transporter β |
| PC: | Phosphatidylcholine |
| Pla2: | Phospholipase A2 |
| PPARα: | Peroxisome proliferator-activated receptor α |
| ROS: | Reactive oxygen species |
| SM: | Sphingomyelin |
| Spp1: | Secreted phosphoprotein 1 |
| TCDCA: | Taurochenodeoxycholic acid |
| TDCA: | Taurodeoxycholic acid |
| TGF-β: | Transforming growth factor β |
| THDCA: | Taurohyodeoxycholic acid |
| TLCA: | Taurolithocholic acid |
| TLR: | Toll-like receptor |
| TUDCA: | Tauroursodeoxycholic acid |
| TαMCA: | Tauro-α-muricholic acid |
| TβMCA: | Tauro-β-muricholic acid |
Acknowledgements
This work was supported by the National Key Research and Development Program of China (2017YFC0906903), the Thousand Young Talents Program of China (Y6185211T1), Kunming Institute of Botany (Y76E1211K1), and State Key Laboratory of Phytochemistry and Plant Resources in West China (52Y67A9211Z1).References
- T. Matsubara, N. Tanaka, A. D. Patterson, J. Y. Cho, K. W. Krausz and F. J. Gonzalez, Hepatology, 2011, 53, 1282–1293 CrossRef CAS PubMed.
- B. L. Woolbright, F. Li, Y. Xie, A. Farhood, P. Fickert, M. Trauner and H. Jaeschke, Toxicol. Lett., 2014, 228, 56–66 CrossRef CAS PubMed.
- J. Trottier, P. Caron, R. J. Straka and O. Barbier, Clin. Pharmacol. Ther., 2011, 90, 279–286 CrossRef CAS PubMed.
- K. Senekeo-Effenberger, S. Chen, E. Brace-Sinnokrak, J. A. Bonzo, M. F. Yueh, U. Argikar, J. Kaeding, J. Trottier, R. P. Remmel, J. K. Ritter, O. Barbier and R. H. Tukey, Drug Metab. Dispos., 2007, 35, 419–427 CrossRef CAS PubMed.
- M. Verreault, K. Senekeo-Effenberger, J. Trottier, J. A. Bonzo, J. Belanger, J. Kaeding, B. Staels, P. Caron, R. H. Tukey and O. Barbier, Hepatology, 2006, 44, 368–378 CrossRef CAS PubMed.
- N. Zhang, Y. Lu, X. Shen, Y. Bao, J. Cheng, L. Chen, B. Li and Q. Zhang, Pharmacology, 2015, 95, 173–180 CrossRef CAS PubMed.
- D. I. Mohamed, A. A. Elmelegy, L. F. El-Aziz, H. S. Abdel Kawy, A. A. El-Samad and O. A. El-Kharashi, Eur. J. Pharmacol., 2013, 721, 35–42 CrossRef CAS PubMed.
- F. Li, X. W. Yang, K. W. Krausz, R. G. Nichols, W. Xu, A. D. Patterson and F. J. Gonzalez, J. Proteome Res., 2015, 14, 1937–1946 CrossRef CAS PubMed.
- Y. Zhang, F. Li, Y. Wang, A. Pitre, Z. Z. Fang, M. W. Frank, C. Calabrese, K. W. Krausz, G. Neale, S. Frase, P. Vogel, C. O. Rock, F. J. Gonzalez and J. D. Schuetz, Nat. Commun., 2015, 6, 8186 CrossRef CAS PubMed.
- Y. Yang, Z. Han, Y. Wang, L. Wang, S. Pan, S. Liang and S. Wang, RSC Adv., 2015, 5, 36732–36741 RSC.
- Y. Li, Q. Liao, M. Lin, D. Zhong, L. Wei, B. Han, H. Miao, M. Yao and Z. Xie, RSC Adv., 2015, 5, 79329–79341 RSC.
- H. Zeng, Y. Jiang, P. Chen, X. Fan, D. Li, A. Liu, X. Ma, W. Xie, P. Liu, F. J. Gonzalez, M. Huang and H. Bi, Br. J. Pharmacol., 2017, 174, 672–688 CrossRef CAS PubMed.
- P. Chen, H. Zeng, Y. Wang, X. Fan, C. Xu, R. Deng, X. Zhou, H. Bi and M. Huang, Drug Metab. Dispos., 2014, 42, 844–852 CrossRef PubMed.
- L. D. Beilke, L. M. Aleksunes, R. D. Holland, D. G. Besselsen, R. D. Beger, C. D. Klaassen and N. J. Cherrington, Drug Metab. Dispos., 2009, 37, 1035–1045 CrossRef CAS PubMed.
- B. M. Owen, A. Milona, S. van Mil, P. Clements, J. Holder, M. Boudjelal, W. Cairns, M. Parker, R. White and C. Williamson, Drug Metab. Dispos., 2010, 38, 143–149 CrossRef CAS PubMed.
- K. P. Tan, G. A. Wood, M. Yang and S. Ito, Br. J. Pharmacol., 2010, 161, 1111–1121 CrossRef CAS PubMed.
- J. Zhang, W. Huang, M. Qatanani, R. M. Evans and D. D. Moore, J. Biol. Chem., 2004, 279, 49517–49522 CrossRef CAS PubMed.
- F. Li, A. D. Patterson, K. W. Krausz, N. Tanaka and F. J. Gonzalez, J. Lipid Res., 2012, 53, 1625–1635 CrossRef CAS PubMed.
- Q. Zhao, X. M. Li, H. N. Liu, F. J. Gonzalez and F. Li, Xenobiotica, 2017, 1–15, DOI:10.1080/00498254.2017.1306660.
- Q. Zhao, R. Yang, J. Wang, D. Hu and F. Li, Sci. Rep., 2017, 7, 9967 CrossRef PubMed.
- H. Takahashi, T. Goto, Y. Yamazaki, K. Kamakari, M. Hirata, H. Suzuki, D. Shibata, R. Nakata, H. Inoue, N. Takahashi and T. Kawada, J. Lipid Res., 2015, 56, 254–265 CrossRef CAS PubMed.
- T. Matsubara, N. Tanaka, M. Sato, D. W. Kang, K. W. Krausz, K. C. Flanders, K. Ikeda, H. Luecke, L. M. Wakefield and F. J. Gonzalez, J. Lipid Res., 2012, 53, 2698–2707 CrossRef CAS PubMed.
- X. Hu, N. Tanaka, R. Guo, Y. Lu, T. Nakajima, F. J. Gonzalez and T. Aoyama, J. Nutr. Biochem., 2017, 39, 77–85 CrossRef CAS PubMed.
- P. Fickert, A. Fuchsbichler, H. Marschall, M. Wagner, G. Zollner, R. Krause, K. Zatloukal, H. Jaeschke, H. Denk and M. Trauner, Am. J. Pathol., 2006, 168, 410–422 CrossRef CAS PubMed.
- J. L. Staudinger, B. Goodwin, S. A. Jones, D. Hawkins-Brown, K. I. MacKenzie, A. LaTour, Y. Liu, C. D. Klaassen, K. K. Brown, J. Reinhard, T. M. Willson, B. H. Koller and S. A. Kliewer, Proc. Natl. Acad. Sci. U. S. A., 2001, 98, 3369–3374 CrossRef CAS PubMed.
- L. D. Beilke, L. M. Aleksunes, E. R. Olson, D. G. Besselsen, C. D. Klaassen, K. Dvorak and N. J. Cherrington, Toxicol. Lett., 2009, 188, 38–44 CrossRef CAS PubMed.
- H. L. Pahl, Oncogene, 1999, 18, 6853–6866 CrossRef CAS PubMed.
- S. Guo, R. Al-Sadi, H. M. Said and T. Y. Ma, Am. J. Pathol., 2013, 182, 375–387 CrossRef CAS PubMed.
- Y. J. Cui, L. M. Aleksunes, Y. Tanaka, M. J. Goedken and C. D. Klaassen, Toxicol. Sci., 2009, 110, 47–60 CrossRef CAS PubMed.
- H. Hao, L. Cao, C. Jiang, Y. Che, S. Zhang, S. Takahashi, G. Wang and F. J. Gonzalez, Cell Metab., 2017, 25, 856–867 CrossRef CAS PubMed.
- J. Chai, X. Fang, L. Zhang, S. Chen, Y. Cheng, X. He, Y. Yang, Y. He, H. Wang, R. Wang and W. Chen, PLoS One, 2015, 10, e0120055 Search PubMed.
Footnotes |
| † Electronic supplementary information (ESI) available. See DOI: 10.1039/c7ra08823j |
| ‡ These authors contributed equally. |
| This journal is © The Royal Society of Chemistry 2017 |

