
 Open Access Article
 This Open Access Article is licensed under a
 Creative Commons Attribution 3.0 Unported Licence
Brain region-specific metabolite networks regulate antidepressant effects of venlafaxine
Shunjie Baiabcd,
Qingchuan Hubcd,
Zhi Chenabcd,
Zihong Liangbce,
Wei Wangabc,
Peng Shenbcf,
Ting Wangabcd,
Haiyang Wangbc and
Peng Xie *abcdf
aDepartment of Neurology, Yongchuan Hospital, Chongqing Medical University, Chongqing 402460, China. E-mail: xiepeng@cqmu.edu.cn; Fax: +86-23-68485111; Tel: +86-23-68485490
bChongqing Key Laboratory of Neurobiology, Chongqing, China
cInstitute of Neuroscience and the Collaborative Innovation Center for Brain Science, Chongqing Medical University, Chongqing, China
dKey Laboratory of Laboratory Medical Diagnostics of Education, Department of Laboratory Medicine, Chongqing Medical University, Chongqing, China
eDepartment of Neurology, The Inner Mongolia Autonomous Region People's Hospital, Hohhot, Inner Mongolia, China
fDepartment of Neurology, The First Affiliated Hospital of Chongqing Medical University, Chongqing, China
First published on 29th September 2017
Abstract
Venlafaxine (VLX) is one of the most commonly prescribed clinical antidepressants. Although the initial targets of venlafaxine are known to be neurotransmitter systems, the mechanisms underlying chronic therapeutic effects in different key brain regions have not been fully clarified. In this study, we used depression-related behavior to evaluate the effects of chronic VLX therapy in rats. Gas chromatography-mass spectrometry-based metabolomics was used to characterize metabolomic responses to VLX in the hippocampus and prefrontal cortex. The results demonstrated significant differences in despair behaviors between VLX-treated and control groups of rats, and the metabolic profiles of both the hippocampus and prefrontal cortex were significantly altered after VLX treatment. Furthermore, the altered metabolites had significant brain region specificities, and the altered metabolites in the hippocampus had significant correlations with the despair behaviors. The results obtained from such a metabolic profiling strategy potentially provide a unique perspective on the molecular mechanisms of VLX, and these findings could have important implications for antidepressant drug discovery efforts.
1. Introduction
Depression is a leading cause of ill health and disability to society, and more than 300 million people globally are now living with depression.1–4 Antidepressant medications are considered to be the primary treatment for the majority of the population according to many clinical guidelines. Venlafaxine (VLX), a first-line antidepressant of the serotonin–norepinephrine reuptake inhibitor (SNRI), has been widely used for management of depression and anxiety.5–8 Although the initial target of VLX is known, the mechanisms underlying the effects of chronic administration in vivo remain largely unclear. Meanwhile, previous studies by our group as well as investigators at other research institutes have demonstrated that patients given VLX have high levels of discontinuation due to adverse events,9,10 as well as a number of cardiovascular side effects,11 and that VLX takes 6 to 8 weeks to become effective in the patients.11 Recently, people have begun to explore new antidepressants, such as the rapid antidepressant effects of ketamine and its metabolite, hydroxynorketamine.12 Understanding the underlying molecular and neurobiological mechanisms of VLX will offer novel therapeutic insights for exploring optimizing antidepressant therapy.One of the key issues in studying the mechanisms of antidepressant action is to select the appropriate brain regions in which antidepressant exert its effects. Our previous studies have shown that metabolic dysfunction occurs in prefrontal cortex (PFC)13–16 and hippocampus (HP)17–20 in a rat model of depression. Previous studies have also shown that PFC and HP respond differently to antidepressants.21 Thus, examining how VLX regulates the molecular and neurobiological changes in these functional brain regions may offer important mechanistic insights into its therapeutic actions.
Previous studies on antidepressants have focused on changes in neurotransmitters and neurotrophic factors, but ignored some other aspects of the biological alterations. Metabolomics is the quantitative analysis of the complete set of metabolic products in a given biosample,22 and metabolites are a direct reflection of the phenotype. Metabolomics has been widely used in the study of the pathogenesis of depression and antidepressant drugs.2,13,23–26 Thus, metabolomics is a very powerful way to provide valuable insight into the molecular mechanisms targeted by pharmacotherapies, thereby facilitating the development of novel antidepressant treatments.
Here, we used depression-related behavior to evaluate the effects of chronic VLX therapy in rats. A gas chromatography-mass spectrometry (GC-MS)-based metabolomics method, coupled with multivariate statistical analysis, was used to characterize metabolomic responses to chronic VLX treatment in PFC and HP. Our findings demonstrate fundamental differences in the molecular and brain region targets of VLX, and the results have important implications for antidepressant drug discovery efforts.
2. Materials and methods
2.1. Animals and ethics statement
Healthy male Sprague-Dawley (SD) rats (10 weeks-old) weighing approximately 400 g at the beginning of the study were purchased from the animal facility of Chongqing Medical University (China). For the duration of the study, the rats were housed under a light–dark cycle of 12 h at 55 ± 5% relative humidity and 21–22 °C, and allowed ad libitum access to rodent diet and tap water. All animal experiments were reviewed and approved by the Ethics Committee of Chongqing Medical University (permit number: 20120126).2.2. Drug treatment and behavioral testing
Rats were randomly divided into control (CON) and venlafaxine (VLX) groups after one week of adaptive feed. The CON group (n = 14) was treated with 0.9% NaCl solution, and the VLX group (n = 14) was treated with venlafaxine (5 mg kg−1, diluted in 0.9% NaCl solution, Sigma-Aldrich, USA) as described in our previous study.27 Rats received injections intraperitoneally daily.After four weeks of drug treatment, a series of behavioral tests were performed during day time (light-on periods) under conditions of dim light and low noise. Body weights were recorded at baseline, week 1, week 2 and at the end of the treatment.
The open field test (OFT) was applied to assess the locomotor activity and exploratory behavior of rats, and was performed as described previously with minor modifications.13,15,28 The open field box consisted of a 100 cm × 100 cm square arena with 40 cm-high side walls. For the test, rats were individually placed into the center of the open field and left free to explore the arena for 5 min. Prior to each test, the open field area was wiped with 75% ethanol. An automated video-tracking system (SMART, Panlab, Barcelona, Spain) was used to record and analyze the behavior of each rat. Total distance travelled and number of rearings were calculated during the final 5 min of the test, as indicators of locomotor activity and exploratory activity, respectively.
The forced swimming test (FST) and tail suspension test (TST) were used as models of behavioral despair, reflected in an increased duration of immobility.24,28,29 Each rat was individually placed in a Plexiglas cylinder (diameter 20 cm, height 40 cm), filled with water (height 30 cm) at a temperature maintained at 24–26 °C for a 15 min pre-test section. Then gently dried and returned to their home cages. They were placed again in the cylinders 24 h later, allowed to swim freely for 6 min, and the duration of immobility during the last 5 min was recorded and analyzed by SMART. TST was conducted in a black box (30 × 30 × 53 cm). Rats were individually hung on a hook by their tails using a small piece of adhesive tape. Test sessions lasted 6 min and for the last 5 min the immobility of rats was measured and analyzed by SMART.
The Y-maze apparatus consisted of three arms intersected at 120° (45 cm long, 10 cm wide and 29 cm high). Rats were placed at the end of one arm and allowed to freely explore the three arms for 8 min. The sequence and total number of arms entered was noted. Percentage of spontaneous alternation was defined as [(number of alternations)/(total number of arm entries − 2)] × 100%.2
2.3. Sample collection and preparation for GC-MS analysis
After the behavioral tests were finished, the rats were anesthetized with 10% chloral hydrate, and sacrificed by decapitation. The entire brain was removed and the hippocampus and the prefrontal cortex were resected, quickly frozen in liquid nitrogen, and stored at −80 °C for further analyses. Prior to GC-MS analysis, the sample was homogenized in 600 μL of a methanol-water solution (4/1, v/v) with an internal standard solution (2-chloro-L-phenylalanine, 75 ng mL−1). Then the mixture was sonicated for 10 min and subsequently centrifuged at 14![[thin space (1/6-em)]](https://www.rsc.org/images/entities/char_2009.gif) 000 rpm for 10 min at 4 °C. Finally, 550 μL of supernatant was transferred into a glass derivative vial and vacuum-dried at room temperature. The dried extract was mixed with 80 μL methoxamine hydrochloride in pyridine (15 mg mL−1), vortexed for 2 min, and incubated at 37 °C for 90 min with continuous shaking. Subsequently, 80 μL BSTFA with 1% TMCS was added, vortexed for 2 min, and the solution was maintained at 70 °C for 60 min. Following derivatization and cooling to room temperature for 30 min, the derivative was used for GC-MS analysis.
000 rpm for 10 min at 4 °C. Finally, 550 μL of supernatant was transferred into a glass derivative vial and vacuum-dried at room temperature. The dried extract was mixed with 80 μL methoxamine hydrochloride in pyridine (15 mg mL−1), vortexed for 2 min, and incubated at 37 °C for 90 min with continuous shaking. Subsequently, 80 μL BSTFA with 1% TMCS was added, vortexed for 2 min, and the solution was maintained at 70 °C for 60 min. Following derivatization and cooling to room temperature for 30 min, the derivative was used for GC-MS analysis.
2.4. GC-MS analysis
GC-MS analysis was performed according to the methods used in previous studies.24 A total of 0.5 μL from each sample was injected into the Agilent 7890A/5975C GC/MSD System (Agilent Technologies, Santa Clara, California, USA) using the splitless mode. An Agilent J&W HP-5ms capillary column (30 m × 0.25 mm × 0.25 μm) was used for metabolite separation. High-purity helium (purity 99.999%) was used as a carrier gas at a constant flow rate of 6 mL min−1. The column temperature was initially maintained at 70 °C for 2 min, increased to 160 °C at a rate of 6 °C min−1, then increased to 240 °C at a rate of 10 °C min−1, and from 240 °C to 300 °C at 20 °C min−1, with a final 6 min maintenance period at 300 °C. MS spectra were acquired from 50–600 m/z in full scan electron impact ionization.2.5. Metabolomic data analysis
The chromatographic peaks in the total ion current (TIC) chromatograms represent corresponding metabolites, and their relative concentrations can be detected by the peak area normalization method. These peaks were annotated by comparing the accurate mass (m/z) and retention time (RT) from National Institute of Standards and Technology online databases. The relative intensities of the metabolites were converted into a NetCDF file format using TagFinder.30 The subsequent processing produced a list of mass/retention time (RT) pairs with normalized peak intensities of detected peaks. The resulting data was imported into SIMCA-P 14.0 (MKS Umetrics AB) for multivariate statistical analyses, including pair-wise orthogonal projections to latent structures discriminant analyses (OPLS-DA) and response permutation testing (RPT).In our study, multivariate statistical analysis combined with univariate analysis were carried out to identify the differential metabolites contributing to group discrimination. OPLS-DA method was applied to eliminate the effects of variability in non-relevant metabolites and to identify the most predictive metabolites that were different between the groups. RPT was applied to validate outcomes of OPLS-DA analyses with a 200-iteration permutation. The candidate metabolites were selected according to thresholds of variable importance in the projection values (VIP > 1.0) in the OPLS-DA model. Meanwhile, to make our results more robust, we used univariate analysis (two-tailed Student's t-test) to test whether the differential metabolites identified by OPLS-DA. The results showed that the P-values of these differential metabolites were less than 0.05. This was because compared to the univariate analysis, the results of multivariate analysis could obtain the highest discriminatory power and had advantage in detecting the potential significance of subtle metabolic differences.31 We also found the similar phenomenon in our previous study.32,33
Cytoscape software 3.4.0 was used to build the correlation network between these differential metabolites in HP or PFC. We used MetaboAnalyst 3.0 (http://www.metaboanalyst.ca/) to make heat maps of all the different metabolites.34,35 The correlations between the metabolites in different brain regions or the correlations between the behavioral results and the metabolites were determined using MetaboAnalyst.
2.6. Statistical data analysis
Data from the behavioral tests were presented as mean ± standard errors of the mean (SEM) and were analyzed using two-tailed t-tests between CON and VLX-treated rats using the statistical software package Graphpad Prism 7.0 (IBM). Graphpad Prism 7.0 was used for plotting all data. Statistical significance was indicated as follows: * indicates P-value < 0.05.2.7. Molecular and cellular functional analysis
Molecular and cellular functional analyses of the candidate metabolites were performed using IPA (http://www.ingenuity.com). The metabolite lists with KEGG IDs, fold changes and P-values were uploaded to the IPA server. Highly correlated molecular and cellular functions were determined using the Ingenuity Pathway Knowledge Base.3. Results
3.1. Effects of VLX on behavior
FST and TST are classic rodent models for assessing behavioral despair, and depressive animals show an increase in immobility duration. After the chronic VLX treatment, rats displayed shorter durations of immobility in both FST and TST (Fig. 1A and B), indicating that VLX decreased the despair behaviors of rats and therefore produced antidepressant effects. The Y-maze is a test used in rodents to assess spatial working memory. In the present study, VLX had no influence on the percentage of spontaneous alternation (Fig. 1D), indicating VLX might have no influence on spatial memory. Meanwhile, the VLX treatment did not influence body weight, and there were no significant differences in the locomotor and exploratory activities in the OFT (Fig. 1E and F).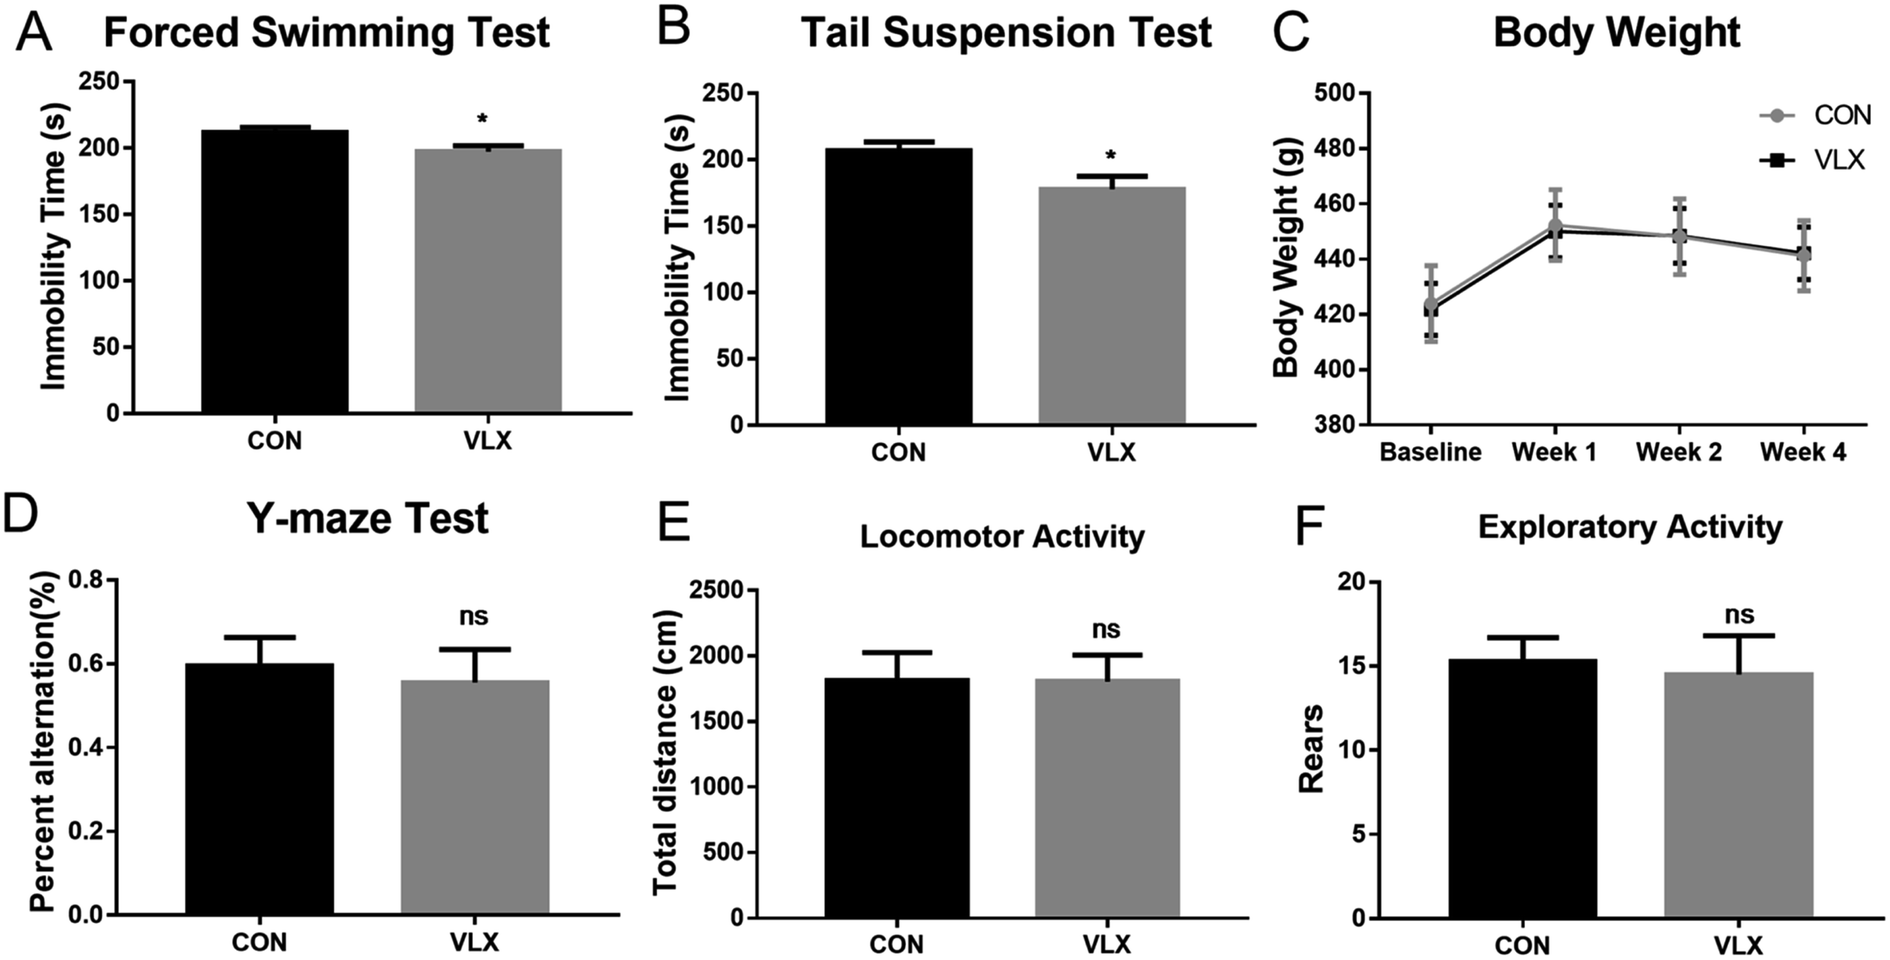 | ||
| Fig. 1 Effects of venlafaxine (VLX) on performance of rats in behavioral tests. (A) Immobility time in the forced swimming test (FST) after 4 weeks of treatment. (B) Immobility time in the tail suspension test (TST) after 4 weeks of treatment. (C) Body weight of rats during treatment with VLX. (D) The percent alternation of rats in the Y-maze test after 4 weeks of VLX treatment. (E) Locomotion in the open field after 4 weeks of VLX treatment. (F) Rears in open field test after 4 weeks of VLX treatment. Values represent the mean ± SEM (n = 14 rats per group). * means p < 0.05, ns means no significant difference, compared with the control (CON) group. | ||
3.2. OPLS-DA model of GC-MS metabolomic analysis
Representative total ion current chromatograms of HP and PFC samples from the two groups revealed strong signals for analysis. 225 metabolites in the PFC and 269 metabolites in the HP were preliminarily identified from the chromatograms after exclusion of internal standards, and these results were used for multivariate analyses.In the OPLS-DA score plots, the CON and VLX groups were obviously distinguished in the HP (R2X = 0.452, R2Y = 0.983, Q2 = 0.874, Fig. 2A), and a clear discrimination was also observed in the PFC (R2X = 0.462, R2Y = 0.898 Q2 = 0.317, Fig. 2B). The RPT was used to validate outcomes of the OPLS-DA analyses, and the results indicated that no overfitting had occurred (Fig. 2C and D).
 | ||
| Fig. 2 Multivariate statistical analysis. OPLS-DA scores plot derived from GC-MS analysis between CON and VLX groups in the HP (A) and PFC (B). Statistical validation of the OPLS-DA model by permutation testing between CON and VLX in the HP (C) and PFC (D). | ||
3.3. Identification of significant metabolites
In the OPLS-DA analysis model, the significantly altered metabolites were identified by VIP > 1.0 in the OPLS-DA models and P < 0.05 using the t-test. A total of 47 different metabolites in the HP were significantly altered by VLX treatment. Compared with the CON group, 7 metabolites were decreased and 40 metabolites were increased in the VLX group (Fig. 3, 4A and Table 1). Meanwhile, a total of 28 different metabolites in the PFC were significantly altered by VLX treatment. Compared with the CON group, 11 metabolites were decreased and 17 metabolites were increased in the VLX group (Fig. 3, 4B and Table 2). Among the differing metabolites, only 10 metabolites (citric acid, creatine, methyl phosphate, myoinositol, phosphate, 3-hydroxybutyric acid, oleic acid, oxalic acid, palmitic acid and MALONAMIDE) were altered both in the HP and the PFC by VLX, including 8 metabolites that showed the same trend between the two brain regions (Fig. 3). Most of the metabolites were altered in only one of the brain regions examined, indicating that the antidepressive role of VLX might be mediated via different pathways in the HP and the PFC.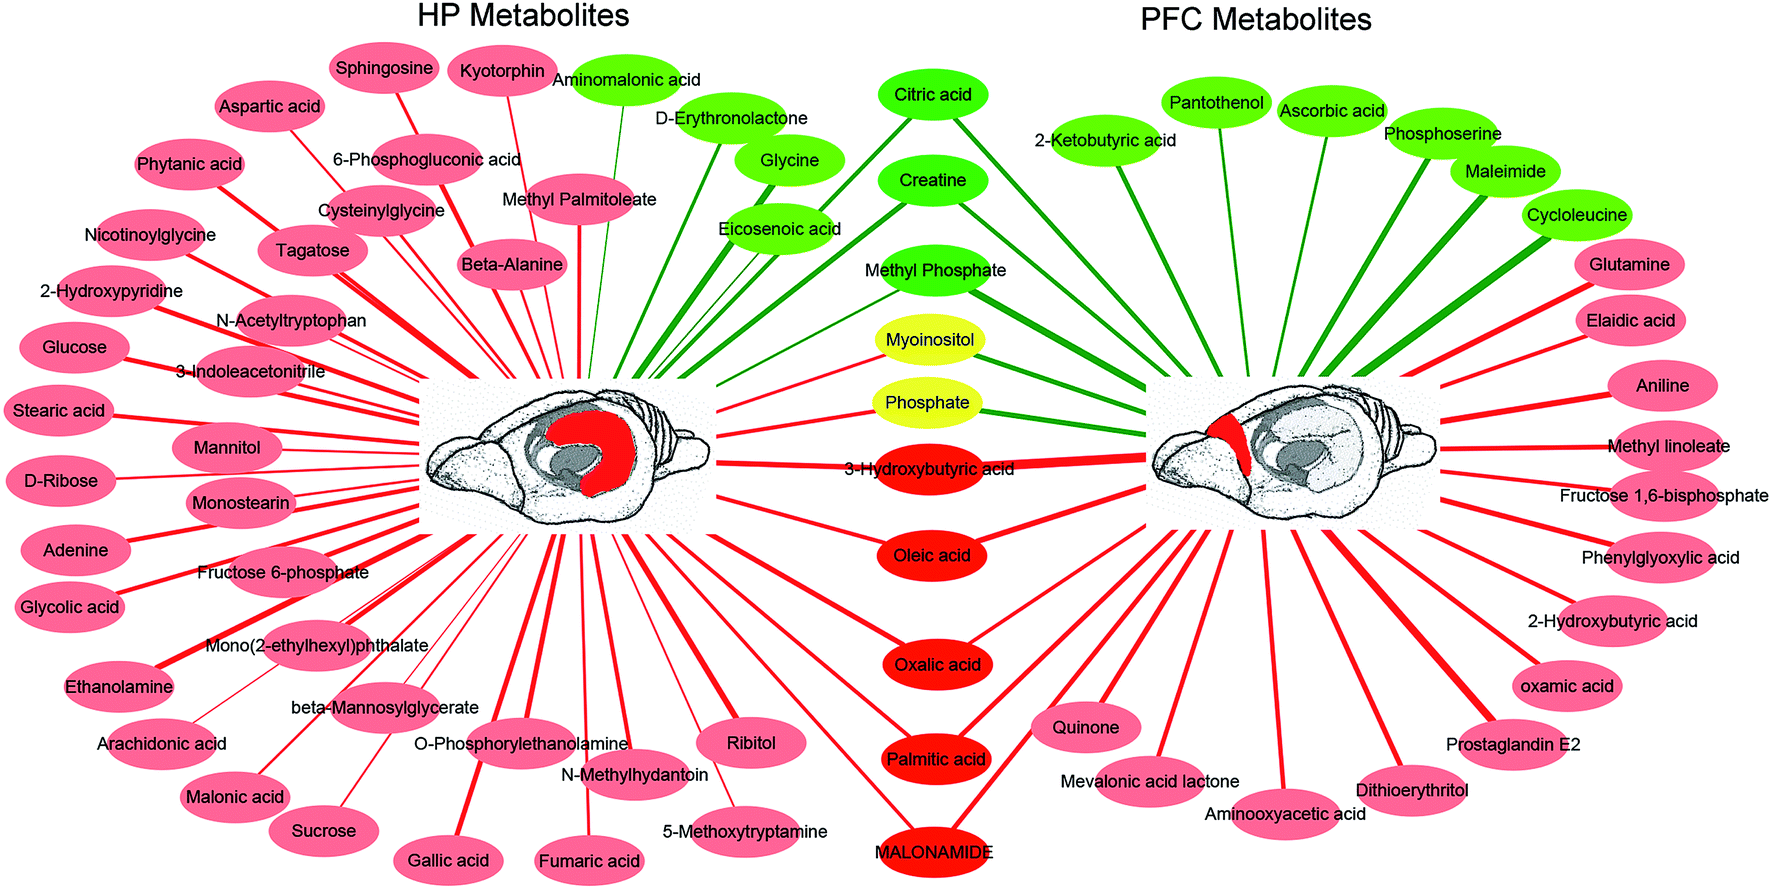 | ||
| Fig. 3 Network analysis of metabolites altered in hippocampus (HP) or prefrontal cortex (PFC) of rats treated with venlafaxine for 4 weeks. Red-colored boxes and red-colored lines indicate upregulation in the venlafaxine (VLX) group compared with control (CON), while green-colored boxes and green-colored lines indicate downregulation. The line widths represent the VIP scores of differential metabolites. | ||
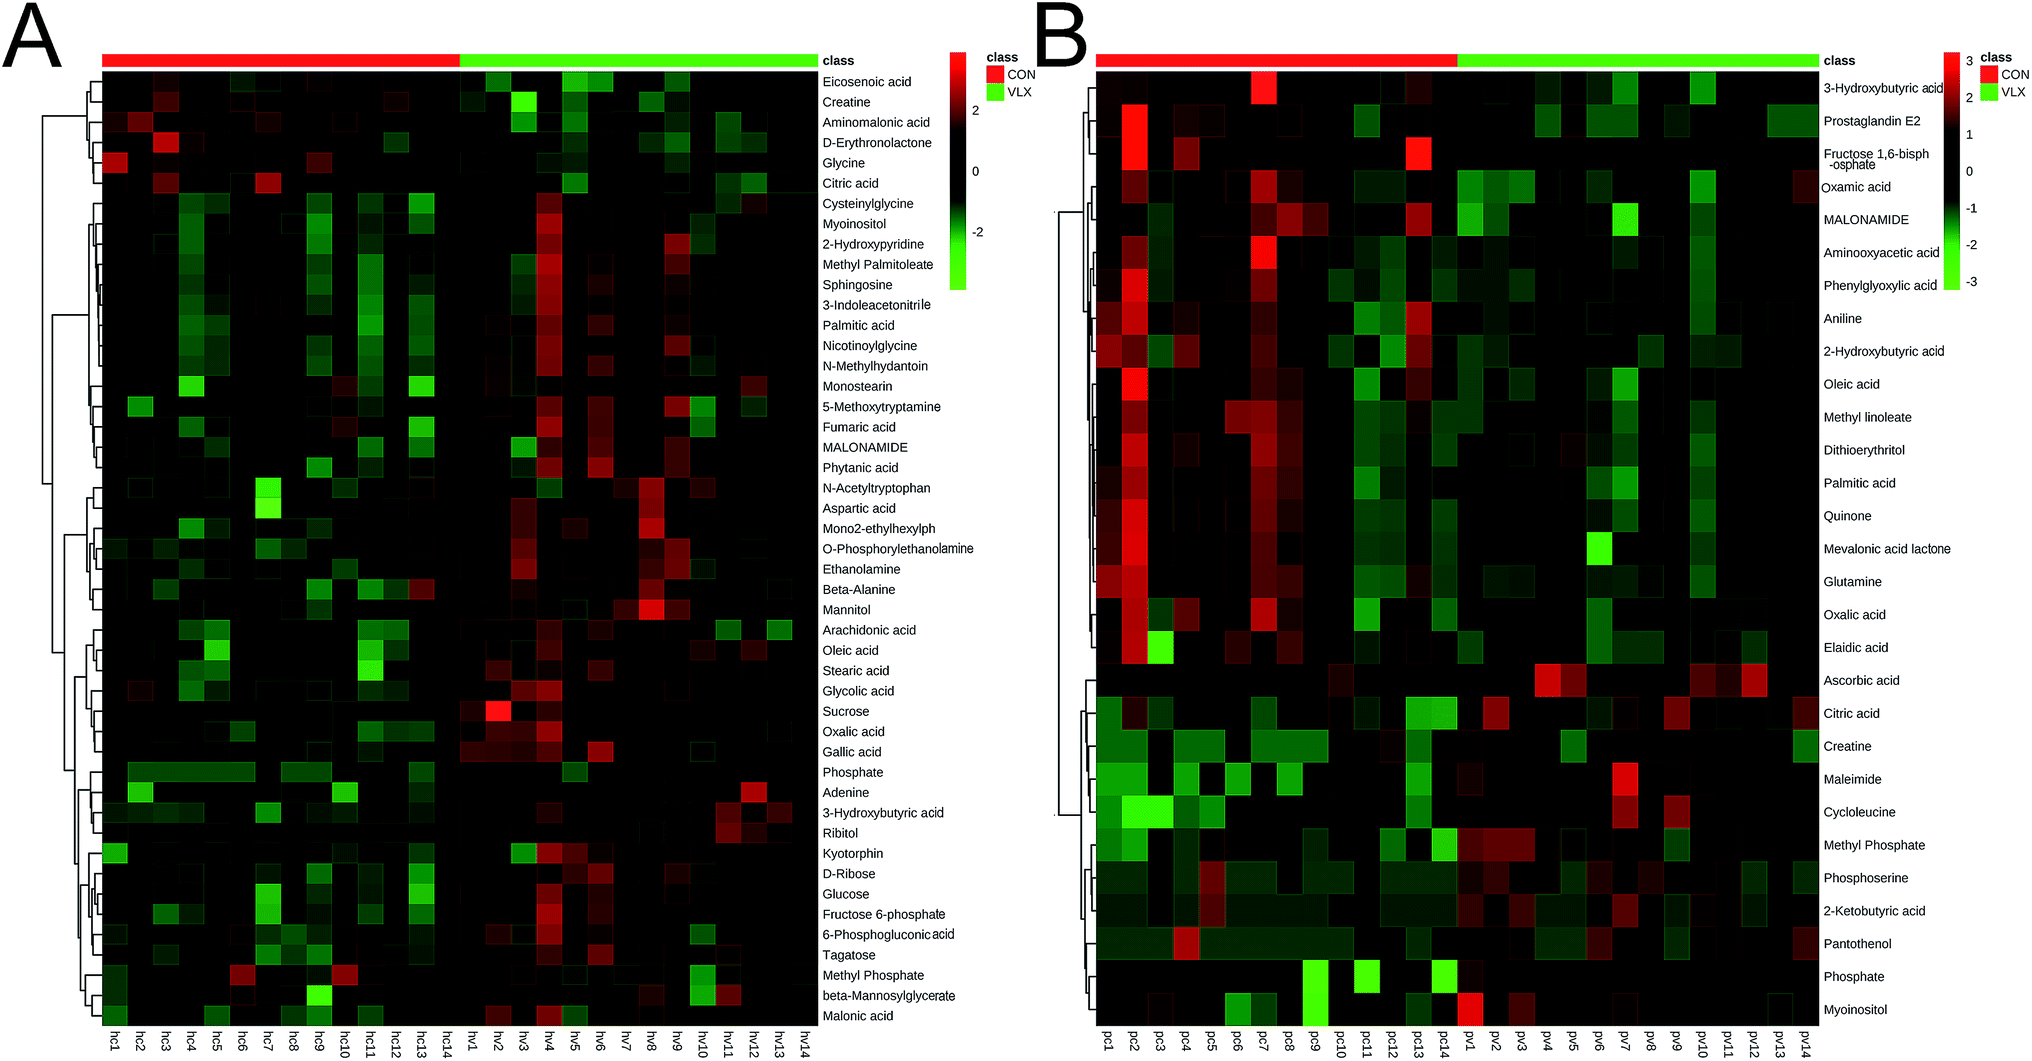 | ||
| Fig. 4 (A) Heat map of the differential metabolites between VLX and CON groups in rat HP. (B) Heat map of the differential metabolites between VLX and CON groups in rat PFC. | ||
| Metabolites | Mass | R.t (min) | VIP score | T-test (p) | FDR | Fold change |
|---|---|---|---|---|---|---|
| Glycine | 102 | 8.169 | 1.72 | <0.001 | 0.000 | 0.38 |
| Eicosenoic acid | 136 | 23.365 | 1.07 | 0.013 | 0.017 | 0.69 |
| Citric acid | 185 | 19.032 | 1.40 | <0.001 | 0.001 | 0.71 |
| Creatine | 115 | 15.377 | 1.54 | <0.001 | 0.000 | 0.80 |
| Methyl phosphate | 163 | 9.097 | 1.19 | 0.006 | 0.010 | 0.85 |
| D-Erythronolactone | 159 | 17.177 | 1.30 | 0.001 | 0.003 | 0.89 |
| Aminomalonic acid | 219 | 14.021 | 1.04 | 0.012 | 0.017 | 0.90 |
| Myoinositol | 219 | 21.543 | 1.25 | 0.026 | 0.029 | 1.07 |
| Arachidonic acid | 106 | 22.618 | 1.02 | 0.023 | 0.026 | 1.11 |
| Fumaric acid | 83 | 12.106 | 1.22 | 0.017 | 0.020 | 1.12 |
| N-Acetyltryptophan | 203 | 22.310 | 1.09 | 0.038 | 0.038 | 1.13 |
| Beta-alanine | 174 | 13.378 | 1.17 | 0.006 | 0.010 | 1.15 |
| 2-Hydroxypyridine | 152 | 6.809 | 1.48 | 0.001 | 0.002 | 1.16 |
| Sphingosine | 57 | 12.205 | 1.26 | 0.035 | 0.036 | 1.17 |
| Palmitic acid | 185 | 21.244 | 1.34 | 0.008 | 0.013 | 1.17 |
| Beta-mannosylglycerate | 204 | 18.853 | 1.01 | 0.022 | 0.026 | 1.18 |
| 3-Indoleacetonitrile | 157 | 6.397 | 1.24 | 0.034 | 0.035 | 1.18 |
| Nicotinoylglycine | 207 | 6.695 | 1.36 | 0.006 | 0.011 | 1.18 |
| Oleic acid | 123 | 22.360 | 1.37 | <0.001 | 0.001 | 1.20 |
| Cysteinylglycine | 185 | 12.377 | 1.22 | 0.016 | 0.020 | 1.21 |
| Stearic acid | 185 | 22.499 | 1.40 | 0.001 | 0.002 | 1.22 |
| O-Phosphorylethanolamine | 225 | 18.576 | 1.50 | <0.001 | 0.001 | 1.23 |
| 5-Methoxytryptamine | 174 | 7.079 | 1.11 | 0.024 | 0.026 | 1.23 |
| Mannitol | 217 | 20.271 | 1.15 | 0.010 | 0.015 | 1.25 |
| Methyl palmitoleate | 139 | 8.265 | 1.32 | 0.012 | 0.017 | 1.25 |
| N-Methylhydantoin | 139 | 8.093 | 1.38 | 0.005 | 0.010 | 1.26 |
| Aspartic acid | 160 | 13.362 | 1.15 | 0.013 | 0.017 | 1.27 |
| Glycolic acid | 177 | 7.379 | 1.41 | <0.001 | 0.001 | 1.27 |
| MALONAMIDE | 70 | 6.632 | 1.30 | 0.008 | 0.013 | 1.29 |
| Mono(2-ethylhexyl)phthalate | 223 | 7.220 | 1.48 | <0.001 | 0.001 | 1.31 |
| 6-Phosphogluconic acid | 299 | 23.297 | 1.14 | 0.028 | 0.029 | 1.33 |
| Ethanolamine | 178 | 6.569 | 1.63 | <0.001 | 0.000 | 1.33 |
| 3-Hydroxybutyric acid | 147 | 8.815 | 1.54 | <0.001 | 0.000 | 1.35 |
| Malonic acid | 223 | 19.382 | 1.17 | 0.005 | 0.010 | 1.36 |
| Phytanic acid | 216 | 14.678 | 1.39 | 0.002 | 0.005 | 1.36 |
| D-Ribose | 217 | 17.090 | 1.17 | 0.014 | 0.018 | 1.36 |
| Kyotorphin | 219 | 8.732 | 1.12 | 0.003 | 0.007 | 1.41 |
| Oxalic acid | 147 | 8.315 | 1.52 | <0.001 | 0.001 | 1.49 |
| Monostearin | 203 | 25.072 | 1.17 | 0.013 | 0.017 | 1.53 |
| Tagatose | 217 | 19.718 | 1.37 | <0.001 | 0.001 | 1.80 |
| Glucose | 160 | 19.781 | 1.45 | <0.001 | 0.001 | 1.86 |
| Fructose 6-phosphate | 217 | 22.755 | 1.48 | <0.001 | 0.001 | 1.89 |
| Adenine | 165 | 19.665 | 1.43 | <0.001 | 0.001 | 1.91 |
| Gallic acid | 282 | 8.913 | 1.49 | <0.001 | 0.001 | 2.15 |
| Phosphate | 219 | 10.786 | 1.36 | <0.001 | 0.001 | 2.75 |
| Sucrose | 217 | 24.282 | 1.11 | 0.006 | 0.010 | 3.13 |
| Ribitol | 217 | 19.789 | 1.61 | <0.001 | 0.000 | 12.29 |
| Metabolites | Mass | R.t (min) | VIP score | T-test (p) | FDR | Fold change |
|---|---|---|---|---|---|---|
| Ascorbic acid | 152 | 20.394 | 1.24 | 0.017 | 0.060 | 0.14 |
| Phosphoserine | 159 | 17.864 | 1.59 | 0.005 | 0.025 | 0.31 |
| 2-Ketobutyric acid | 188 | 14.703 | 1.47 | 0.018 | 0.048 | 0.35 |
| Pantothenol | 157 | 6.834 | 1.23 | 0.013 | 0.055 | 0.37 |
| Maleimide | 154 | 7.751 | 1.85 | 0.001 | 0.011 | 0.46 |
| Creatine | 218 | 15.364 | 1.4 | 0.025 | 0.053 | 0.51 |
| Cycloleucine | 156 | 9.871 | 1.97 | 0.001 | 0.010 | 0.54 |
| Methyl phosphate | 163 | 9.097 | 1.77 | 0.003 | 0.015 | 0.68 |
| Phosphate | 218 | 10.775 | 1.53 | 0.017 | 0.054 | 0.71 |
| Citric acid | 147 | 19.031 | 1.45 | 0.038 | 0.050 | 0.85 |
| Myoinositol | 217 | 21.05 | 1.49 | 0.033 | 0.048 | 0.93 |
| Oxalic acid | 147 | 8.313 | 1.32 | 0.049 | 0.049 | 1.24 |
| Oxamic acid | 190 | 10.61 | 1.48 | 0.029 | 0.049 | 1.26 |
| Oleic acid | 222 | 22.359 | 1.57 | 0.025 | 0.056 | 1.27 |
| Palmitic acid | 117 | 21.243 | 1.46 | 0.046 | 0.053 | 1.29 |
| Aniline | 150 | 6.656 | 1.62 | 0.02 | 0.049 | 1.31 |
| MALONAMIDE | 70 | 6.635 | 1.46 | 0.043 | 0.054 | 1.32 |
| 2-Hydroxybutyric acid | 131 | 8.222 | 1.42 | 0.048 | 0.051 | 1.34 |
| Elaidic acid | 109 | 22.395 | 1.37 | 0.044 | 0.053 | 1.36 |
| Dithioerythritol | 222 | 9.137 | 1.52 | 0.032 | 0.049 | 1.4 |
| Quinone | 121 | 6.183 | 1.53 | 0.032 | 0.052 | 1.41 |
| Mevalonic acid lactone | 57 | 12.203 | 1.43 | 0.047 | 0.053 | 1.41 |
| 3-Hydroxybutyric acid | 147 | 8.814 | 2.06 | <0.001 | 0.004 | 1.47 |
| Aminooxyacetic acid | 220 | 8.491 | 1.42 | 0.029 | 0.052 | 1.48 |
| Glutamine | 173 | 11.607 | 1.62 | 0.018 | 0.051 | 1.48 |
| Phenylglyoxylic acid | 89 | 6.428 | 1.54 | 0.028 | 0.055 | 1.51 |
| Methyl linoleate | 136 | 23.746 | 1.46 | 0.035 | 0.048 | 1.56 |
| Prostaglandin E2 | 151 | 7.269 | 1.85 | 0.002 | 0.012 | 2.84 |
| Fructose 1,6-bisphosphate | 283 | 23.381 | 1.37 | 0.049 | 0.050 | 7.22 |
3.4. Correlations between metabolites in different brain regions
Pearson's correlation coefficient was used to identify the correlations of the metabolites between the HP and the PFC. According to the criteria of P < 0.05 and r > 0.5, the results showed that the significantly downregulated metabolites in the HP were negatively correlated with the downregulated metabolites in the PFC, but positively correlated with the upregulated metabolites in the PFC. Meanwhile, the significantly upregulated metabolites in the HP were positively correlated with the downregulated metabolites in the PFC, and negatively correlated with the upregulated metabolites in the PFC (Fig. 5). | ||
| Fig. 5 Heat map summarizing the correlation of the differential metabolites in rat hippocampus (HP) and prefrontal cortex (PFC) following treatment with venlafaxine for 4 weeks. * means P < 0.05 and r > 0.5. | ||
3.5. Molecular and cellular functional analyses of differential metabolites in IPA
All the significant metabolites (with KEGG IDs) in the HP and PFC were uploaded to the IPA for molecular and cellular functions analyses. The top five functions of the HP metabolites were cell death and survival, lipid metabolism, small molecule biochemistry, energy production, and molecular transport. Simultaneously, the top five functions of the PFC metabolites were involved in cell death and survival, lipid metabolism, molecular transport, small molecule biochemistry, and carbohydrate metabolism (Table 3, Fig. 6A and B).| HP metabolites | PFC metabolites | ||||
|---|---|---|---|---|---|
| Molecular and cellular functions | p-Value | Molecules | PFC-molecular and cellular functions | p-Value | Molecules |
| Cell death and survival | 2.06 × 10⁻²–2.08 × 10⁻⁶ | 21 | Cell death and survival | 2.05 × 10⁻²–1.74 × 10⁻⁵ | 13 |
| Lipid metabolism | 2.06 × 10⁻²–4.81 × 10⁻⁶ | 18 | Lipid metabolism | 2.05 × 10⁻²–3.09 × 10⁻⁵ | 10 |
| Small molecule biochemistry | 2.06 × 10⁻²–4.81 × 10⁻⁶ | 22 | Molecular transport | 2.05 × 10⁻²–3.09 × 10⁻⁵ | 8 |
| Energy production | 2.06 × 10⁻²–8.26 × 10⁻⁶ | 11 | Small molecule biochemistry | 2.05 × 10⁻²–3.09 × 10⁻⁵ | 12 |
| Molecular transport | 2.06 × 10⁻²–8.26 × 10⁻⁶ | 18 | Carbohydrate metabolism | 2.05 × 10⁻²–7.83 × 10⁻⁵ | 10 |
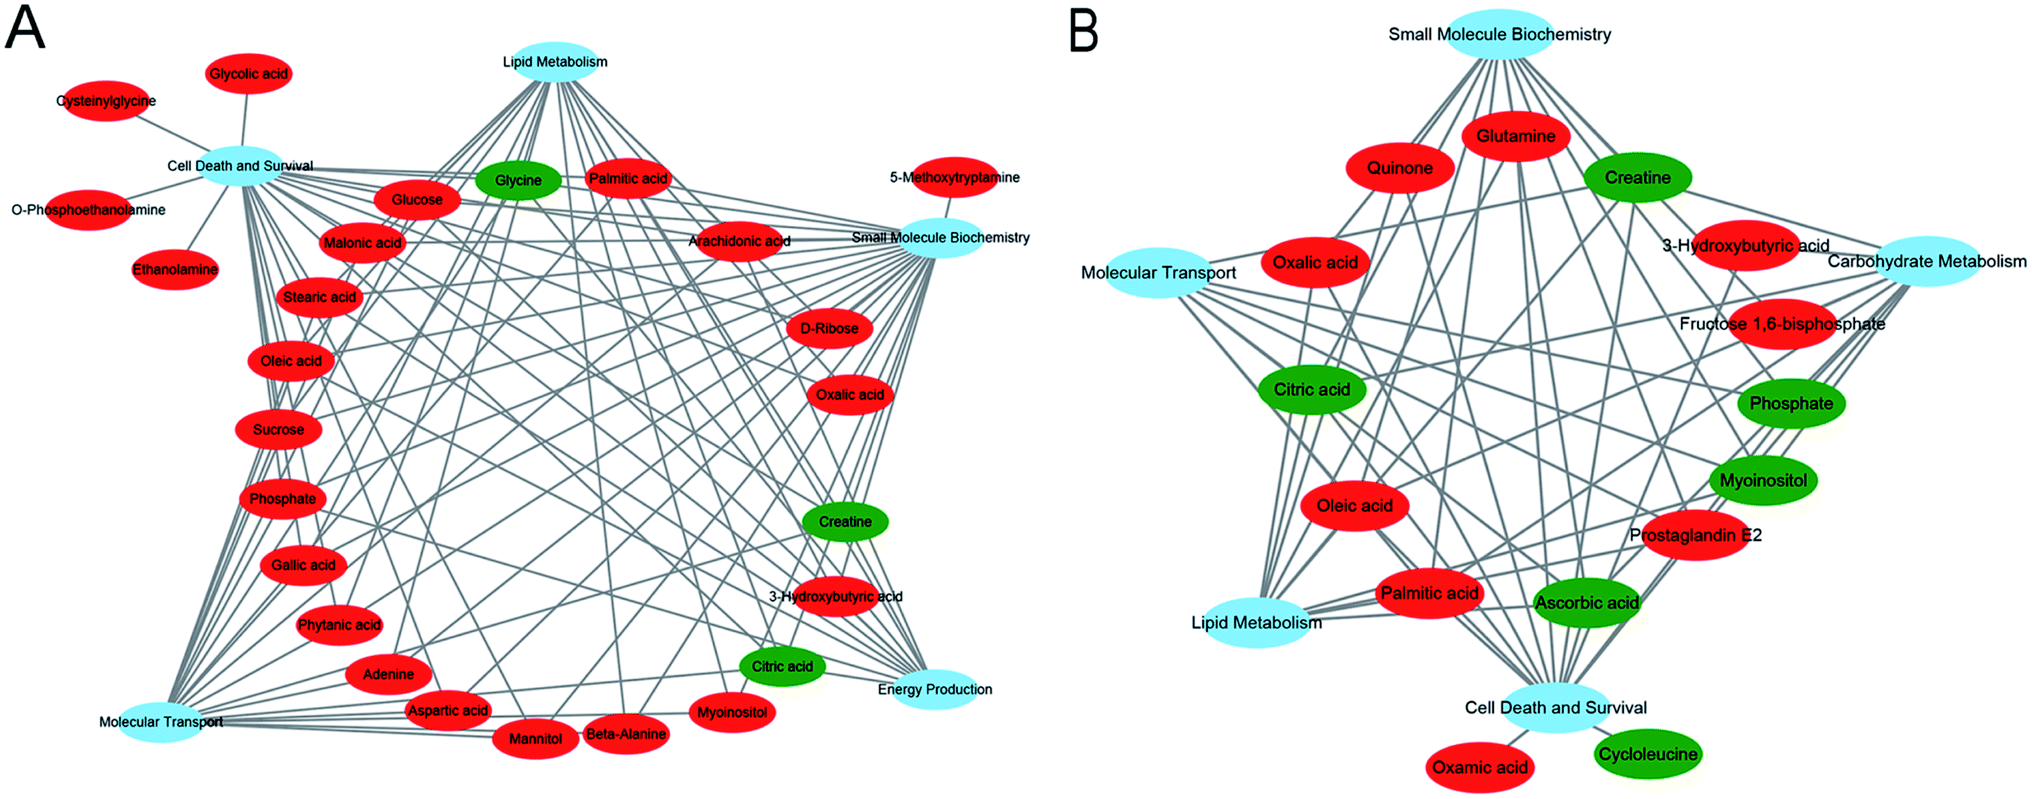 | ||
| Fig. 6 (A) Overview of molecular and cellular functions of differential metabolites in the rat hippocampus following 4 weeks of venlafaxine treatment, according to the IPA database. (B) Overview of molecular and cellular functions of differential metabolites in the rat prefrontal cortex following 4 weeks of venlafaxine treatment, according to the IPA database. | ||
3.6. Correlations between depression-related behaviors and metabolites
To explore the relationship between the VLX-induced metabolites and the behavioral results of FST and TST, we formulated correlation matrixes based on Pearson's correlation coefficients. There were clear correlations between the metabolites and behaviors (p < 0.05). Among the 29 significantly altered metabolites of the PFC, only pantothenol was negatively correlated with the duration of immobility in FST. However, among the 47 significantly altered metabolites of the HP, 7 metabolites were significantly correlated with the behavioral results (glycine, methyl phosphate, arachidonic acid, N-acetyltryptophan, beta-alanine, oleic acid and oxalic acid) (Fig. 7). | ||
| Fig. 7 Heat map summarizing the correlation between the differential metabolites in the rat hippocampus (HP) or prefrontal cortex (PFC) following 4 weeks of venlafaxine treatment and the immobility time in the forced swimming test (FST) or tail suspension test (TST). * means P < 0.05. | ||
4. Discussion
In this study, a GC-MS-based metabolomics approach was used to explore the impact of VLX-induced antidepressant effects on the metabolic phenotype of the HP and PFC. The results demonstrated significant differences in despair behaviors between VLX-treated and control groups of rats, and both the HP and PFC metabolic profiles were altered after VLX treatment. Furthermore, the altered metabolites had significant brain region specificities and had significant correlations with the despair behaviors. These findings may provide new insights into understanding the underlying molecular mechanisms of depression therapy with venlafaxine.The FST and TST are widely used behavioral models for detecting antidepressant activity in rats.36,37 Venlafaxine has been found to exhibit antidepressant activities after two weeks of treatment in rodents by our group as well as investigators at other research institutes.24,38,39 Four weeks of drug injection is a chronic duration for rodents,40,41 and is more similar to the administration time of clinical medication. In this study, typical depression-like behaviours were tested after four weeks of administration. VLX decreased the immobility duration in both FST and TST. The results demonstrated that chronic treatment with VLX exerted significant antidepressant effects on the despair behavior of rats. However, VLX did not influence the memory-related behavior, locomotor activity or exploratory activity of rats in the tests. Therefore, further metabolomics should be applied to explore the antidepressant mechanism of VLX in these two important depression-related brain regions.
The results of GC-MS-based metabolite analysis revealed that 47 and 28 different metabolites were significantly altered by VLX in the HP and PFC, respectively. The results showed that VLX significantly upregulated most metabolites of the two brain regions, which means that VLX could increase the metabolic capacity of the rats. The differential metabolites of the two brain regions had typical regional specificity, with only 10 overlapping altered metabolites, while 2 of the 10 metabolites showed completely opposite trends. These results reveal that VLX plays antidepressant roles in the two brain regions through different mechanisms, which is consistent with previous reports that the mechanisms of depression in different brain regions were specific,42,43 and that the roles of antidepressants in different brain regions were also specific.21
As small molecule compounds, metabolites can spread through the fluids, so we studied the associations between differential metabolites in the two important brain regions. It was interesting to note that the metabolites with the same trends were negatively correlated, whereas the metabolites with opposite trends were positively correlated (Fig. 5). This means that following VLX treatment, the metabolites of the two brain regions have completely different trends. Among the 10 overlapping differential metabolites, we found that only 3-hydroxybutyric acid showed a significant negative correlation. 3-Hydroxybutyric acid has been found to be a histone deacetylase (HDAC) inhibitor.44 Through the inhibition of HDAC2 and HDAC3, it increases brain-derived neurotrophic factor (BNDF) levels and TrkB signaling in the hippocampus.44,45 Our results revealed that 3-hydroxybutyric acid was upregulated in both the HP and PFC. These findings might have clinical relevance in the treatment of depression.
We also analyzed the molecular and cellular functions of the differential metabolites using the IPA database. The overlapping differential metabolites in the two brain regions examined were involved in the functions of cell death and survival, lipid metabolism and small molecule biochemistry, although most of the metabolites were not overlapping. The HP metabolites were also involved in energy production and molecular transport, and the PFC metabolites were involved in molecular transport and carbohydrate metabolism. These findings suggest that the effects of VLX in these brain regions are both similar and specific.
To explore the roles of the HP and PFC metabolites in VLX-induced antidepressant effects, we also established the correlations between the differential metabolites and the immobility time of FST and TST by Pearson's correlation analysis. In our results, only the metabolites that were downregulated and positively correlated with the immobility time, and vice versa, could be considered antidepressant-related metabolites. Based on these criteria, there was no antidepressant-related metabolite among the 28 PFC metabolites. However, 7 HP metabolites were significantly correlated with the immobility time of FST or TST. The immobility time of FST displayed a strong positive correlation with a decreased level of glycine in the HP, and negative correlations with increased levels of beta-alanine, oleic acid and oxalic acid. Meanwhile, the immobility time of TST displayed a positive correlation with a decreased level of methyl phosphate, and negative correlations with increased levels of arachidonic acid, N-acetyltryptophan and oleic acid. The above results mean that VLX could produce antidepressant effects by downregulating the levels of glycine and methyl phosphate, and upregulating the levels of arachidonic acid, N-acetyltryptophan, beta-alanine, oleic acid and oxalic acid.
Finally, we examined the relationships between these 7 antidepressant-related metabolites with depression through the IPA database (Fig. 8). We found that increased levels of arachidonic acid, oleic acid and oxalic acid, which are involved in lipid metabolism, mainly through the relationship between peroxisome proliferative activated receptor gamma (PPARG) and depression. Beta-alanine mainly affects glutamate metabolism to further affect depression. Glycine is known to be an antagonist of NMDA receptors. Though glycine showed a significantly lower level in plasma of major depressive disorder patients,46 glycine showed an upward trend in the stressed rat hippocampus in another study.43 Our results suggest that VLX could downregulate the level of glycine to reverse the trend in the hippocampus of depressed rats. The discrepant distribution of glycine might suggest different signal regulating pathways in the CNS and peripheral blood stream.
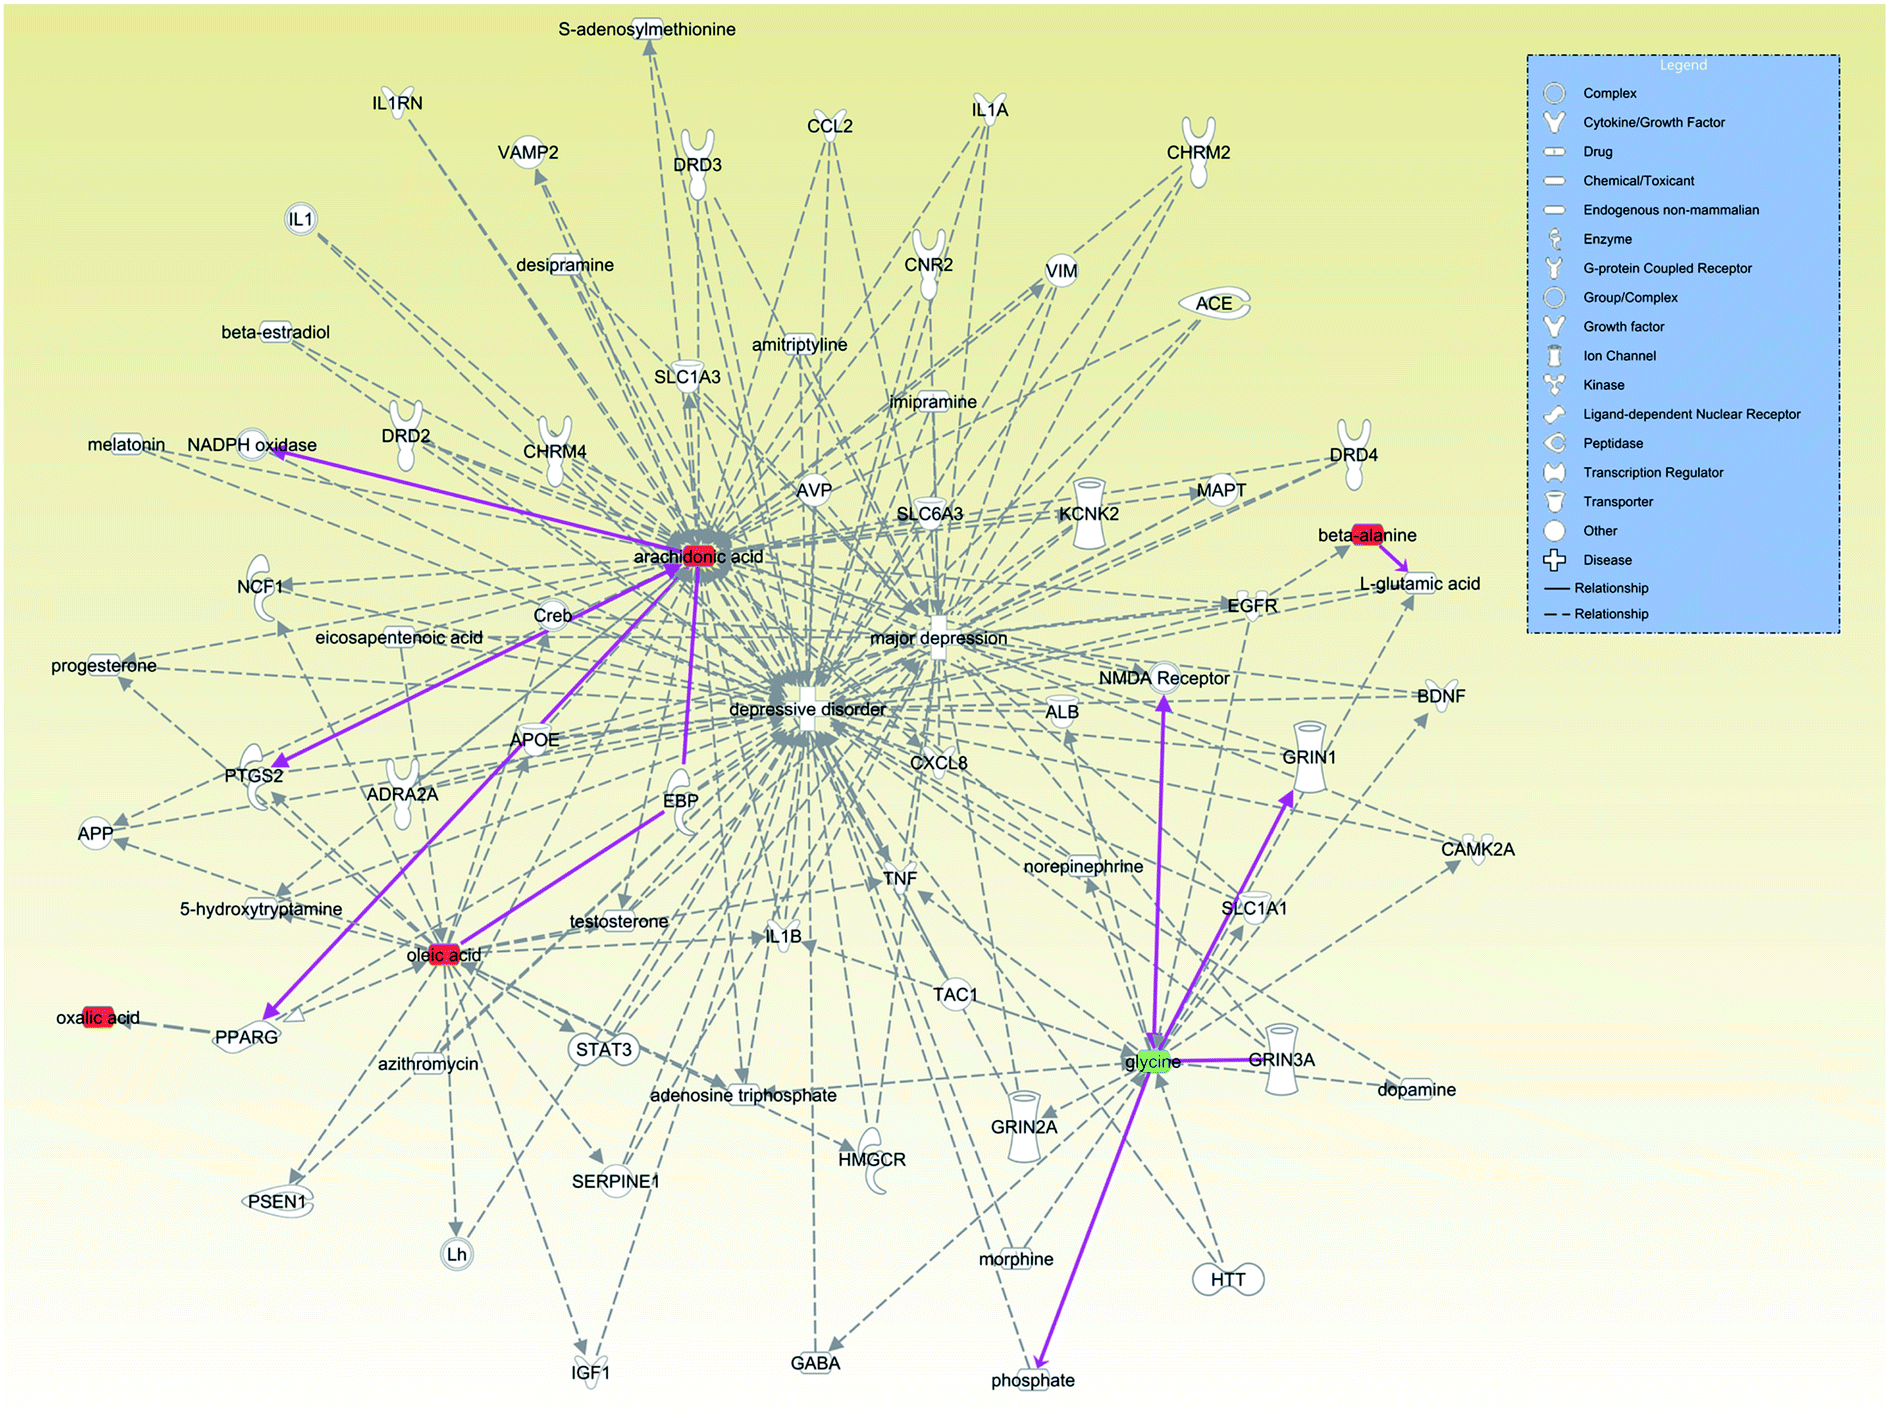 | ||
| Fig. 8 Correlation network between these differential metabolites and depression (major depression or depressive disorder) of antidepressant-related metabolites (arachidonic acid, oleic acid and oxalic acid, beta-alanine and glycine) with depression through the IPA database. | ||
There are several limitations in our study that should be acknowledged. The antidepressant mechanism of VLX in normal physiological rats could be further defined in a depressive model. Owing to the diverse physicochemical properties of metabolites, additional targeted metabolomic methods should be employed in future studies.14,47 The complicated alterations identified here seem to imply the possible involvement of various biochemical processes, with possible compensatory pathways that will require further explorations at the protein and gene levels.
5. Conclusions
In conclusion, our study suggests that the administration of venlafaxine results in significant antidepressant effects in the despair behaviors of rats. Both the HP and PFC metabolic phenotype were altered after VLX treatment. The altered metabolites had significant brain region specificities and had significant correlations with the despair behaviors. The results revealed that VLX could promote antidepressant effects by downregulating the levels of glycine and methyl phosphate, and upregulating the levels of arachidonic acid, N-acetyltryptophan, beta-alanine, oleic acid and oxalic acid in the hippocampus. The work provides novel insights into the understanding of the underlying molecular mechanisms of depression therapy with venlafaxine, which may lead to a new therapeutic target for depression.Author contributions
S. B. accomplished the manuscript and figures. S. B., Q. H., Z. C., and Z. L. analyzed the raw data. W. W., P. S., T. W. and H. W. performed the experiments and improved the language of the manuscript. P. X. conceived the experiments.Conflicts of interest
The authors declare that they have no competing interests.Acknowledgements
This work was supported by the National Basic Research Program of China (973 Program, Grant no. 2009CB918300), the National Natural Science Foundation of China (Grant No. 81371310, 81701360), the Chongqing Science & Technology Commission (cstc2017jcyjA0207), the Science and Technology Research Program of Chongqing Municipal Education Commission (Grant No. KJ1702037), the Natural Science Foundation of Inner Mongolia Autonomous Region of China (Grant No. 2016MS0884), the Foundation Project of the Inner Mongolia Autonomous Region People's Hospital (Grant No. 201551).References
- W. H. Organization, Depression and other common mental disorders: global health estimates, 2017 Search PubMed.
- P. Zheng, B. Zeng, C. Zhou, M. Liu, Z. Fang, X. Xu, L. Zeng, J. Chen, S. Fan, X. Du, X. Zhang, D. Yang, Y. Yang, H. Meng, W. Li, N. D. Melgiri, J. Licinio, H. Wei and P. Xie, Mol. Psychiatry, 2016, 21, 786–796 CrossRef CAS PubMed.
- C. consortium, Nature, 2015, 523, 588–591 CrossRef PubMed.
- Q. Ren, M. Ma, T. Ishima, C. Morisseau, J. Yang, K. M. Wagner, J. C. Zhang, C. Yang, W. Yao, C. Dong, M. Han, B. D. Hammock and K. Hashimoto, Proc. Natl. Acad. Sci. U. S. A., 2016, 113, E1944–E1952 CrossRef CAS PubMed.
- M. A. Rynn, M. A. Riddle, P. P. Yeung and N. R. Kunz, Am. J. Psychiatry, 2007, 164, 290–300 CrossRef PubMed.
- P. Mbaya, Hum. Psychopharmacol., 2002, 17, 335–339 CrossRef CAS PubMed.
- J. M. Kent, Lancet, 2000, 355, 911–918 CrossRef CAS.
- L. Ereshefsky and D. Dugan, Depression Anxiety, 2000, 12(suppl. 1), 30–44 CrossRef PubMed.
- A. Cipriani, X. Zhou, G. C. Del, S. E. Hetrick, B. Qin, C. Whittington, D. Coghill, Y. Zhang, P. Hazell and S. Leucht, Lancet, 2016, 388, 881 CrossRef CAS.
- X. Zhou, S. E. Hetrick, P. Cuijpers, B. Qin, J. Barth, C. J. Whittington, D. Cohen, G. C. Del, Y. Liu and K. D. Michael, World Psychiatr, 2015, 14, 207 CrossRef PubMed.
- S. G. Block and C. B. Nemeroff, Asian J. Psychiatr., 2014, 12, 7 CrossRef PubMed.
- P. Zanos, R. Moaddel, P. J. Morris, P. Georgiou, J. Fischell, G. I. Elmer, M. Alkondon, P. Yuan, H. J. Pribut and N. S. Singh, Nature, 2016, 533, 481 CrossRef CAS PubMed.
- G. Chen, D. Yang, Y. Yang, J. Li, K. Cheng, G. Tang, R. Zhang, J. Zhou, W. Li, Z. Liu, S. Fan and P. Xie, Behav. Brain Res., 2015, 278, 286–292 CrossRef CAS PubMed.
- W. Wang, H. Guo, S. X. Zhang, J. Li, K. Cheng, S. J. Bai, D. Y. Yang, H. Y. Wang, Z. H. Liang, L. Liao, L. Sun and P. Xie, J. Proteome Res., 2016, 15, 3784–3792 CrossRef CAS PubMed.
- Y. Yang, D. Yang, G. Tang, C. Zhou, K. Cheng, J. Zhou, B. Wu, Y. Peng, C. Liu, Y. Zhan, J. Chen, G. Chen and P. Xie, Neuroscience, 2013, 247, 191–200 CrossRef CAS PubMed.
- S. Bai, X. Zhang, Z. Chen, W. Wang, Q. Hu, Z. Liang, P. Shen, S. Gui, L. Zeng, Z. Liu, J. Chen, X. Xie, H. Huang, Y. Han, H. Wang and P. Xie, Sci. Rep., 2017, 7, 9591 CrossRef PubMed.
- Y. Hu, J. Zhou, L. Fang, H. Liu, Q. Zhan, D. Luo, C. Zhou, J. Chen, Q. Li and P. Xie, Neuroscience, 2013, 230, 1–12 CrossRef CAS PubMed.
- X. Han, W. Shao, Z. Liu, S. Fan, J. Yu, J. Chen, R. Qiao, J. Zhou and P. Xie, Neuroscience, 2015, 298, 220–292 CrossRef CAS PubMed.
- J. Zhou, Z. Liu, J. Yu, X. Han, S. Fan, W. Shao, J. Chen, R. Qiao and P. Xie, Int. J. Neuropsychopharmacol., 2015, 19(1), pyv100 CrossRef PubMed.
- Q. Mao, X. Gong, C. Zhou, Z. Tu, L. Zhao, L. Wang, X. Wang, L. Sun, J. Xia, B. Lian, J. Chen, J. Mu, D. Yang and P. Xie, Behav. Brain Res., 2017, 323, 38–46 CrossRef CAS PubMed.
- R. C. Bagot, H. M. Cates, I. Purushothaman, V. Vialou, E. A. Heller, L. Yieh, B. LaBonte, C. J. Pena, L. Shen, G. M. Wittenberg and E. J. Nestler, Biol. Psychiatry, 2017, 81, 285–295 CrossRef CAS PubMed.
- J. K. Nicholson, J. C. Lindon and E. Holmes, Xenobiotica, 1999, 29, 1181–1189 CrossRef CAS PubMed.
- Y. Wu, Y. Fu, C. Rao, W. Li, Z. Liang, C. Zhou, P. Shen, P. Cheng, L. Zeng, D. Zhu, L. Zhao and P. Xie, Behav. Brain Res., 2016, 308, 115–127 CrossRef CAS PubMed.
- Z. Liang, S. Bai, P. Shen, Q. Hu, X. Wang, M. Dong, W. Wang, J. Li, K. Cheng, S. Zhang, D. Zou, Y. Han, H. Wang and P. Xie, Behav. Brain Res., 2016, 314, 116–124 CrossRef CAS PubMed.
- J. Li, S. X. Zhang, W. Wang, K. Cheng, H. Guo, C. L. Rao, D. Y. Yang, Y. He, D. Z. Zou, Y. Han, L. B. Zhao, P. F. Li and P. Xie, Behav. Brain Res., 2016, 320, 12–20 CrossRef PubMed.
- S. Bai, C. Zhou, P. Cheng, Y. Fu, L. Fang, W. Huang, J. Yu, W. Shao, X. Wang, M. Liu, J. Zhou and P. Xie, Int. J. Mol. Sci., 2015, 16, 8490–8504 CrossRef CAS PubMed.
- H. Xu, J. He, J. S. Richardson and X. M. Li, J. Neurochem., 2004, 91, 1380–1388 CrossRef CAS PubMed.
- W. H. Shao, S. H. Fan, Y. Lei, G. E. Yao, J. J. Chen, J. Zhou, H. B. Xu, H. P. Liu, B. Wu and P. Zheng, Metabolomics, 2013, 9, 433–443 CrossRef CAS.
- A. E. Hoban, R. D. Moloney, A. V. Golubeva, K. A. McVey Neufeld, O. O'Sullivan, E. Patterson, C. Stanton, T. G. Dinan, G. Clarke and J. F. Cryan, Neuroscience, 2016, 339, 463–477 CrossRef CAS PubMed.
- A. Luedemann, K. Strassburg, A. Erban and J. Kopka, Bioinformatics, 2008, 24, 732–737 CrossRef CAS PubMed.
- D. A. Macintyre, B. Jiménez, E. J. Lewintre, C. R. Martín, H. Schäfer, C. G. Ballesteros, J. R. Mayans, M. Spraul, J. Garcíaconde and A. Pinedalucena, Leukemia, 2010, 24, 788–797 CrossRef CAS PubMed.
- J. Chen, C. Zhou, Z. Liu, Y. Fu, P. Zheng, D. Yang, Q. Li, J. Mu, Y. Wei and J. Zhou, J. Proteome Res., 2015, 14, 3382–3389 CrossRef CAS PubMed.
- J. J. Chen, C. J. Zhou, P. Zheng, K. Cheng, H. Y. Wang, J. Li, L. Zeng and P. Xie, Behav. Brain Res., 2017, 332, 280–287 CrossRef CAS PubMed.
- J. Xia, I. V. Sinelnikov, B. Han and D. S. Wishart, Nucleic Acids Res., 2015, 43, W251–W257 CrossRef CAS PubMed.
- J. Xia and D. S. Wishart, Nat. Protoc., 2011, 6, 743–760 CrossRef CAS PubMed.
- I. Lucki, Behav. Pharmacol., 1997, 8, 523–532 CrossRef CAS PubMed.
- F. Borsini and A. Meli, Psychopharmacology, 1988, 94, 147–160 CrossRef CAS PubMed.
- X. Khawaja, J. Xu, J. J. Liang and J. E. Barrett, NeurosciJ. Neurosci. Res., 2004, 75, 451–460 CrossRef CAS PubMed.
- C. McGrath and T. R. Norman, Psychopharmacology, 1998, 136, 394–401 CrossRef CAS PubMed.
- X. L. Liu, L. Luo, R. H. Mu, B. B. Liu, D. Geng, Q. Liu and L. T. Yi, Sci. Rep., 2015, 5, 16024 CrossRef CAS PubMed.
- S. Lapmanee, J. Charoenphandhu and N. Charoenphandhu, Behav. Brain Res., 2013, 250, 316–325 CrossRef CAS PubMed.
- R. C. Bagot, H. M. Cates, I. Purushothaman, Z. S. Lorsch, D. M. Walker, J. Wang, X. Huang, O. M. Schluter, I. Maze, C. J. Pena, E. A. Heller, O. Issler, M. Wang, W. M. Song, J. L. Stein, X. Liu, M. A. Doyle, K. N. Scobie, H. S. Sun, R. L. Neve, D. Geschwind, Y. Dong, L. Shen, B. Zhang and E. J. Nestler, Neuron, 2016, 90, 969–983 CrossRef CAS PubMed.
- Y. Ni, M. Su, J. Lin, X. Wang, Y. Qiu, A. Zhao, T. Chen and W. Jia, FEBS Lett., 2008, 582, 2627–2636 CrossRef CAS PubMed.
- S. F. Sleiman, H. Jeffrey, A. H. Rami, E. H. Lauretta, A. H. Edwina, S. Thomas, U. Devyani, S. S. Karuppagounder, E. B. Holson and R. R. Ratan, eLife, 2016, 5, e15092 Search PubMed.
- K. Marosi, S. W. Kim, K. Moehl, M. Scheibye-Knudsen, A. Cheng, R. Cutler, S. Camandola and M. P. Mattson, J. Neurochem., 2016, 139, 769 CrossRef CAS PubMed.
- P. Zheng, H.-C. Gao, Z.-G. Qi, J.-M. Jia, F. F. Li, J. J. Chen, Y. Wang, J. Guo, N. D. Melgiri and P. Xie, Metabolomics, 2012, 9, 688–696 CrossRef.
- J.-J. Chen, Z. Liu, S.-h. Fan, D.-y. Yang, P. Zheng, W.-h. Shao, Z.-g. Qi, X.-j. Xu, Q. Li and J. Mu, Sci. Rep., 2014, 4, 5855 CrossRef CAS PubMed.
| This journal is © The Royal Society of Chemistry 2017 |