
 Open Access Article
 This Open Access Article is licensed under a
 Creative Commons Attribution 3.0 Unported Licence
Study of the relationship between magnetic field and dielectric properties in two ferromagnetic complexes†
Li Yanga,
Jing Lia,
Tian-Cheng Pub,
Ming Konga,
Jing Zhanga and
You Song *a
*a
aState Key Laboratory of Coordination Chemistry, Collaborative Innovation Center of Advanced Microstructures, School of Chemistry and Chemical Engineering, Nanjing University, Nanjing 210093, China. E-mail: yousong@nju.edu.cn
bDepartment of Chemical and Biomolecular Engineering, John Hopkins University, Baltimore, Maryland 21218, USA
First published on 12th October 2017
Abstract
By changing metal ions in the existing [guest][MIIIMII(HCOO)6] framework, heterometallic formate frameworks formulated as [NH2(CH3)2][CrIIIFeII(HCOO)6] (1) and [NH2(CH3)2][CrIIINiII(HCOO)6] (2) were synthesized and characterized by single crystal X-ray diffraction, dielectric measurement and magnetic susceptibility measurement. Both complexes 1 and 2 exhibit long-range ferromagnetic ordering (LRO) at Curie temperatures of 15.3 (1) and 20.9 K (2) through ac magnetization susceptibility and zfc/fc measurements. Complex 1 possesses a hysteresis loop with Hc/Mr being 2.77 kOe/2.83 NμB. Measurements on the dielectric properties of 1 and 2 show an apparent dielectric response. Interestingly, the dielectric constants can be increased under an applied magnetic field.
Introduction
Multiferroic materials, a family of recently emerged complexes which display both magnetic and ferroelectric ordering, have attracted significant research attention due to their promising applications in many electronic devices such as storage elements, sensors, etc.1–13 Metal organic frameworks (MOFs) containing guest molecules or cations can be an excellent choice in the seeking of multiferroic materials. A typical class of these MOFs structurally resembles perovskite ABO3-type materials.1–6 Among this family of MOFs, metal formate frameworks are particularly interested since the HCOO− ion can mediate the ferro- or antiferromagnetic coupling between metal ions due to its small size. Their structures can be formulated as [{guest molecule or cation}{(metal ion)(formate)3}] and simplified as [guest][M(HCOO)3].14–21 Many of these metal formate frameworks have been discovered with interesting magnetic properties and rich ferroelectricity. Xiong et al. investigated the deuteration effect in the system of PD-DMACoF, where PD-DMA = perdeuterodimethylammonium. This complex was observed with second harmonic generation (SHG) effect below 151 K, magnetic hysteresis at 5 K and a first reported phase transition above room temperature at 319 K.22 Though the system of [guest][M(HCOO)3] frameworks with M = divalent cation has been extensively studied, the diversity in heterometallic and mixed-valence formate is still waiting to be discovered.Several years ago, a mixed-valence iron(III)–iron(II) formate ([DMFeFe]) was discovered, which exhibits temperature compensation behaviour as Néel N-type ferrimagnet.23,24 DMFeFe crystallizes in the niccolite type structure with the disordered cations located in the cages of the network. Following such work, Bu et al. reported rare asymmetric magnetization reversal in hysteresis loop in the same DMFeFe complex.17 Moreover, some complexes with ABO3-type perovskite structure as well as chiral- and niccolite-type structures display sequential structural phase transitions, which give insight on application prospects of this family of complexes.2,12,25–38 On the other hand, dielectricity can be a quite important property of the complexes but only a few studies on the dielectricity for these mixed-valence formate frameworks were reported.30–33 Materials with high dielectric constant greater than that of silicon nitride (ε′ > 7) are excellent choices for high performance capacitors and insulators and still require further investigation.39,40
Herein, in order to study formate frameworks as multifunctional materials, we have investigated the synthesis and characterization of the complexes: [NH2(CH3)2][CrIIIFeII(HCOO)6] (1) and [NH2(CH3)2][CrIIINiII(HCOO)6] (2), which exhibit ferromagnetic ordering. Complex 1 possesses a hysteresis loop with a large coercive field of 2.77 kOe. Two complexes display relatively high dielectric constants, stepwise temperature dependent behavior and obvious dielectric constants change under an applied magnetic field.
Experimental
Materials and instrumentation
All chemicals were commercially available and used as received without further purification. The C, H, N microanalyses were carried out with a PE 2400 series II elemental analyzer. The FT-IR spectra was recorded from KBr pellets in the range of 4000–500 cm−1 on a PE spectrum one FT-IR spectrometer. The metal ions were calculated with the molar ratio which could be proved by Optima 5300 DV ICP-OES system. Dielectric permittivity measurements were collected on Broad Band Dielectric Spectrometer. The diameter of sample pellets for dielectric measurement is 6 mm and the thickness is 0.5 mm. The crystal structure was determined by single-crystal X-ray diffraction and using SHELXS-97, SHELXL-97 software for structure solution and refinement, correspondingly. The data of magnetic properties for crystalline samples was collected on a Quantum Design MPMS-XL 7 superconducting quantum interference device (SQUID) magnetometer.Synthesis
![[thin space (1/6-em)]](https://www.rsc.org/images/entities/char_2009.gif) :1) was sealed in a Teflon-lined stainless steel vessel, heated at 140 °C for 120 hours under autogenous pressure, and then cooled to room temperature. Black-green crystals of 1 were harvested in about ∼68% yield based on metal salt. Anal. calc. for 1: C8H14CrFeNO12 (Mr = 424.04), calc.: C, 21.23; H, 3.12; N, 3.09%; found: C, 21.58; H, 3.24; N, 3.28%. ICP: Cr, 6.67; Fe, 7.38. Ratio of Cr:Fe = 1:1.03. IR data for 1 (KBr, cm−1): 3160 m, 1584 s, 1342 s 1019 w, 823 s, 431 s (s, strong; m, medium; w, weak).:Ni = 1:0.98. IR data for 2 (KBr, cm−1): 3160 m, 1584 s, 1342 s 1019 w, 823 s, 431 s (s, strong; m, medium; w, weak).
:1) was sealed in a Teflon-lined stainless steel vessel, heated at 140 °C for 120 hours under autogenous pressure, and then cooled to room temperature. Black-green crystals of 1 were harvested in about ∼68% yield based on metal salt. Anal. calc. for 1: C8H14CrFeNO12 (Mr = 424.04), calc.: C, 21.23; H, 3.12; N, 3.09%; found: C, 21.58; H, 3.24; N, 3.28%. ICP: Cr, 6.67; Fe, 7.38. Ratio of Cr:Fe = 1:1.03. IR data for 1 (KBr, cm−1): 3160 m, 1584 s, 1342 s 1019 w, 823 s, 431 s (s, strong; m, medium; w, weak).:Ni = 1:0.98. IR data for 2 (KBr, cm−1): 3160 m, 1584 s, 1342 s 1019 w, 823 s, 431 s (s, strong; m, medium; w, weak).Crystal structure determination
A suitable black-green block crystal with dimensions of 0.23 mm × 0.20 mm × 0.16 mm for 1 and black-green block crystal with dimensions of 0.19 mm × 0.18 mm × 0.15 mm for 2 were mounted on a glass fiber and the data was collected on a Bruker Smart Apex CCD diffractometer with graphite monochromated Mo-Kα radiation (λ = 0.71073 Å). Using the ω–θ scan mode in the range of 2.86° ≤ θ ≤ 27.49° (1) and 2.88° ≤ θ ≤ 27.52° (2). Raw frame data was integrated with the SAINT program. The structures were solved by direct methods using SHELXS-97 (ref. 41) and refined by full-matrix least-squares on F2 using SHELXS-97.42 An empirical absorption correction was applied with the program SADABS.43 All non-hydrogen atoms were refined anisotropically. All hydrogen atoms were positioned geometrically and refined as riding. Calculations and graphics were performed with SHELXTL.42 The crystallographic details are provided in Table 1. Selected bond distances and angles for 1 and 2 are listed in Tables S1 and S2.† Crystallographic data for the structural analysis have been deposited with the Cambridge Crystallographic Data Center (CCDC reference numbers: 1536009(1) and 1539328(2)).| Complex | 1 | 2 |
|---|---|---|
| Mol. form. | C8H14CrFeNO12 | C8H14CrNiNO12 |
| Form. weight | 424.04 | 426.89 |
| T/K | 296(2) | 296(2) |
| Color and form | Black, block | Black-green, block |
| Crystal system | Trigonal | Trigonal |
| Space group | P![[3 with combining macron]](https://www.rsc.org/images/entities/char_0033_0304.gif) 1c(163) 1c(163) |
P1c(163) |
| a/Å | 8.2353(4) | 8.1651(3) |
| b/Å | 8.2353(4) | 8.1651(3) |
| c/Å | 13.7385(13) | 13.5314(10) |
| α/° | 90.00 | 90.00 |
| β/° | 90.00 | 90.00 |
| γ/° | 120.00 | 120.00 |
| V/Å3 | 806.92(9) | 781.26(7) |
| Z | 2 | 2 |
| F(000) | 446 | 450 |
| Dcalcd/g cm−3 | 1.836 | 1.908 |
| μ/mm−1 | 1.64 | 1.97 |
| θ Range/° | 2.86 to 27.49 | 2.88 to 27.52 |
| Ref. coll./unique | 6941/632 | 6423/613 |
| Rint | 0.0265 | 0.0314 |
| Completeness | 99.8% | 100% |
| Parameters | 40 | 40 |
| GOF | 1.172 | 1.244 |
| R1 [I ≥ 2σ(I)] | 0.0282 | 0.0339 |
| wR2 (all data) | 0.0913 | 0.0905 |
| Residues/e Å−3 | 0.198 and −0.728 | 0.312 and −0.949 |
Results and discussion
Description of crystal structure
Single-crystal X-ray structure analysis reveals that complex 1 crystallized in the trigonal space group P1c, as observed in many other metal formate series,17,18 which contains one unique η2-formate anion that bridges two metal ions CrIII and FeII to form a framework (Fig. 1a). The framework is similar to structures of niccolite NiAs and colquiriite Li–CaAlF6.44 The metal ions are all in octahedral environment coordinated by six oxygen atoms from six formate anions. The two inhomogeneous metal atoms in the asymmetric unit were distinguished by the bond lengths. The CrIII–O bonds lengths in 1 are 1.9796 Å, meanwhile the FeII–O bonds lengths are 2.1174 Å. The assignment of CrIII and FeII ion was supported by bond valence calculations.45,46 The three-dimensional structure (Fig. 1a) consists of two kinds of octahedral 6-connected metal nodes, (49·66) and (412·63) for Cr1 and Fe1, respectively, linked by anti–anti formate ligands. The Me2NH2+ cations are located in cavities of the network. The Fe1 node is in a spatial arrangement of an octahedron (Fig. 1b), while the Cr1 node is in a spatial arrangement of trigonal prism (Fig. 1c). The framework is composed of waved sheets linked by intersheet formate bridges (Fig. 1d). In the wavy sheet, Cr1 ions lie at the peaks and troughs while Fe1 ions are located in between.
 | ||
| Fig. 1 (a) Coordination and linkage modes in the complexes. (b) The local coordination environment of the (412·63) node, Fe1, and (c) that of the (49·66) node, Cr1, viewed down the c axis. Note the difference in the spatial arrangement of the neighboring Cr3+ and Fe2+ ions. (d) 3D space-filling view of the [NH2(CH3)2][CrIIIFeII(HCOO)6] framework with the cations filled in the cavities. | ||
In the framework, Fe1 links only Cr2 and vice versa. The unique formate-bridged Cr1⋯Fe1 distance is 5.865 Å.
The MO6 octahedron is distorted with cis O–Cr–O angles of 88.92–91.08°, trans O–Cr–O angles of 180°, cis O–FeII–O angles of 85.09–93.10°, and trans O–FeII–O angles of 177.48–180.00°. Introducing FeII ion does not change the basic construction of this kind of MOFs, so the interatomic distances of M–O and M⋯M of 1 are in good agreement with those in the reported mixed-valence formate complexes.30 Complexes 1 and 2 are isostructural only with different MII ions. So herein, the structure of 2 is not described any more.
Magnetic studies
The plots of the temperature dependence of the magnetic susceptibilities of 1 and 2, measured under applied magnetic fields of 2000 Oe, are shown in Fig. 2 in the form of χMT. The χMT values at 300 K are 5.95 (1) and 3.08 cm3 K mol−1 (2), respectively. Among them, the χMT value of the complex 2 was slightly higher than the spin-only value 2.875 cm3 K mol−1 of magnetically non-interacting chromium(III) (S = 3/2, g = 2) and the nickel(II) (S = 1, g = 2) metal ions. However, the χMT value of complex 1 is much larger than the spin-only value 4.875 cm3 K mol−1 of spin-only chromium(III) (S = 3/2, g = 2) and the isolated high-spin iron(II) (S = 2, g = 2) with the orbital degeneracy and spin–orbit coupling effects contribute of the octahedral high-spin iron(II).14,15 | ||
| Fig. 2 Plots of χMT versus T under 2000 Oe field. Inserted graph is the curve with χMT and T axes are in logarithmic scale for easy observation of the variation in the low-temperature region for 1 and 2. | ||
The temperature dependence of reciprocal susceptibility χM−1 above 60 K follows the Curie–Weiss law [χ = C/(T − θ)] (Fig. S1 and S2, ESI†), giving Curie (cm3 K mol−1)/Weiss (K) constants of: 5.98/0.33 (1) and 3.02/25.13 (2), without considering the spin–orbit coupling contribution. The Curie constants can derive Land g factors of 2.22 and 2.04 for 1 and 2, respectively. The g factor of 2 is in good agreement with isotropic Ni2+,14–16 while that of 1 is slightly larger just for the spin–orbit coupling effect of the high spin Fe2+.14,15 The significant positive Weiss constants show ferromagnetic exchange interactions between the nearest–neighbor metal ions, and this is expected for an anti–anti mode of coordination by the formate bridges.17,18,47
The shape of two curves is similar but there are some differences between 1 and 2 due to the different metal ions. For 1, χMT value first slowly increases from 300 K to 70 K, then rapidly increases to the maximum of 55.68 cm3 K mol−1 at 10.01 K and decreased to 15.00 cm3 K mol−1 at 1.8 K. For 2, the χMT value slowly increases from 300 K to 35 K and displays a sharp rise to a maximum of 130.76 cm3 K mol−1 at 16.00 K, and then decreases to 18.33 cm3 K mol−1 at 1.8 K. The maximum of χMT value is much larger than that of 1 although the spin of carriers in 2 is lower than in 1, indicating complex 2 generates the larger magnetized domain. In the low-temperature region, the χMT values of the two complexes rise up quickly to maxima, and finally go down upon cooling, thus suggesting the presence of spontaneous magnetization due to the magnetic long-range ordering (LRO). The sequence of the magnetic-ordering temperature is 1 < 2.
All these observations are similar to the known metal-formate perovskites.17,18 To confirm the conclusion above for the two complexes, we further measured the zero-field-cooling (zfc) and field-cooling (fc) magnetizations under a low magnetic field (Fig. 3), alternating current (ac) susceptibilities at 10 Hz for 1, 1000 Hz for 2 (Fig. 4), and isothermal magnetizations (Fig. 5 and S3†). Under 1 Oe field (Fig. 3), the two curves of zfc/fc are superposed at higher temperatures. They increase abruptly and then diverge indicating long-range magnetic ordering. The ordered temperatures, determined by the positions of the negative peak on the derivative dM/dT (M = magnetization) of fc data, are 15.26 (1) and 20.93 K (2).
 | ||
| Fig. 3 The zfc/fc plots of the two complexes under 1 Oe field. | ||
 | ||
| Fig. 4 ac susceptibility data at 10 Hz (1) and 1000 Hz (2) in zero static field, in (a) χ′ versus T and (b) χ′′ versus T. | ||
 | ||
| Fig. 5 Isothermal magnetization plots of 1 and 2 at 2.0 K. | ||
The temperature dependences of the ac susceptibilities obtained under zero direct current (dc) field (Fig. 4) for the two complexes. They all display peaks in both the in-phase (χ′) and out-of-phase (χ′′) responses. Frequency-independent peak in χ′′ were observed at 15.50 K for 1. Complex 2 displays the weak ac responses but frequency-independent peak for χ′′ at 21.00 K was clear. Therefore, the ac studies confirmed the LRO of ferromagnetism of the two complexes.
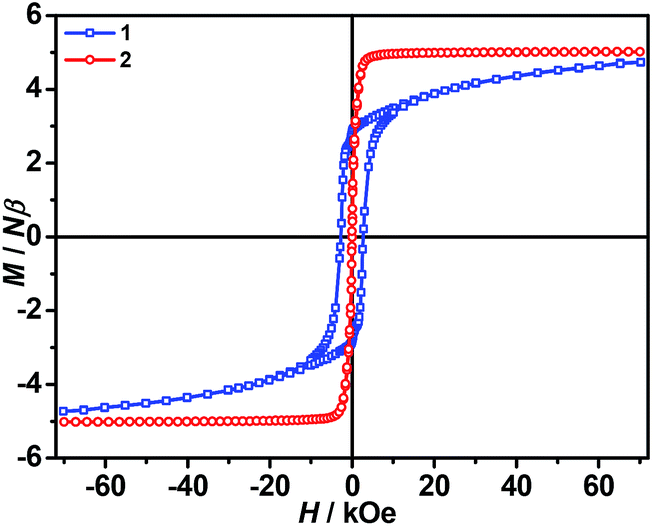
The isothermal magnetizations at 2.0 K for 1 and 2 (Fig. 5 and S3) have been measured. Only 1 displays hysteresis loop with Hc/Mr being 2.77 kOe/2.83 NμB. In complex 1, the magnetization sharply increases to 3.33 NμB in 8.42 kOe, and then slowly climbs up to 4.72 NμB in 70 kOe. Obviously, the magnetization does not reach saturation of g(SFe + SCr) = 2 × (2 + 3/2) = 7 NμB even not considering the orbital contribution. According to the shape of curve, it is believed that there exists the strong magnetic anisotropy. Regrettably, we did not obtain the big enough single crystals for the physical measurement. Complex 2 is easier to be magnetized than 1. In low field, the magnetization of 1 suddenly increases and is immediately saturated at 4.91 NμB in 6.0 kOe. Above this field, the magnetization almost keeps a constant, which is equal to the ferromagnetic spin ground state with g(SNi + SCr) = 2 × (1 + 3/2) = 5 NμB.
To further understand the magnitude of the magnetic coupling of 1 and 2 between CrIII and divalent metal ion (FeII, NiII), the CrIII–MII magnetic couplings through the formate bridge can be estimated by using the molecular field result, J/kB = 3θ/[2ZS(S + 1)]. The values are JCrFe = 0.11 cm−1 for 1 and JCrNi = 0.28 cm−1 for 2. Here, we can see the values of J are JCrNi > JCrFe, because the magnetic orbital of CrIII (t2g) and NiII (eg) ions are completely orthogonal but the ferromagnetic coupling between CrIII and FeII ions is partly cancelled out by the overlapping magnetic orbitals of CrIII (t2g) and FeII (t2g) ions. The coupling between the metals leads to a ferromagnetic state with J > 0 different from the antiferromagnetic coupled sublattices, which are noncompensated and lead to a ferrimagnetic state.23,24 Moreover, it should be noted that the ordering temperature of 2 containing nickel ions (20.93 K) is slightly higher than the ordering temperatures of some related complexes with two magnetic sublattices, which is mainly due to the slightly strong coupling interaction and is consistent with molecular field theory.
Dielectric properties
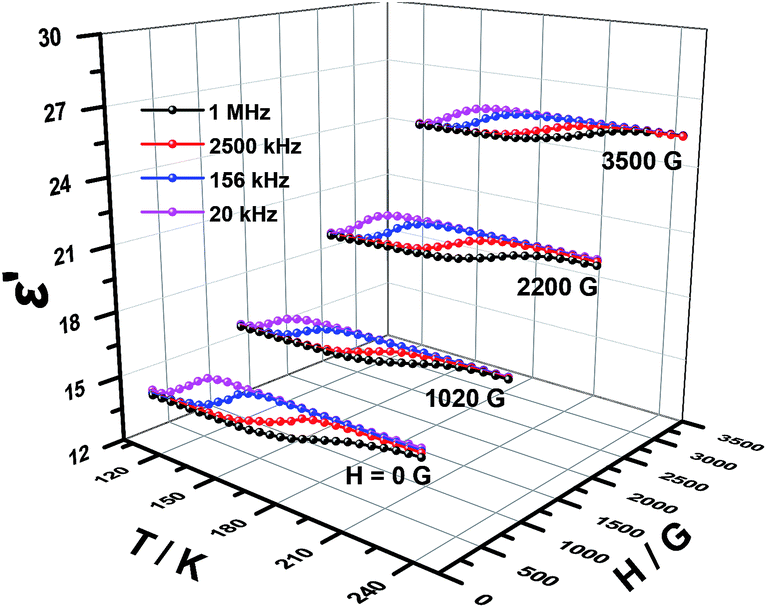
Dielectric permittivity of 1 and 2 with and without an external magnetic field were measured using the sample obtained by tableting and depicted in Fig. 6, 7, S4 and S5,† where the complex dielectric constant ε = ε′ − iε′′, and ε′ and ε′′ are the real and imaginary parts of ε. The model of the measurements under an applied magnetic field is shown in Fig. S6.† For 1 without field, the real component ε′ of permittivity (Fig. 6) exhibits a step-like increase from 146 K to 214 K and the broad step-like maximum shifts to higher temperatures with increasing frequency. These phenomena are consistent with the temperature-dependent IR spectra of complex 1 (Fig. S7†) and similar to the spectra of chromium analogs,27 so can be attributed to the polarization of disordered DMA+. The changes are observed for the bands appear in the region 3060–3145 cm−1 resulting from the N–H stretching modes and the weak bands in the 1431–1469 cm−1 range from the δ (CH3) modes.31,48 From 20 kHz to 1 MHz, the characteristic relaxor behavior of the dielectric permittivity can be observed with a relaxation of approximately 70 K. Applied a magnetic field, the shape of the ε′ curves is not changed. Interestingly, the dielectric constant values are totally increased. The stronger the magnetic field, the larger the dielectric constant values (Fig. 6). We have searched for the interpretation of this kind of behavior in reference, but there is no any report about it until now.3,49 In our opinion, it may be a new physical phenomenon. The mechanism should be much complicated but it still urges us to give a tentative analysis. To the best of our knowledge, the cases that the magnetic field affect charges include three possibilities, Lorenian force, slight change of structure for paramagnetic complexes and Hall effect.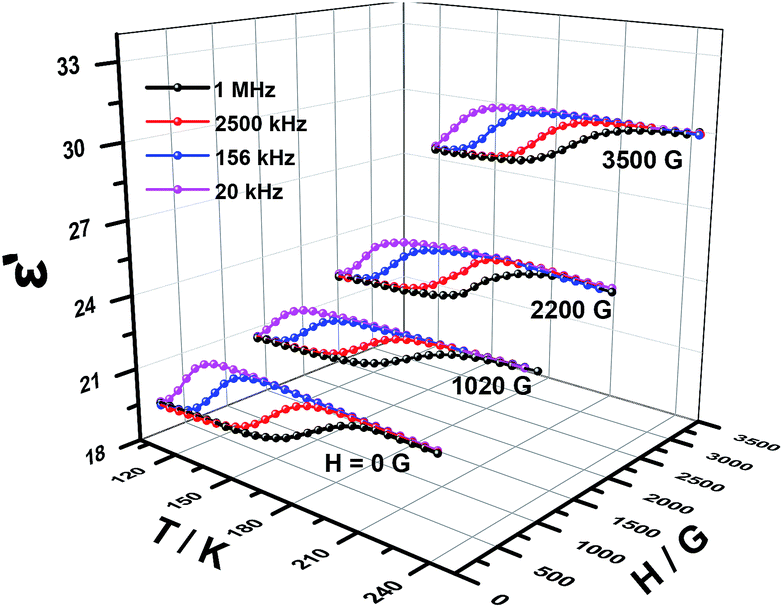 | ||
| Fig. 6 Temperature dependence of the real ε′ part of the dielectric permittivity for 1 under different magnetic field. | ||
 | ||
| Fig. 7 Temperature dependence of the real ε′ part of the dielectric permittivity for 2 under different magnetic field. | ||
A dielectric material is an electrical insulator so the electric charges cannot flow through the material when an electric field is applied. However, the electric charges can still shift from their original positions and form an electric double layer, named as polarization. During the dielectric relaxation, a displacement current produced. When a perpendicular magnetic field is applied, the moving electric charges will be strongly affected by the Lorenian force. However, we applied a parallel magnetic field to the electric field for the measurement, so the electrons within material were not affected by Lorenian force, which do not provide the contribution for the enrichment of charges in the electric double layer. Except the electrons within material, the space charges can usually increase the ferroelectric polarization or dielectric constants and are influenced by magnetic field. The space charge depends on the non-homogeneous media with such as crystal boundary, phase boundary, lattice distortion, and so on. But, the space charge appears in the low-frequency region, which is inconsistent with the results in Fig. 6 and 7. We cannot figure out the relation between space charge and magnetic field, namely, the magnetic field cannot increase the number of space charge.
The second reason is that the paramagnetic ions may shift under magnetic field. Complex 1 shows a quite rigid 3D structure and the applied field is not strong enough. We exclude this possibility in this experimental and it is regrettable that there is no such instrument at present internationally for measuring the single crystal structure under a magnetic field.
The third one is Hall effect, which is a phenomenon that electric current of materials is strongly related to the external magnetic field. Perpendicular to both directions of current and magnetic field, the Hall current will produce and possibly enriches the electric charge in its perpendicular direction. Similarly, we did not apply two perpendicular electric and magnetic fields. However, we noted that the applied magnetic field is very low and not uniform, which may leads to a component of magnetic lines of force perpendicular to the current direction further increase the enrichment of electric charge. According to our analyses, it will be a challenging work for illuminating above behavior. The corresponding investigations are in progress in our group on the factors about magnitude and direction of magnetic field.


 | (1) |
For 2, the similar dielectric response (Fig. 7) was observed with the step-like increase from 149 K to 223 K and the relaxation of 75 K. Also similarly, an external magnetic field induced the increase of the dielectric constants as shown in Fig. 7. We suggest that the phenomenon of magnetic field-induced dielectric properties may be ubiquitous in the dielectric materials but not only in multiferroics with both ferromagnet and ferroelectric.
At the same time, the frequency dependence of the imaginary permittivity has been discussed (Fig. S8 and S9†). The ε′′ exhibits one relaxation peak characteristic of dipolar relaxation. The relaxation peaks shifted towards higher frequencies with increasing temperature. The imaginary part ε′′ as a function of alternating-current (ac) frequency exhibits a broad peak in the high frequencies just where the ε′ drops most steeply. This behavior is characteristic of a Debye-like dielectric relaxation, in which the reorientation of dipoles cannot respond to the applied ac electric field when high frequency exceeds a relaxation rate 1/τ (where τ is the relaxation time) and it can be expressed as function (1). This characteristic also can be seen in the disorder–order-type complexes, such as NaNO2 and nitric acid glycine.50
The temperature dependence of resulted relaxation times in the case of external field and no field (Fig. 8 and S10–12†) were fitted to the Arrhenius law of τ = τ0exp(Ea/kBT), the activity energy Ea and relaxation time τ0 are calculated to be 0.0163 eV, 1.47 × 10⁻¹³ s and 0.0182 eV, 5.60 × 10⁻¹⁴ s for 1 and 2, respectively. Under an applied magnetic field of 1020 G, 2200 G and 3500 G, the activity energy Ea and relaxation time τ0 for 1 and 2 are listed in the Table 2. From the activity energy Ea and relaxation time τ0, we can see the relaxation of complexes 1 and 2 is similar but with the slight difference. Under a magnetic field, Ea of complexes 1 and 2 become smaller and τ0 become longer. The stronger the magnetic field, the lower the activation energy and the longer the relaxation time, which shows that an applied magnetic field has a certain effect on the relaxation behavior of the complexes. The relaxational mechanisms can be justified by the information of ε′′ (ε′) data (Fig. S13†) and the relaxational process is consistent with characteristic behavior of the dielectric permittivity in Fig. 6 and 7. The above results indicate that the dielectric properties of the complexes are attributed to the molecular local dipole moment. The different bivalent metal ions, FeII and NiII in complexes 1 and 2, respectively, make the bond lengths different, FeII–O = 2.1174 Å and NiII–O = 2.0530 Å. Therefore, the volume of crystal cell for 1 is larger than that for 2 and results in the dipole moment of 1 is larger, further leads to higher dielectric constant, which is consist with the result of the dielectric measurement.
 | ||
| Fig. 8 Arrhenius plots of ln(τ) vs. the inverse temperature T−1 for 1 and 2. Red lines show the fit of data to the Arrhenius expression τ = τ0exp(Ea/kBT). | ||
| Complex | τ0/s | Ea/eV | Complex | τ0/s | Ea/eV |
|---|---|---|---|---|---|
| 1 (0 G) | 1.47 × 10⁻¹³ | 0.0163 | 1 (1020 G) | 1.84 × 10⁻¹³ | 0.0157 |
| 2 (0 G) | 5.60 × 10⁻¹⁴ | 0.0182 | 2 (1020 G) | 7.90 × 10⁻¹⁴ | 0.0178 |
| 1 (2200 G) | 2.48 × 10⁻¹³ | 0.0158 | 1 (3500 G) | 4.00 × 10⁻¹³ | 0.0154 |
| 2 (2200 G) | 1.05 × 10⁻¹³ | 0.0176 | 2 (3500 G) | 2.04 × 10⁻¹³ | 0.0169 |
Conclusions
Two metal formate frameworks of [NH2(CH3)2][CrIIIMII(HCOO)6] [M = Fe (1), Ni (2)] have been successfully synthesized by introducing the trivalent chromium ion into the niccolite structure framework. The complexes crystalized in anionic metal-formate frameworks in which the anti–anti formate ligands linked the octahedrally coordinated metal ions, while the disordered Me2NH2+ cations are located in the cage of the framework. Complexes 1 and 2 exhibit LRO of ferromagnetism occurred at the Curie temperatures of 15.3 (1) and 20.9 K (2), respectively. Complex 1 possesses a hysteresis loop with Hc/Mr being 2.77 kOe/2.83 NμB. Dielectric measurement reveals that the dielectric constant curves show step like shapes, which can be attributed to the dynamics of DMA+ cations inside the cavities. Moreover, we found that the dielectric constants of the two complexes can be increased under an external magnetic field. With the increase of magnetic field, the larger the dielectric constants. We provide three possible reasons leading to this kind of phenomenon, further research will be focused on studying the origin of the magnetic field-induced dielectric properties or the possible magnetoelectric effects.Conflicts of interest
There are no conflicts to declare.Acknowledgements
This work was supported by Major State Basic Research Development Program (2013CB922102), National Natural Science Foundation of China (21571097 and 91622115) and a Project Funded by the Priority Academic Program Development of Jiangsu Higher Education Institutions.Notes and references
- P. Jain, N. S. Dalal, B. H. Toby, H. W. Kroto and A. K. Cheetham, J. Am. Chem. Soc., 2008, 130, 10450 CrossRef CAS PubMed.
- P. Jain, V. Ramachandran, R. J. Clark, H.-D. Zhou, B. H. Toby, N. S. Dalal, H. W. Kroto and A. K. Cheetham, J. Am. Chem. Soc., 2009, 131, 13625 CrossRef CAS PubMed.
- H.-B. Cui, Z.-M. Wang, K. Takahashi, Y. Okano, H. Kobayashi and A. Kobayashi, J. Am. Chem. Soc., 2006, 128, 15074 CrossRef CAS PubMed.
- M. Maczka, A. Pietraszko, B. Macalik and K. Hermanowicz, Inorg. Chem., 2014, 53, 787 CrossRef CAS PubMed.
- Z.-M. Wang, K.-L. Hu, S. Gao and H. Kobayashi, Adv. Mater., 2010, 22, 1526 CrossRef CAS PubMed.
- G.-C. Xu, X.-M. Ma, L. Zhang, Z.-M. Wang and S. Gao, J. Am. Chem. Soc., 2010, 132, 9588 CrossRef CAS PubMed.
- W. Zhang, H.-Y. Ye, H.-L. Cai, J.-Z. Ge, R.-G. Xiong and S.-P. D. Huang, J. Am. Chem. Soc., 2010, 132, 7300 CrossRef CAS PubMed.
- Y.-Z. Tang, Y.-M. Yu, J.-B. Xiong, Y.-H. Tan and H.-R. Wen, J. Am. Chem. Soc., 2015, 137, 13345 CrossRef CAS PubMed.
- D.-W. Fu, W. Zhang, H.-L. Cai, Y. Zhang, J.-Z. Ge, R.-G. Xiong and S.-P. D. Huang, J. Am. Chem. Soc., 2011, 133, 12780 CrossRef CAS PubMed.
- T. Hang, W. Zhang, H.-Y. Ye and R.-G. Xiong, Chem. Soc. Rev., 2011, 40, 3577 RSC.
- W. Zhang, H.-Y. Ye and R.-G. Xiong, Coord. Chem. Rev., 2009, 253, 2980 CrossRef CAS.
- M. Maczka, A. Gagor, M. Ptak, W. Paraguassu, T. A. da Sliva, A. Sieradzki and A. Pikul, Chem. Mater., 2017, 29, 2264 CrossRef CAS.
- Y. Tian, S.-P. Shen, J.-Z. Cong, L.-Q. Yan, S.-G. Wang and Y. Sun, J. Am. Chem. Soc., 2016, 138, 782 CrossRef CAS PubMed.
- K.-L. Hu, M. Kurmoo, Z. Wang and S. Gao, Eur. J. Inorg. Chem., 2009, 15, 12050 CAS.
- M.-Y. Li, M. Kurmoo, Z.-M. Wang and S. Gao, Chem.–Asian J., 2011, 6, 3084 CrossRef CAS PubMed.
- B. Liu, R. Shang, K.-L. Hu, Z.-M. Wang and S. Gao, Inorg. Chem., 2012, 51, 13363 CrossRef CAS PubMed.
- J.-P. Zhao, B.-W. Hu, F. Lloret, J. Tao, Q. Yang, X.-F. Zhang and X.-H. Bu, Inorg. Chem., 2010, 49, 10390 CrossRef CAS PubMed.
- M. Maczka, A. Gagor, B. Macalik, A. Pikul, M. Ptak and J. Hanuza, Inorg. Chem., 2014, 53, 457 CrossRef CAS PubMed.
- N. Abhyankar, J. J. Kweon, M. Orio, S. Bertaina, M. Lee, E. S. Choi, R. Q. Fu and N. S. Dalal, J. Phys. Chem. C, 2017, 121, 6314 CAS.
- G. Kieslich, A. C. Forse, S. Sun, K. T. Butler, S. Kumagai, Y. Wu, M. R. Warren, A. Walsh, C. P. Grey and A. K. Cheetham, Chem. Mater., 2016, 28, 312 CrossRef CAS.
- N. L. Evans, P. M. M. Thygesen, H. L. B. Bostrom, E. M. Reynolds, I. E. Collings, A. E. Phillips and A. L. Goodwin, J. Am. Chem. Soc., 2016, 138, 9393 CrossRef CAS PubMed.
- D.-W. Fu, W. Zhang, H.-L. Cai, Y. Zhang, J.-Z. Ge, R.-G. Xiong, S.-P. D. Huang and T. Nakamura, Angew. Chem., Int. Ed., 2011, 50, 11947 CrossRef CAS PubMed.
- K. S. Hagen, S. G. Naik, B. H. Huynh, A. Masello and G. J. Christou, J. Am. Chem. Soc., 2009, 131, 7516 CrossRef CAS PubMed.
- Y.-Q. Tian, S.-Y. Yao, Y.-J. Guo, Y. Song and G. Zhang, Chin. J. Inorg. Chem., 2010, 26, 385 CAS.
- L. C. Gomez-Aguirre, B. Pato-Doldan, J. Mira, S. Castro-Garcia, M. A. Senaris-Rodriguez, M. Sanchez-Andujar, J. Singleton and V. S. Zapf, J. Am. Chem. Soc., 2016, 138, 1122 CrossRef CAS PubMed.
- G.-C. Xu, W. Zhang, X.-M. Ma, Y.-H. Chen, L. Zhang, H.-L. Cai, Z.-M. Wang, R.-G. Xiong and S. Gao, J. Am. Chem. Soc., 2011, 133, 14948 CrossRef CAS PubMed.
- M. Maczka, A. Pietraszko, A. Pikul and K. Hermanowicz, J. Solid State Chem., 2016, 233, 455 CrossRef CAS.
- J.-P. Zhao, S.-D. Han, X. Jiang, S.-J. Liu, R. Zhao, Z. Chang and X.-H. Bu, Chem. Commun., 2015, 51, 8288 RSC.
- L. Mazzuca, L. Canadillas-Delgado, J. A. Rodriguez-Velamazan, O. Fabelo, M. Scarrozza, A. Stroppa, S. Picozzi, J.-P. Zhao, X.-H. Bu and J. Rodriguez-Carvajal, Inorg. Chem., 2017, 56, 197 CrossRef CAS PubMed.
- A. Ciupa, M. Maczka, A. Gagor, A. Sieradzki, J. Trzmiel, A. Pikul and M. Ptak, Dalton Trans., 2015, 44, 8846 RSC.
- A. Sieradzki, S. Pawlus, S. N. Tripathy, A. Gagor, A. Ciupa, M. Maczka and M. Paluch, Phys. Chem. Chem. Phys., 2016, 18, 8462 RSC.
- M. Maczka, A. Ciupa, A. Gagor, A. Sieradzki, A. Pikul and M. Ptak, J. Mater. Chem. C, 2016, 4, 1186 RSC.
- J.-P. Zhao, J. Xu, S.-D. Han, Q.-L. Wang and X.-H. Bu, Adv. Mater., 2017, 29, 1606966 CrossRef PubMed.
- D. Di Sante, A. Stroppa, P. Jain and S. Picozzi, J. Am. Chem. Soc., 2013, 135, 18126 CrossRef CAS PubMed.
- M. Ptak, A. Gagor, A. Sieradzki, B. Bondzior, P. Deren, A. Ciupa, M. Trzebiatowska and M. Maczka, Phys. Chem. Chem. Phys., 2017, 19, 12156 RSC.
- B. Saparov and D. B. Mitzi, Chem. Rev., 2016, 116, 4558 CrossRef CAS PubMed.
- R. Shang, S. Chen, K.-L. Hu, B.-W. Wang, Z.-M. Wang and S. Gao, Chem.–Eur. J., 2016, 22, 6199 CrossRef CAS PubMed.
- M. Maczka, A. Ciupa, A. Gagor, A. Sieradzki, A. Pikul, B. Macalik and M. Drozd, Inorg. Chem., 2014, 53, 5260 CrossRef CAS PubMed.
- Y.-Z. Tang, X.-F. Huang, Y.-M. Song, P.-W. Hong Chan and R.-G. Xiong, Inorg. Chem., 2006, 45, 4868 CrossRef PubMed.
- Q. Ye, Y.-M. Song, G.-X. Wang, K. Chen, D.-W. Fu, P.-W. Hong Chan, J.-S. Zhu, S.-P. D. Huang and R.-G. Xiong, J. Am. Chem. Soc., 2006, 128, 6554 CrossRef CAS PubMed.
- G. M. Sheldrick, Acta Crystallogr., Sect. A: Found. Adv., 2015, 71, 3 CrossRef PubMed.
- G. M. Sheldrick, Acta Crystallogr., Sect. C: Cryst. Struct. Commun., 2015, 71, 3 CrossRef PubMed.
- L. Krause, R. Herbst-Irmer, G. M. Sheldrick and D. Stalke, J. Appl. Crystallogr., 2015, 48, 3 CAS.
- S. Kuze, D. d. Boulay, N. Ishizawa, N. Kodama, M. Yamaga and B. Henderson, J. Solid State Chem., 2004, 177, 3505 CrossRef CAS.
- D. Altermatt and I. D. Brown, Acta Crystallogr., Sect. B: Struct. Sci., 1985, 41, 244 CrossRef.
- D. Brown, Chem. Rev., 2009, 109, 6858 CrossRef PubMed.
- S. Chen, R. Shang, K.-L. Hu, Z.-M. Wang and S. Gao, Inorg. Chem. Front., 2014, 1, 83 RSC.
- M. Ptak, M. Mączka, A. Gągor, A. Sieradzki, A. Stroppa, D. D. Sante, J. M. Perez-Mato and L. Macalik, Dalton Trans., 2016, 46, 2574 RSC.
- J.-B. Guo, L.-H. Chen, D. Li, H.-X. Zhao, X.-W. Dong, L.-S. Long, R.-B. Huang and L.-S. Zheng, Appl. Phys. Lett., 2017, 110, 192902 CrossRef.
- P. Ravindran, A. Delin, B. Johansson, O. Eriksson and J. M. Wills, Phys. Rev. B: Condens. Matter Mater. Phys., 1999, 59, 1776 CrossRef CAS.
Footnote |
| † Electronic supplementary information (ESI) available: Selected bond lengths and angles, magnetic characterizations, dielectric characterizations and X-ray crystallographic files in CIF format for 1 and 2. CCDC 1536009 for 1 and 1539328 for 2. For ESI and crystallographic data in CIF or other electronic format see DOI: 10.1039/c7ra08695d |
| This journal is © The Royal Society of Chemistry 2017 |