 Open Access Article
Creative Commons Attribution 3.0 Unported Licence
Reverse microemulsion prepared Ni–Pt catalysts for methane cracking to produce COx-free hydrogen†
Lu Zhou *ab,
Moussab Harb
 b,
Linga Reddy Enakondab,
Noor AlMana
 b,
Mohamed Nejib Hedhilic and
Jean Marie Basset
 *b
*b
aKey Laboratory of Flexible Electronics (KLOFE), Institute of Advanced Materials (IAM), Jiangsu National Synergetic Innovation Center for Advanced Materials (SICAM), Nanjing Tech University, 30 South Puzhu Road, Nanjing 211816, China
bKAUST Catalysis Center, King Abdullah University of Science and Technology, Thuwal 23955-6900, Saudi Arabia. E-mail: lu.zhou@kaust.edu.sa; jeanmarie.basset@kaust.edu.sa
cCore Lab, King Abdullah University of Science and Technology, Thuwal 23955-6900, Saudi Arabia
First published on 8th September 2017
Abstract
A monodispersed 15 nm Ni9Pt1 catalyst synthesized via a reverse microemulsion method, shows a lower activation energy than both Ni and Pt catalysts during the methane cracking reaction. Thanks to the synergic effect of Ni–Pt alloy, this catalyst presents a stable H2 formation rate at 700 °C, and forms carbon nanotubes, anchoring the catalyst particles on top.
Although supported nickel-based catalysts are mostly studied to show good methane cracking reactivity,1 the formation of low levels of CO by the interaction of cracked surface “carbon” with the “oxygen” from supported catalysts is unavoidable.2,3 According to Choudhary et al.,2 during a 300 minute methane cracking reaction over a 10% Ni/SiO2 catalyst at 550 °C, 50–250 ppm CO was continuously formed. They related this CO formation to the amount/stability of the surface hydroxyl group on the supports. N. Muradov et al.4 reported a good methane cracking activity on activated carbon catalysts at 850 °C, but they also found that carbon–oxygen functional surface groups such as R–COOH, R–OCO, R–OH and R
![[double bond, length as m-dash]](https://www.rsc.org/images/entities/char_e001.gif) O resulted in CO formation. For the original activated carbon catalysts, an effluent gas with an initial CO concentration of 0.77 vol% was reported. Therefore, a catalyst that does not provide any “O” is urgently required to decompose methane into COx-free hydrogen and high value-added graphitic nano carbons.
O resulted in CO formation. For the original activated carbon catalysts, an effluent gas with an initial CO concentration of 0.77 vol% was reported. Therefore, a catalyst that does not provide any “O” is urgently required to decompose methane into COx-free hydrogen and high value-added graphitic nano carbons.
As an approach, methane cracking over unsupported bulk nickel-based catalysts are proposed by few researchers in Table 1. The bulk catalysts activity in term of hydrogen yield is remarkably lower than that of supported catalysts, which is probably resulted from the severe agglomeration of bulk nickel particles at high reaction temperatures. Noble metal additives are reported to stabilize supported nickel catalysts and thus to improve both activity and stability during methane cracking,12,13 but surprisingly no such literature can be found for bulk nickel catalysts. In present study, a series of platinum doped bulk nickel catalysts with different component and size were synthesized to study their reactivity under different reaction conditions, with the aim of designing a robust bulk nickel-based methane cracking catalyst.
| Catalyst | Reaction condition | H2 yield [L min−1 gcat−1] | Carbon |
|---|---|---|---|
| a CNF: carbon nano fibre.b CNT: carbon nano tube.c CNO: carbon nano onion. | |||
| NiO5 | 500 °C, pure CH4 | 0.28 | CNFa |
| Ni-RANEY®6 | 600 °C, 10% CH4/N2 | 0.04 | CNF, CNTb |
| NiCuCo7 | 750 °C, 25% CH4/N2 | 0.16 | CNT, CNOc |
| NiO8 | 750 °C, pure CH4 | 0.45 | CNT, CNO |
| NiFe2O4 (ref. 9) | 900 °C, pure CH4 | 0.11 | CNO |
| NiO10 | 800 °C, pure CH4 | 0.07 | CNO |
| Ni/SiO2 (ref. 11) | 700 °C, pure CH4 | 0.75 | CNT |
NixPty catalyst was prepared by hydrazine reduction of Ni(NO3)2 and/or H2PtCl6 in a water-in-oil (W/O) reverse microemulsion system (see ESI catalysts preparation and Fig. S1†). The size of particles synthesized by reverse microemulsion method is reported to be strongly influenced by water-surfactant molar ratio (Rw) and concentration of reagents.14 By varying the synthesization conditions as illustrated in Table 2, NixPty with same particle size of ca. 30 nm, as well as Ni9Pt1 samples with different particle size of 7–40 nm were prepared in Fig. S2† and 1, respectively. Pure Ni and Pt samples were also synthesized, whereas Pt sample is with much smaller size (3 nm) than that of Ni (30 nm) prepared at the same microemulsion condition. On NixPty samples, monodispersed spherical particles can be clearly observed, while high Rw and precursor concentration would result in large particle size.
| Condition | Sample sizec [nm] | ||||||
|---|---|---|---|---|---|---|---|
| Rwa | CNib | Ni99Pt1 | Ni9Pt1 | Ni8Pt2 | Ni7Pt3 | Ni5Pt5 | Ni3Pt7 |
| a Rw: water-surfactant molar ratio.b Ni2+ concentration in microemulsion [mol L−1].c Size was measured by TEM analysis.d Pt4+ concentration in microemulsion [mol L−1]. | |||||||
| 10 | 0.46 | 29 | 31 | 32 | — | — | — |
| 10 | 0.24 | — | 26 | — | 28 | 29 | — |
| 10 | 0.18 | — | 20 | — | — | — | 30 |
| 4.8 | 0.18 | — | 7 | — | — | — | — |
| 6.5 | 0.18 | — | 15 | — | — | — | — |
| 18 | 0.46 | — | 40 | — | — | — | — |
| 10 | 0.46 | Ni: 30 nm | |||||
| 10 | 0.46d | Pt: 3 nm | |||||
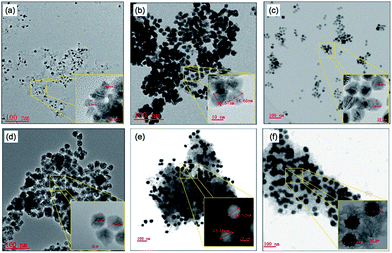 | ||
| Fig. 1 TEM of Ni9Pt1 with varied particle size. (a) 7 nm; (b) 15 nm; (c) 20 nm; (d) 26 nm; (e) 33 nm; (f) 40 nm. | ||
On NixPty samples with same particles size of 30 nm, the XRD patterns in Fig. 2(a) confirm the typical Pt diffraction peaks with no detectable Ni diffraction peaks. Compared to Pt sample, NixPty samples show a slightly enlarged peaks with a delicate shift to a higher 2θ. These suggest Ni is incorporated into the Pt fcc structure to form an alloy phase with lattice contraction.15,16 Taking Ni9Pt1 as a representative sample, the composition was further investigated by energy-dispersive X-ray spectroscopy (EDX). Fig. 2(b) shows a high angle annular dark field (HAADF)-scanning transmission electron microscope (STEM) image of a single Ni9Pt1 particle, while the EDX area scan along the green square and line scan along the red dotted arrow are shown in Fig. 2(c) and (d), respectively. Only Ni and Pt characteristic peaks are observed from EDX area scan, while the EDX line scan Ni profile clearly indicates that the Ni content on the surface is significantly lower than that in the center for this single Ni9Pt1 particle. These suggest that the synthesized Ni9Pt1 has an alloyed Ni–Pt bulk structure, with a Ni-scarce/Pt-rich surface. Deconvolution of Pt 4f and Ni 2p X-ray photoelectron spectroscopy (XPS) regions (Fig. 2(e)) indicates the coexistence of both Pt0 and Ni0 metals on the surface of Ni9Pt1. The formation of oxidized Pt2+ and Ni2+ may have been caused during the sample preparation process for XPS analyses.17 The Pt 4f region overlaps with Ni 3p region. The Pt 4f core level was fitted using two doublets Pt 4f7/2–Pt 4f5/2 with a fixed area ratio equal to 4![[thin space (1/6-em)]](https://www.rsc.org/images/entities/char_2009.gif) :
:![[thin space (1/6-em)]](https://www.rsc.org/images/entities/char_2009.gif) 3 and doublet separation of 3.3 eV. The Pt 4f7/2 components are located at 70.6 eV and 72.4 eV attributed to Pt metal and Pt(OH)2 respectively. The negative shift of the 4f peaks (about 0.4 eV compared to pure Pt metal) should be attributed to the alloying of Pt with Ni atoms,18 which is agreed well with the XRD and STEM-EDX results. Additional peaks located at 65.6 eV, 67.7 eV and 71.6 eV correspond to Ni 3p from Ni metal, and to Ni 3p component and its corresponding satellite from Ni(OH)2 respectively. The Ni 2p3/2 component was fitted with three peaks located at 852.6, 855.6 and 861.2 eV. The peak at 852.5 eV corresponds to Ni 2p3/2 from Ni metal. The peaks at 855.6 and 861.2 eV are attributed to Ni 2p3/2 component and its corresponding satellite from Ni(OH)2, respectively. The same structures were also confirmed on other NixPty samples shown in Fig. S3.†
3 and doublet separation of 3.3 eV. The Pt 4f7/2 components are located at 70.6 eV and 72.4 eV attributed to Pt metal and Pt(OH)2 respectively. The negative shift of the 4f peaks (about 0.4 eV compared to pure Pt metal) should be attributed to the alloying of Pt with Ni atoms,18 which is agreed well with the XRD and STEM-EDX results. Additional peaks located at 65.6 eV, 67.7 eV and 71.6 eV correspond to Ni 3p from Ni metal, and to Ni 3p component and its corresponding satellite from Ni(OH)2 respectively. The Ni 2p3/2 component was fitted with three peaks located at 852.6, 855.6 and 861.2 eV. The peak at 852.5 eV corresponds to Ni 2p3/2 from Ni metal. The peaks at 855.6 and 861.2 eV are attributed to Ni 2p3/2 component and its corresponding satellite from Ni(OH)2, respectively. The same structures were also confirmed on other NixPty samples shown in Fig. S3.†
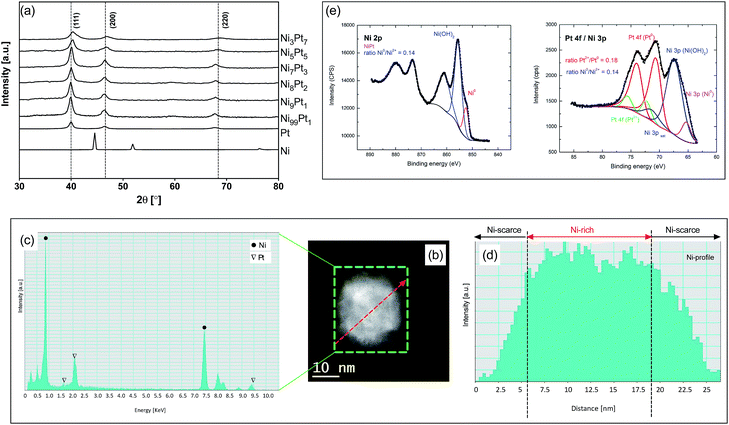 | ||
| Fig. 2 (a) XRD on NixPty; (b) HAADF-STEM of Ni8Pt2; (c) EDX area scan along the square; (d) EDX line scan along the arrow; (e) XPS of Ni8Pt2. | ||
The turnover frequency (TOF) of CH4 during methane cracking as a function of temperature ranged from 500 to 900 °C over NixPty samples with 30 nm particle size (Ni and Pt are added as control) is presented in Fig. 3(a). The initial 10 minutes conversion was used to ensure precise control of catalytic activity of the preformed catalysts. Because of endothermic character of methane cracking reaction, high temperature favors large CH4 TOF value over all tested samples. The apparent activation energies (Ea) at the temperature ranged from 500 to 900 °C calculated from the Arrhenius plots are further plotted with catalysts composition in term of Ni/(Ni + Pt) molar ration as illustrated in Fig. 3(b). The first H abstraction from CH4 is normally considered as the rate-limiting step for methane cracking. The use of Pt (111) instead of Ni (111) is reported to be able to reduce the activation barrier by 15–30 kJ mol−1.18,19 With respect to 60 kJ mol Ea on Ni catalyst during methane cracking, Pt catalyst showed a lower value of 42 kJ mol−1. Adding a little amount of Pt (1–10 mol%) to Ni sample drastically decreases the Ea until it reaches a valley at the Ni![[thin space (1/6-em)]](https://www.rsc.org/images/entities/char_2009.gif) :
:![[thin space (1/6-em)]](https://www.rsc.org/images/entities/char_2009.gif) Pt = 9
Pt = 9![[thin space (1/6-em)]](https://www.rsc.org/images/entities/char_2009.gif) :
:![[thin space (1/6-em)]](https://www.rsc.org/images/entities/char_2009.gif) 1 with a value of 35 kJ mol. Continually increasing the Pt addition amount would increase the Ea until reaching a stable stage after Ni molar concentration is lower than 50%. In all, NixPty with Pt concentration between 5–15 mol% presents Ea value lower than both Ni and Pt samples; whereas others show Ea value between Ni and Pt samples.
1 with a value of 35 kJ mol. Continually increasing the Pt addition amount would increase the Ea until reaching a stable stage after Ni molar concentration is lower than 50%. In all, NixPty with Pt concentration between 5–15 mol% presents Ea value lower than both Ni and Pt samples; whereas others show Ea value between Ni and Pt samples.
 | ||
| Fig. 3 (a) Arrhenius plots and apparent activation energies over NixPty; (b) activation energy vs. Ni/Pt composition. Reaction condition: pure CH4, space velocity = 1.0 L gcat−1 min−1. | ||
The structures of catalysts with different Ni/Pt ratio were estimated by density functional theory (DFT) study (see ESI† DFT study), in order to understand their methane cracking performance in Fig. 3(b). On Ni48Pt7 with Ni/(Ni + Pt) ratio of 0.9, in the temperature range of 547–794 °C, the DFT study indicates a random alloy-like structure with majority of Pt are incorporated into the core of the nanocluster and the minority remaining on the surface, as shown in Fig. 4(a and b); however, for Ni28Pt27 with Ni/(Ni + Pt) ratio of 0.5, a higher temperature than 1000 °C is required to form such random alloy-like disposition. Between 157 and 702 °C, a considerable amount of Pt is estimated as fully segregated on the surface and the other randomly distributed outside and inside the nanocluster, as shown in Fig. 4(c–e). Therefore, for Ni–Pt sample with Ni/(Ni + Pt) ratio of 0.9, the synergic effect between Ni–Pt alloy would help to significantly decrease the activation energy during methane cracking at 500–900 °C.
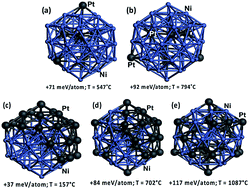 | ||
| Fig. 4 DFT-relaxed structural configurations of Ni–Pt nanocluster: (a and b) Ni48Pt7; (c–e) Ni28Pt27. Color legend: Ni in light blue and Pt in dark gray. | ||
The further methane cracking testing in terms of methane conversion and stability with the time on stream of 60 minutes were further investigated at 500–900 °C shown in Fig. S4.† Obviously, adding Pt to Ni improves both activity and stability. Compared to Ni sample, the increment of activity on NixPty is resulted from the lowering of Ea, whilst the better stability is probably owing to the thermal stability reinforcement of Ni particles by Pt additive. Especially on Ni9Pt1 sample, at the temperature 500–700 °C, stable methane conversions are achieved; even at a very high reaction temperature of 800 °C, only a little deactivation of 10% methane conversion decrease is detected during 60 minutes.
During methane cracking on Ni catalysts, three main steps are assumed to occur:3 (i) CH4 bond activation to be decomposed into H2 and carbon, (ii) atomic carbon diffusion through the bulk or the surface of Ni particles, and (iii) precipitation as graphite at specific planes of Ni. The crystallinity and graphitization degree of the deposited carbon on Ni9Pt1 are explained based on the peak intensity ratio value (ID/IG) of Raman spectra9 in Fig. 5, and the values are found to be decreased with temperature increment from 500 to 900 °C. This indicates a higher reaction temperature favors the formation of a higher graphitization of the deposited carbons. However, it is oblivious that high temperatures of 800–900 °C is not favorable for methane cracking stability; whilst distinct carbon morphologies were confirmed on spent catalysts between 500–700 °C and 800–900 °C shown in Fig. S5.† At a high reaction temperature, methane decomposition to carbon is reasonably assumed to proceed with a much higher rate than that of carbon diffusion, which may result in the carbon diffusion through Ni surface prevailing on Ni bulk. This explains the formation of CNO on 800–900 °C spent sample; and due to the encapsulation of catalysts by CNO as in Fig. S5(d and e),† a quick and severe deactivation can be evidenced. At a low reaction temperature, when the atomic carbon moves through the bulk of Ni particles and precipitates at the rare side of the Ni particles, the continuous formation of CNT would be favored as shown in Fig. S5(a–c).† Therefore, considering both activity and stability, 700 °C can be concluded as an optimized reaction temperature for methane cracking on Ni9Pt1.
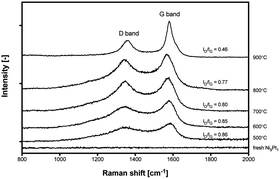 | ||
| Fig. 5 Raman spectra of carbon deposited on Ni9Pt1 after methane cracking at different temperatures in Fig. S4.† | ||
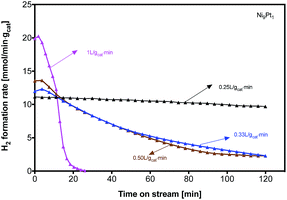
The influence of space velocity (SV) on H2 formation rate during methane cracking was further discussed at 700 °C on Ni9Pt1 in Fig. 6. Although a high SV increases a high initial H2 formation rate, it accelerates the deactivation with time on stream. A total deactivation can be seen during only 30 minutes methane cracking on Ni9Pt1 at the highest SV of 1 L gcat−1 min−1; whereas at a low SV of 0.25 L gcat−1 min−1, the sample shows a relatively stable H2 formation rate for 120 minutes. The TEM analyses in Fig. 7 indicate two kinds of CNTs formation over spent Ni9Pt1 after methane cracking at 700 °C with different SV. Bamboo-shaped CNTs encapsulating catalysts inside the tubes were observed on sample reacted at high SV, whereas the low SV spent sample mainly presented CNTs anchored to metal nanoparticles on the tip. The melting point of metallic Ni is around 1455 °C, Ni particle may change its shape only at a temperature above its Tamman temperature of 728 °C. Because methane cracking is an endothermic reaction, the temperature around Ni particle surface is, therefore, at somewhat overheat state, with respect to its surrounding temperature. As a result, also considering the melting-point depression at nano particles, the Ni9Pt1 particle of 30 nm may transfer into a quasi-liquid state even at a reaction temperature of 500 °C.20 Therefore, under the combination action of surface tension of the particle and stress of the CNT tube, the Ni9Pt1 particle shape may be changed from sphere to pear-like (Fig. 7(a)), stretched tube-like (Fig. 7(b)) and diamond-like shapes (Fig. 7(c–e)).
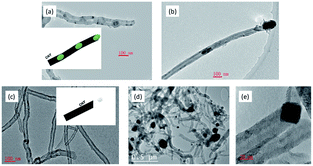 | ||
| Fig. 7 TEM over spent Ni9Pt1 after methane cracking at different SV in Fig. 6: (a and b) after reaction at SV of 1 L gcat−1 min−1; (c–e) after reaction at SV of 0.25 gcat−1 min−1. | ||
“Jumps” of the catalyst particles out of the graphite sheath to the top of the tube at regular time intervals is well known to explain the formation of CNTs.21 When a compressive force from the preferential precipitation of carbon atoms is weaker than the surface tension of the catalyst particle, the portion of the sucked and stretched catalyst would be pulled back to continually make carbon precipitate out and crystallize in the form of a cylindrical network on the surface of the catalyst particle and finally grow into tubular structures. However, if the precipitation rate is accelerated a lot by increasing the SV, the stretched part of a particle could not be completely pulled back, a droplet of the catalyst particle would be kept in the compartment of the tube, and thus form bamboo-shaped CNTs trapped metal particles inside.
The carbon yield during a 120 minutes methane cracking on Ni9Pt1 at 700 °C are plotted as a function of the Ni crystal size in Fig. 8. It is interesting to see the carbon yield is very sensitive to Ni crystal size in the range of 7–40 nm. The optimized Ni size is illustrated as near 15 nm, while Ni crystals that are too large or too small showed a low carbon yield. As explained by Fig. S5,† at 700 °C methane cracking, CNT would be preferred to grow on Ni particles. Obviously, the methane decomposition rate on the surface of a Ni particle with a small crystal size must be very high, because of a large surface area. In such case, the carbon atom diffusion through Ni bulk would the rate-determining step. The carbon concentration gradient between the Ni surface and body usually leads to the carbon diffusion through Ni bulk particles. A small Ni particle may result in a higher carbon concentration inside Ni than that of Ni surface,22 which would lower the driving force for the carbon diffusion through the Ni crystals. Therefore, although a small crystal size of Ni can provide a high diffusion flux area and a shorter bulk diffusion length, a low carbon atom diffusion rate through Ni bulk may result in the catalyst fast deactivation and thus a low carbon yield. On the other hand, too great a Ni particle size yields a slow methane cracking rate on the surface due to the low surface area, which reduces the carbon formation. Therefore, an optimal crystal size of Ni of around 15 nm was found to exhibit highest carbon yield, probably because of relatively high initial cracking rate and slow deactivation.
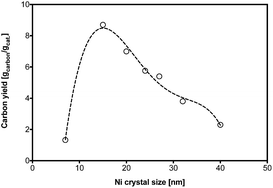 | ||
| Fig. 8 Carbon yield at Ni9Pt1 with different crystal size during methane cracking. Reaction condition: pure CH4, space velocity = 0.25 L gcat−1 min−1, 700 °C. | ||
In summary, bulk Ni–Pt catalysts with different composition and particle size were synthesized via a reverse microemulsion method for methane cracking. The Ni9Pt1 sample exhibits the lowest apparent activation energy, which probably results from the synergic effect of the Ni–Pt alloy. Furthermore, the Ni9Pt1 sample with particle size of around 15 nm tested at a reaction temperature of 700 °C and a low SV of 0.25 L gcat−1 min−1, is finally optimized to get the best methane cracking performance in terms of carbon yield and H2 formation rate.
Conflicts of interest
There are no conflicts to declare.Acknowledgements
We thank KAUST and the National Natural Science Foundation of China (21403108) for the financial support.References
- S. Durr, M. Muller, H. Jorschick, M. Helmin, A. Bosmann, R. Palkovits and P. Wasserscheid, ChemSusChem, 2017, 10, 42–47 CrossRef PubMed.
- T. V. Choudhary, C. Sivadinarayana, C. C. Chusuei, A. Klinghoffer and D. W. Goodman, J. Catal., 2001, 199, 9–18 CrossRef CAS.
- L. Zhou, Y. Guo and K. Hideo, AIChE J., 2014, 60, 2907–2917 CrossRef CAS.
- N. Muradov, F. Smith and A. T. Raissi, Catal. Today, 2005, 102, 225–233 CrossRef.
- Y. Li, B. C. Zhang, X. W. Xie, J. L. Liu, Y. D. Xu and W. J. Shen, J. Catal., 2006, 238, 412–424 CrossRef CAS.
- J. L. Figueiredo, J. J. M. Orfao and A. F. Cunha, Int. J. Hydrogen Energy, 2010, 35, 9795–9800 CrossRef CAS.
- A. C. Lua and H. Y. Wang, Appl. Catal., B, 2014, 156, 84–93 CrossRef.
- A. C. Lua and H. Y. Wang, Appl. Catal., B, 2013, 132, 469–478 CrossRef.
- M. Pudukudy, Z. Yaakob and M. S. Takriff, RSC Adv., 2016, 6, 68081–68091 RSC.
- U. P. M. Ashik and W. M. A. W. Daud, J. Taiwan Inst. Chem. Eng., 2016, 61, 247–260 CrossRef CAS.
- M. Pudukudy and Z. Yaakob, Chem. Eng. J., 2015, 262, 1009–1021 CrossRef CAS.
- M. Pudukudy, Z. Yaakob and Z. S. Akmal, Appl. Surf. Sci., 2015, 353, 127–136 CrossRef CAS.
- S. Takenaka, Y. Shigeta, E. Tanabe and K. Otsuka, J. Catal., 2003, 220, 468–477 CrossRef CAS.
- K. A. Dahlberg and J. W. Schwank, Chem. Mater., 2012, 24, 2635–2644 CrossRef CAS.
- W. O. Oduro, N. Cailuo, K. M. K. Yu, H. W. Yang and S. C. Tsang, Phys. Chem. Chem. Phys., 2011, 13, 2590–2602 RSC.
- T. Y. Xia, J. L. Liu, S. G. Wang, C. Wang, Y. Sun, L. Gu and R. M. Wang, ACS Appl. Mater. Interfaces, 2016, 8, 10841–10849 CAS.
- L. Wen, X. Q. Du, J. Su, W. Luo, P. Cai and G. Z. Cheng, Dalton Trans., 2015, 44, 6212–6218 RSC.
- Q. Sun, Z. Ren, R. M. Wang, N. Wang and X. Cao, J. Mater. Chem., 2011, 21, 1925–1930 RSC.
- F. Vines, Y. Lykhach, T. Staudt, M. P. A. Lorenz, C. Papp, H. P. Steinruck, J. Libuda, K. M. Neyman and A. Gorling, Chem.–Eur. J., 2010, 16, 6530–6539 CrossRef CAS PubMed.
- J. C. Guevara, J. A. Wang, L. F. Chen, M. A. Valenzuela, P. Salas, A. Garcia-Ruiz, J. A. Toledo, M. A. Cortes-Jacome, C. Angeles-Chavez and O. Novaro, Int. J. Hydrogen Energy, 2010, 35, 3509–3521 CrossRef CAS.
- L. Zhou, L. R. Enakonda, M. Harb, Y. Saih, A. Aguilar-Tapia, S. Ould-Chikh, J.-l. Hazemann, J. Li, N. Wei, D. Gary, P. Del-Gallo and J.-M. Basset, Appl. Catal., B, 2017, 208, 44–59 CrossRef CAS.
- D. Chen, K. O. Christensen, E. Ochoa-Fernandez, Z. X. Yu, B. Totdal, N. Latorre, A. Monzon and A. Holmen, J. Catal., 2005, 229, 82–96 CrossRef CAS.
Footnote |
| † Electronic supplementary information (ESI) available. See DOI: 10.1039/c7ra08682b |
| This journal is © The Royal Society of Chemistry 2017 |

